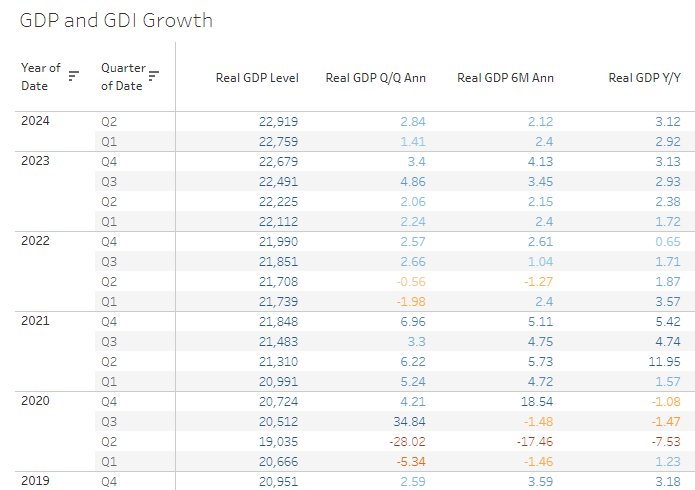
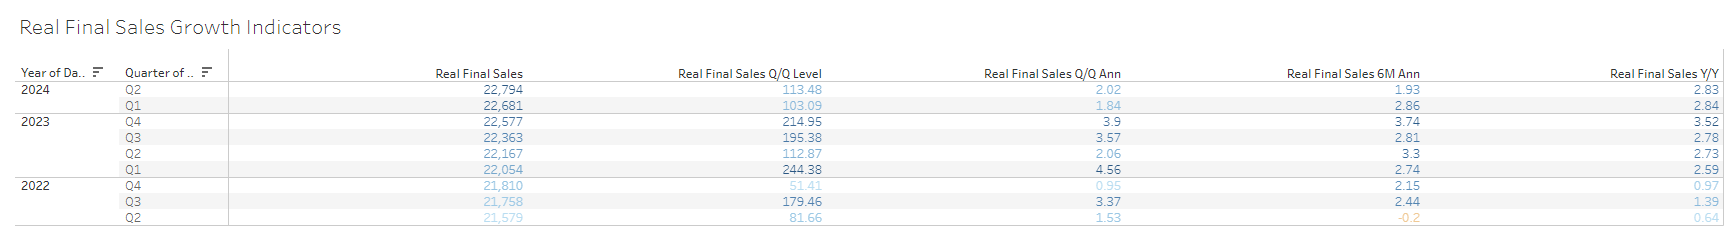
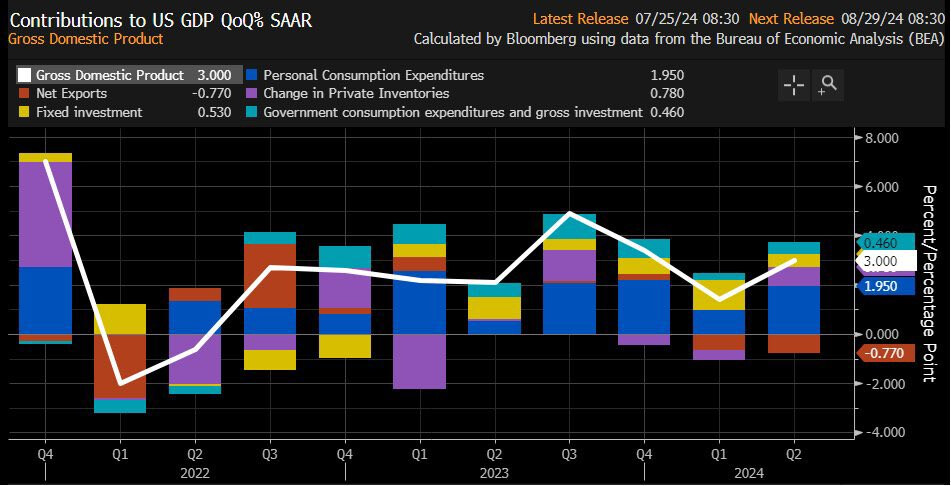
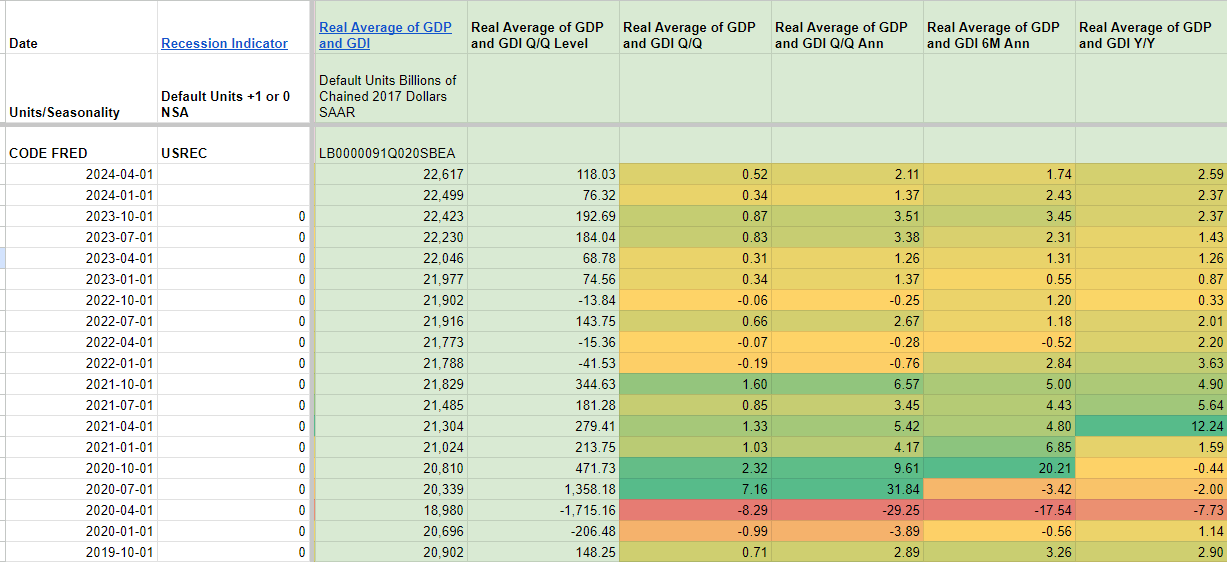
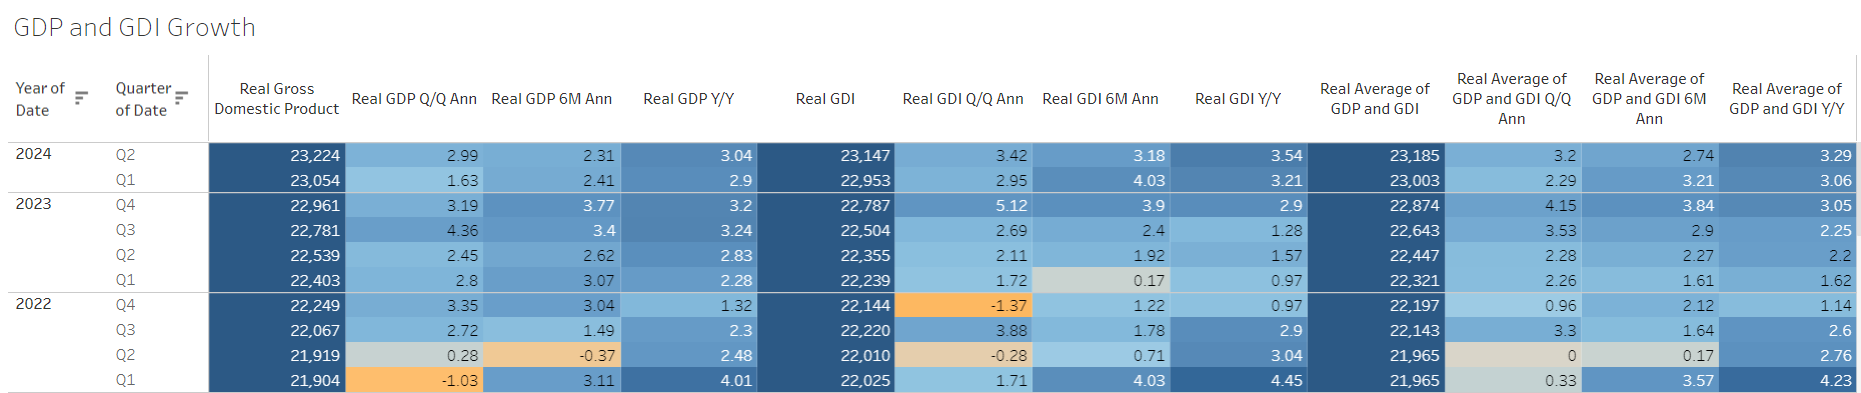
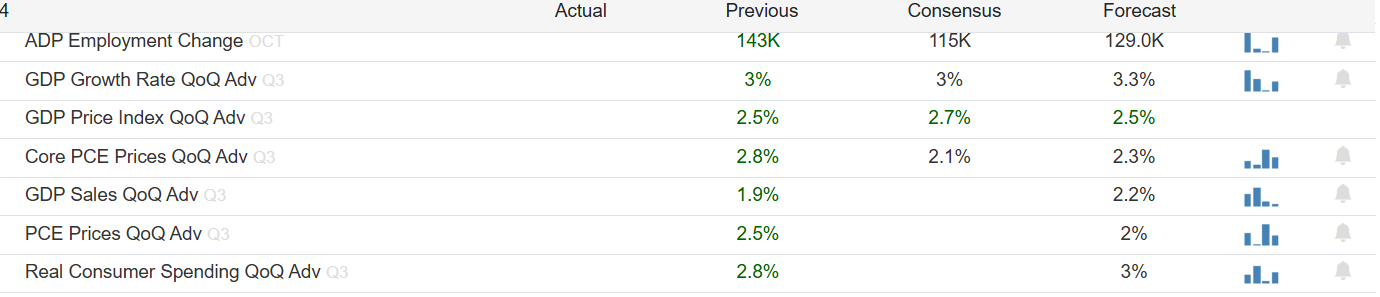
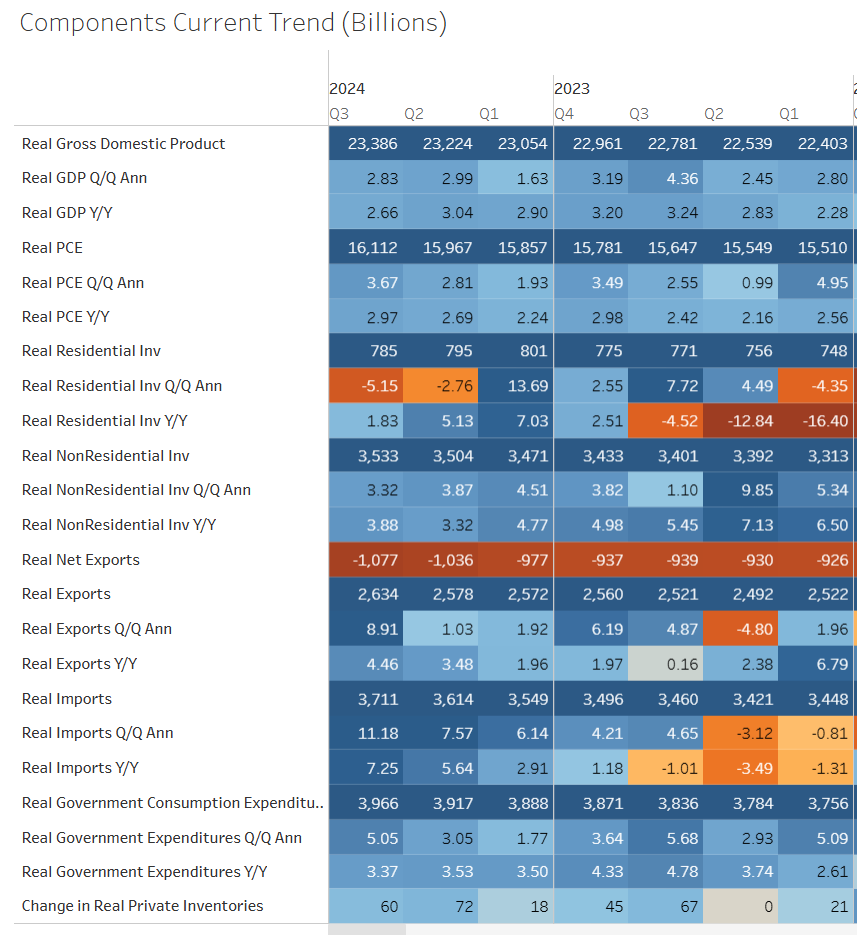
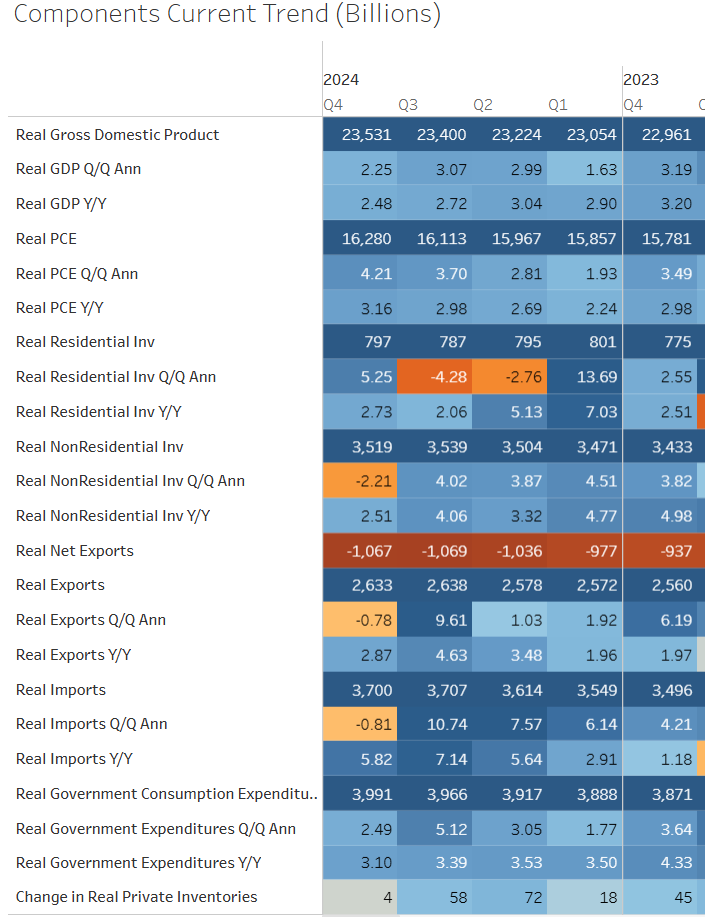
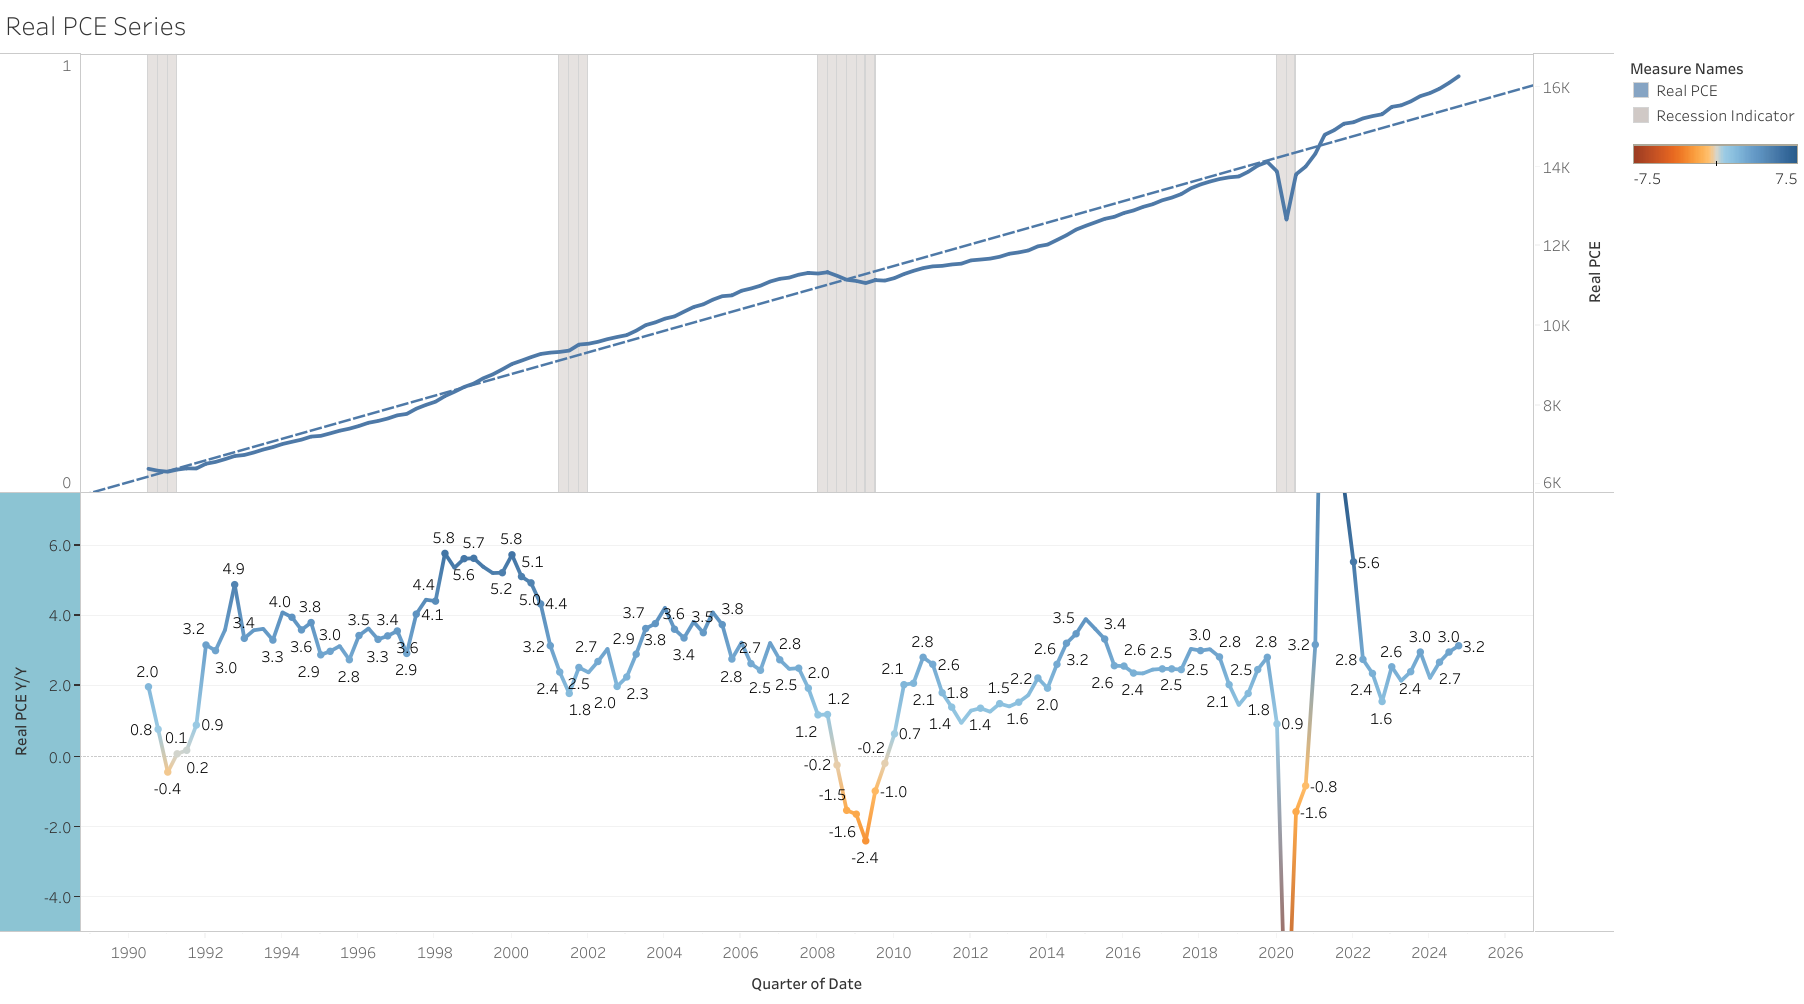
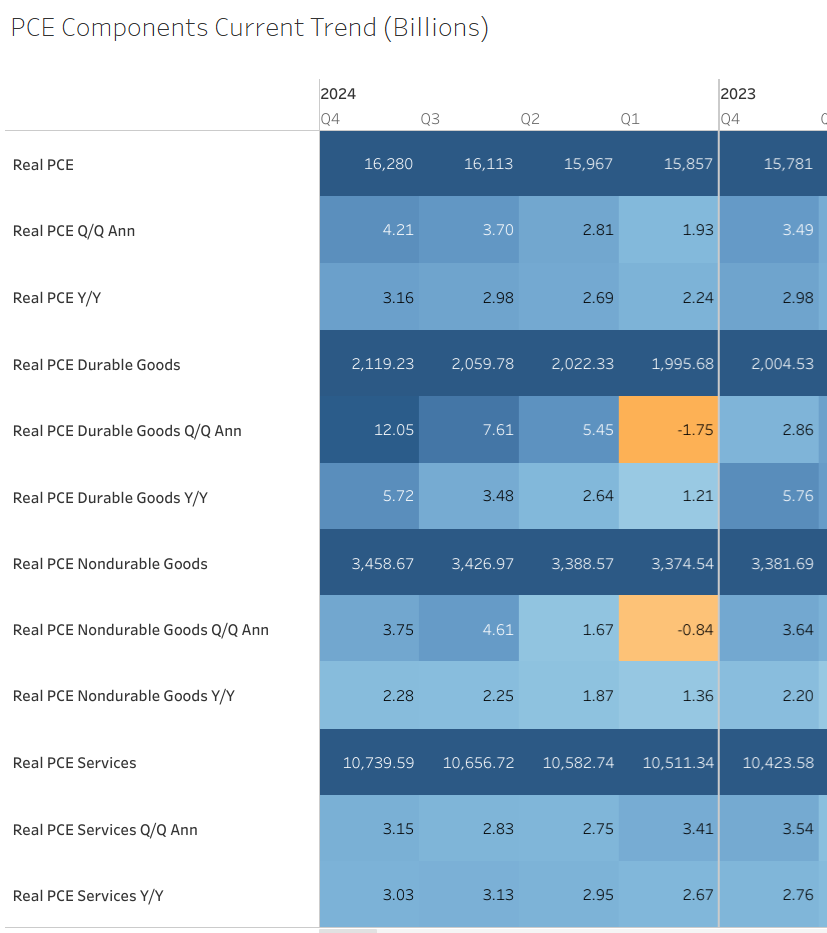
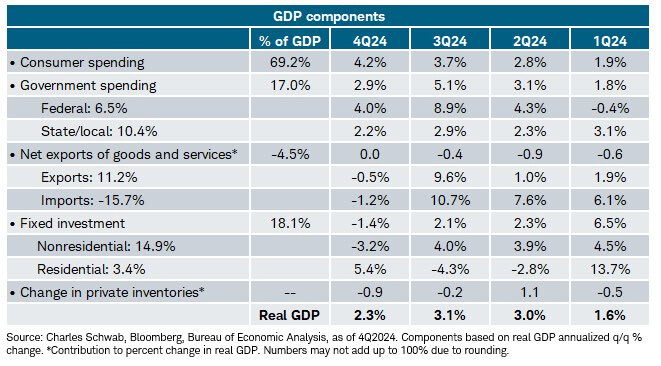
Real Final sales (which measure final demand without inventory changes), were not as strong but still with stable growth, growing 2% Q/Q Ann (vs 1.85% in Q1 2024) and 2.83% Y/Y (vs 2.84% in Q1 2024).
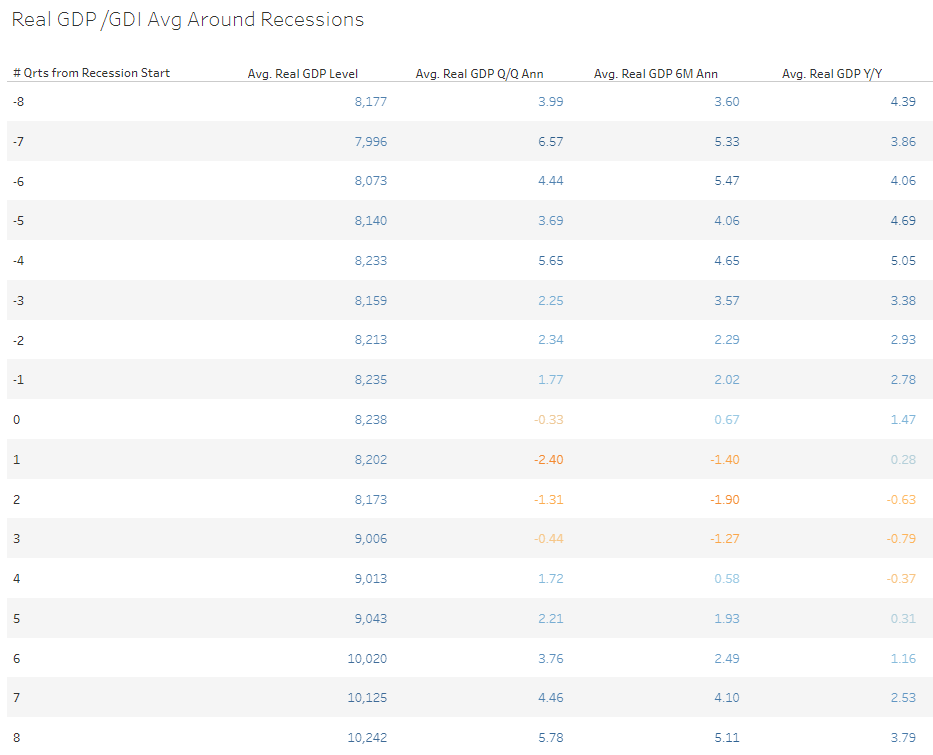
I would like to point out that GDP is not a good indication of future developments. Is common to still experience strong or positive growth even 1 quarter before a recession starts.
On average (excluding 2020 recession) GDP shows a 1.77% Q/Q Ann and a 2.78% Y/Y growth 1 quarter before a recession has started.
I am not implying that a recession will start next quarter either, only that aggregate GDP is only a coincident indicator and typically declines consistently only at the onset of a recession. Within GDP, residential investment and durable goods tend to be more leading indicators. But I am still working on this complete analysis and will post my conclusions when finished.
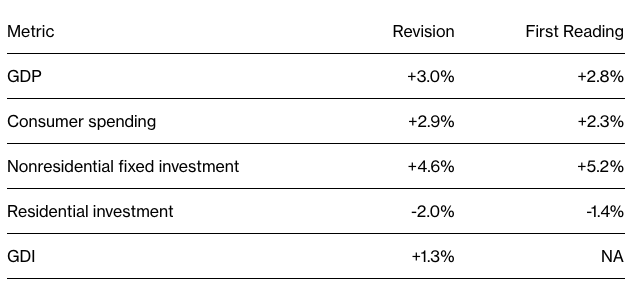
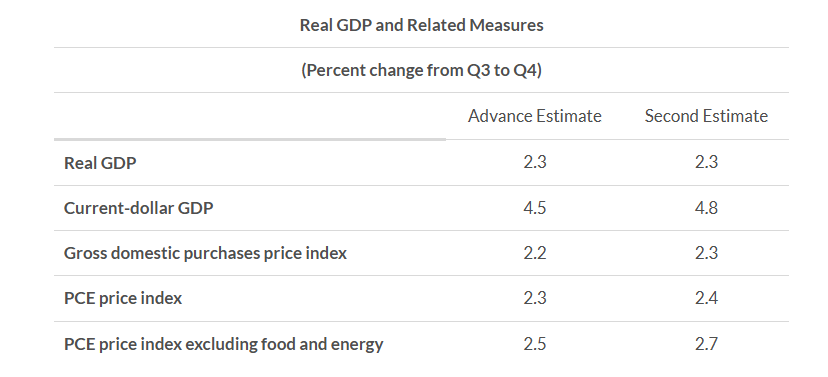
Revision is due almost completely to consumer spending, since residential investment, nonresidential investment, and government spending were revised down.
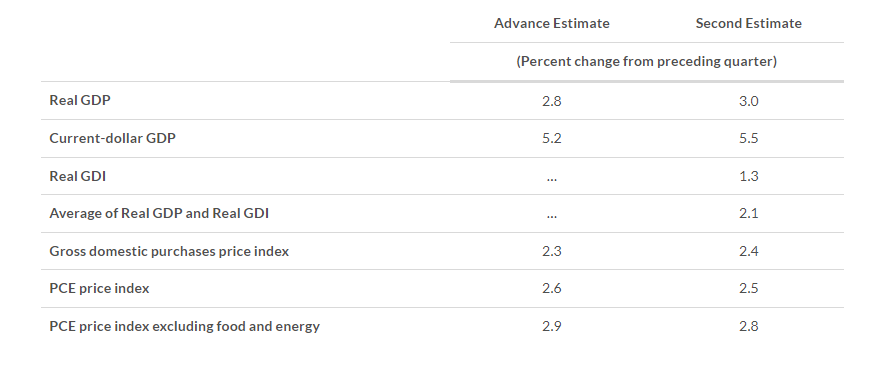
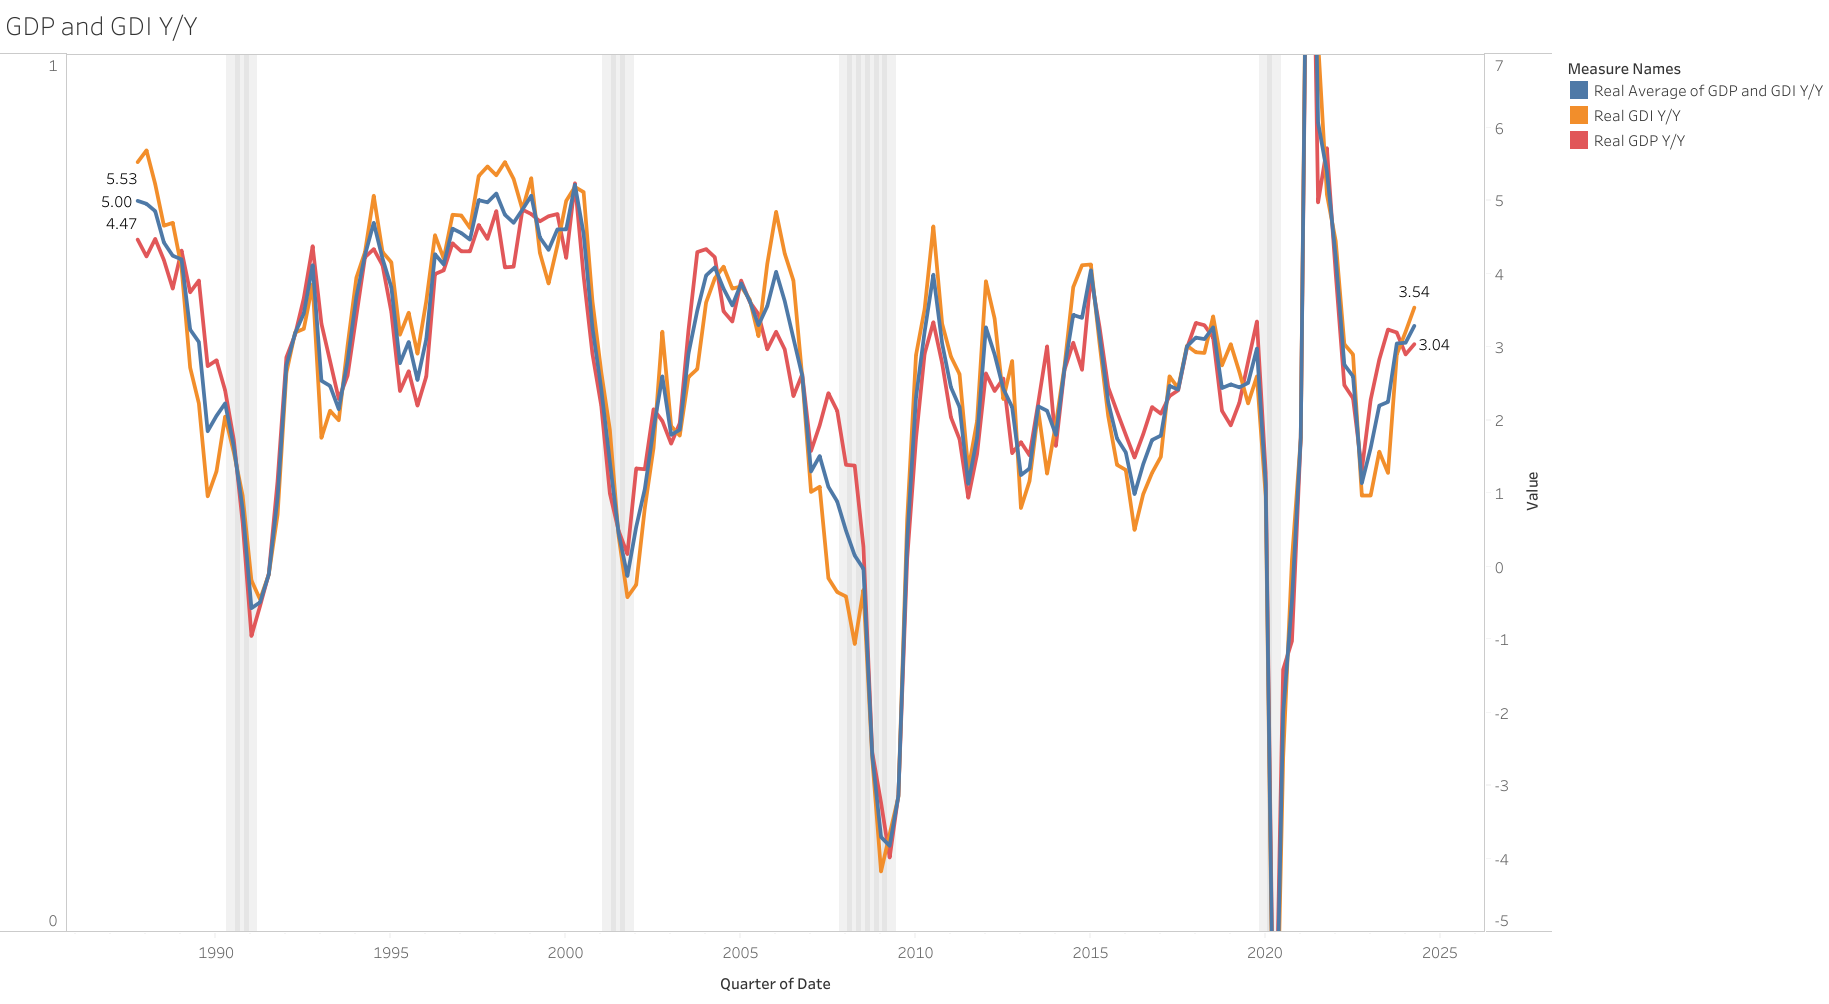
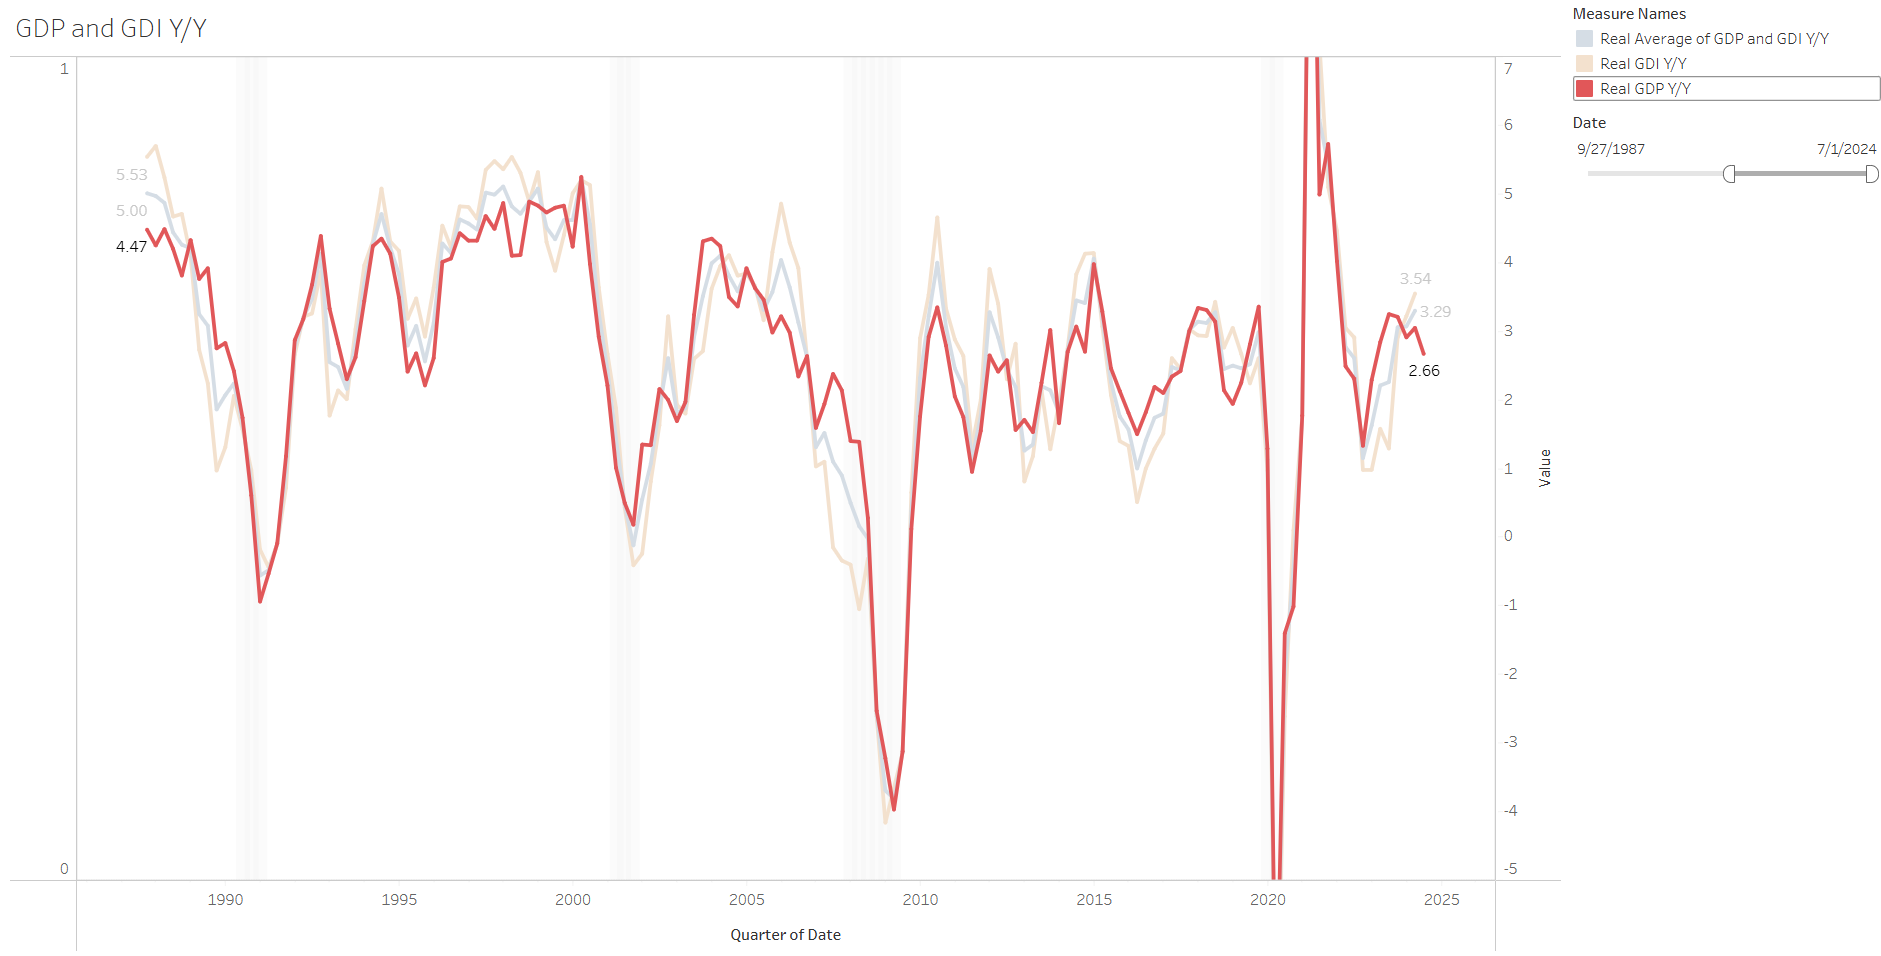
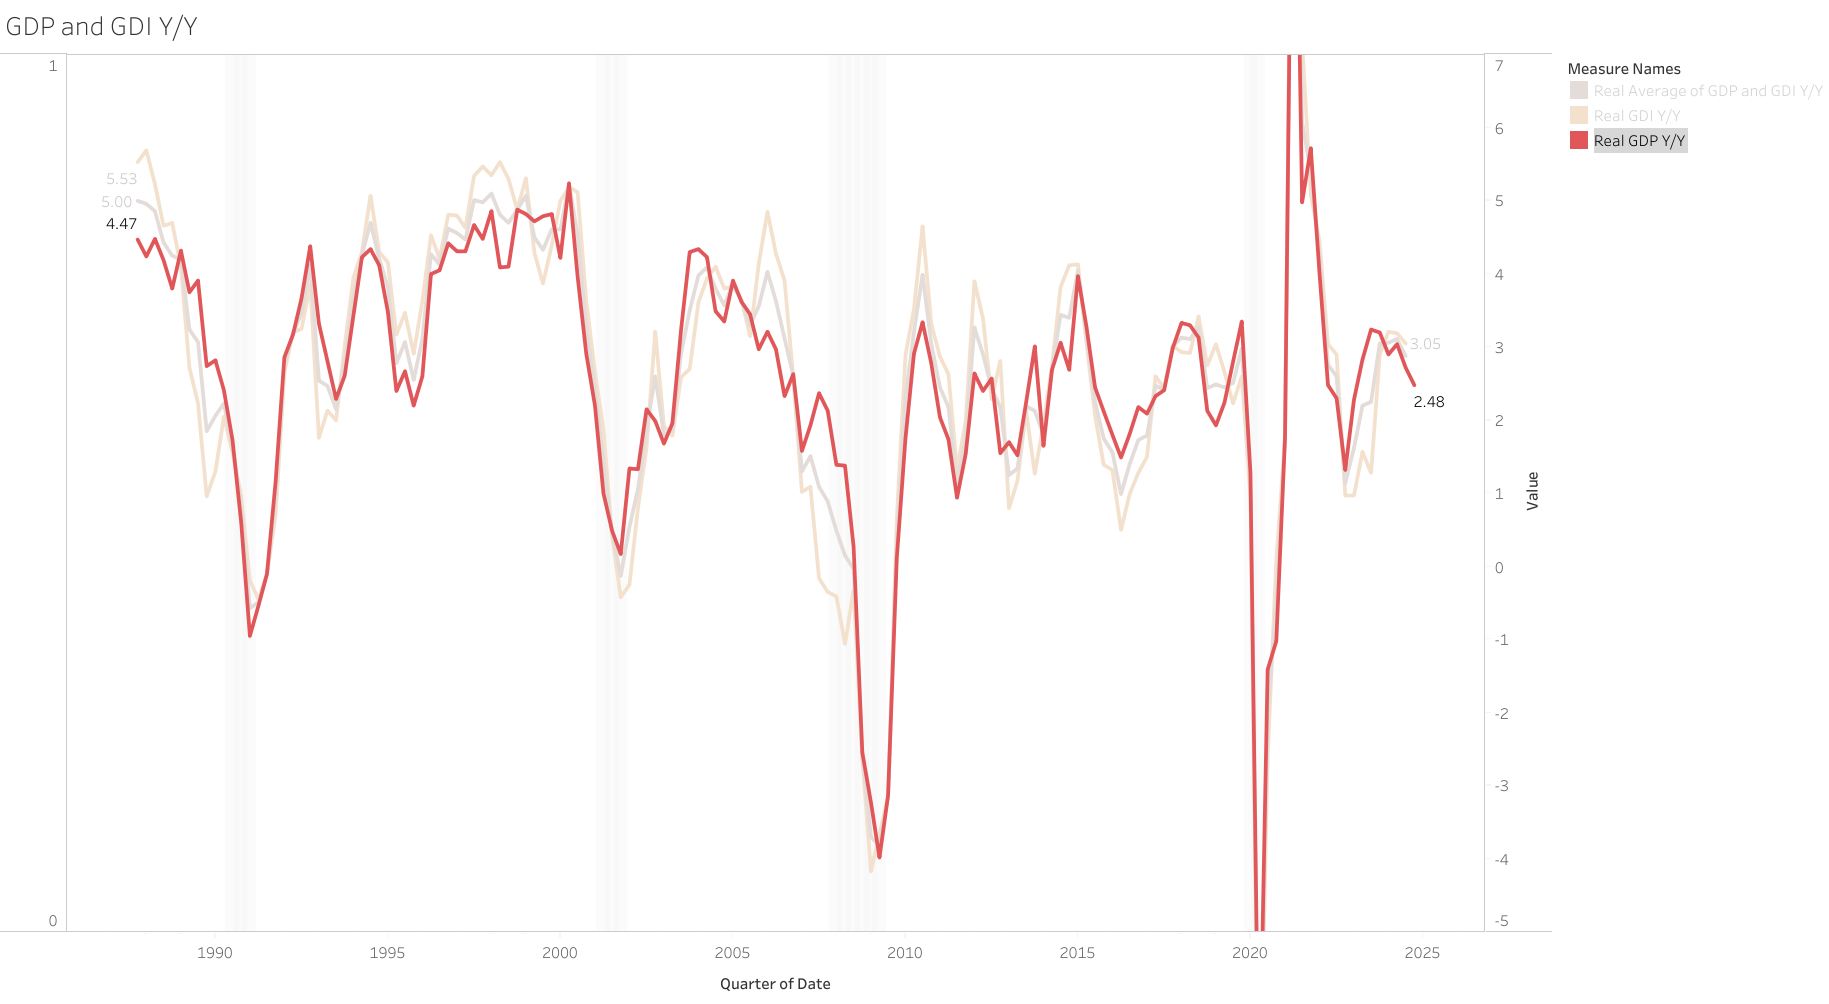
Real Gross Domestic Income (which is supposed to be the same as GDP) continues to be weaker than GDP at 2% Y/Y vs 3.15% of GDP.
The average of GDP and GDI is currently at 2.5% Y/Y, not as strong as GDP alone suggests, but still relatively good. (on par with average from 2010-2019)
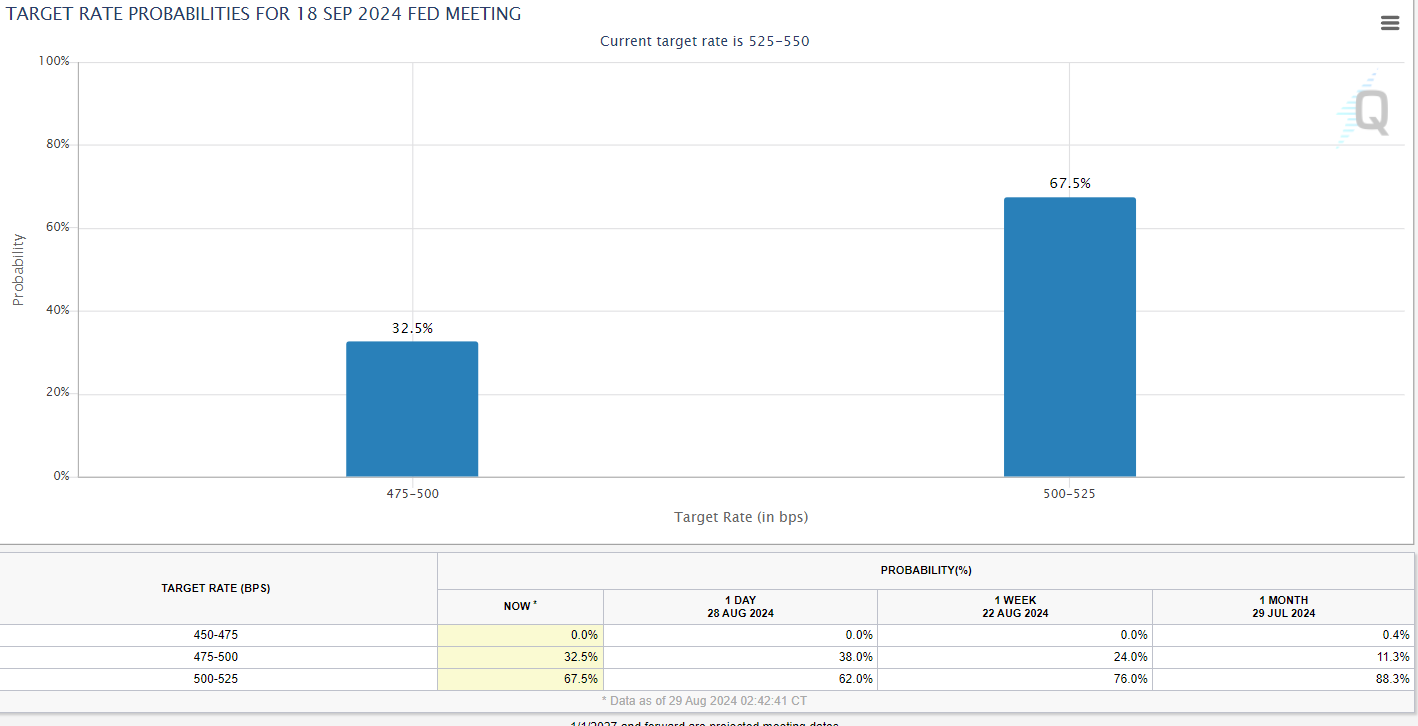
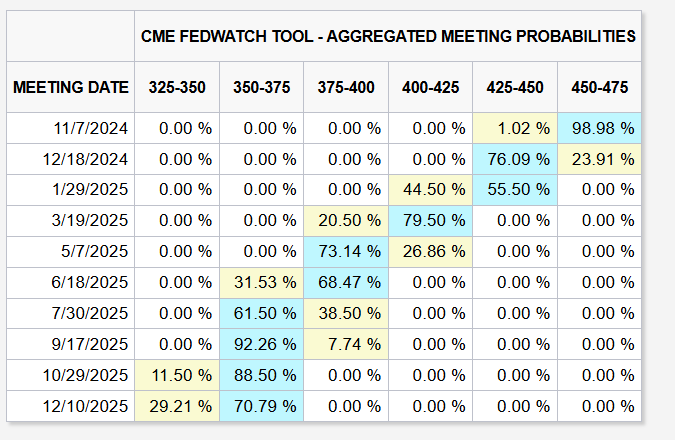
This report probably increased the probability that only 25bps of cuts with happen in September imo (markets only increased it slightly), unless there is a horrible report for employment for august.
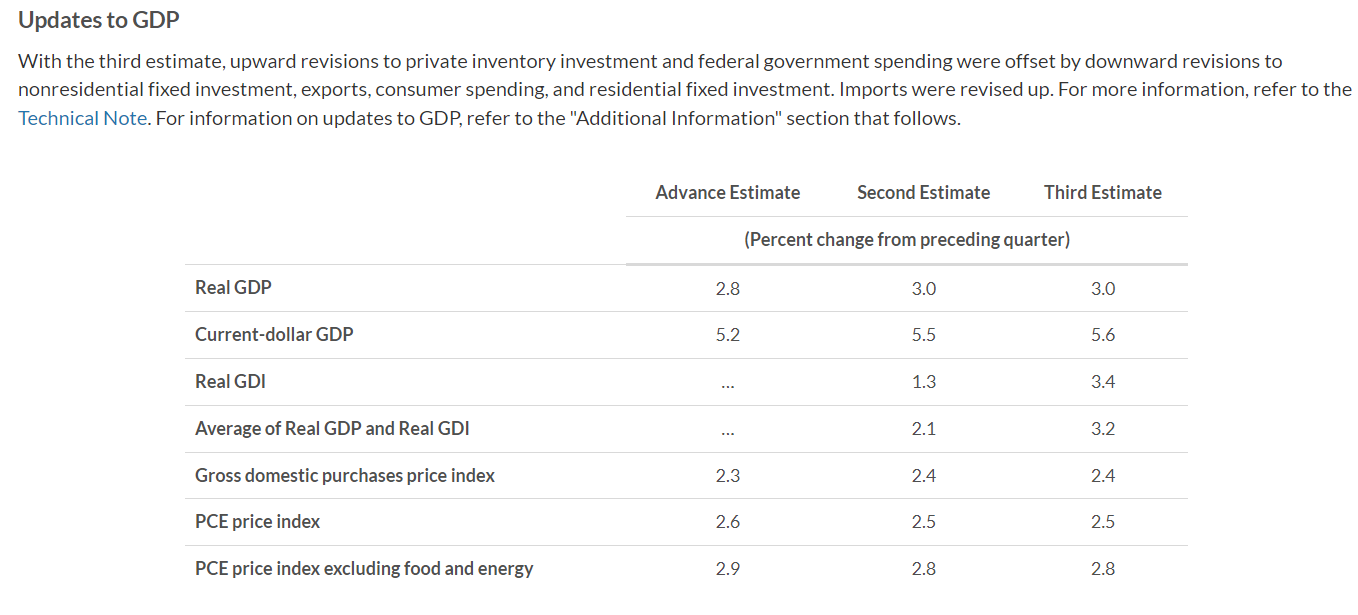
The annual revision revealed a better alignment between Gross Domestic Income (GDI) and Gross Domestic Product (GDP), effectively closing the gap that had previously existed between the two. This adjustment indicates that the current economy is in a robust state, this was largely driven by significant revisions to income data.
Additionally, the two negative quarters recorded in 2022 have been revised upward, eliminating the classification of a technical recession for that year in the latest data
Real GDP increased at an average annual rate of 2.3 percent from 2018 to 2023, 0.2 percentage points higher than the previously published
Real GDI increased at an average annual rate of 2.2 percent, 0.4 percentage points higher than previously published
The economy is currently growing above potential and the long term avg, this performance is due to some of these reasons still present in my opinion:
Real Wage Growth: With inflation easing in 2024 and wage growth holding steady around 4%, real wage gains are increasing again, boosting consumers’ purchasing power and, consequently, supporting consumer spending.
Productivity Gains: Productivity growth is currently also slightly higher than previous period averages
Wealth Effect: Rising equity and housing prices have likely bolstered consumer optimism in spending through the wealth effect, as households feel more financially secure and willing to spend
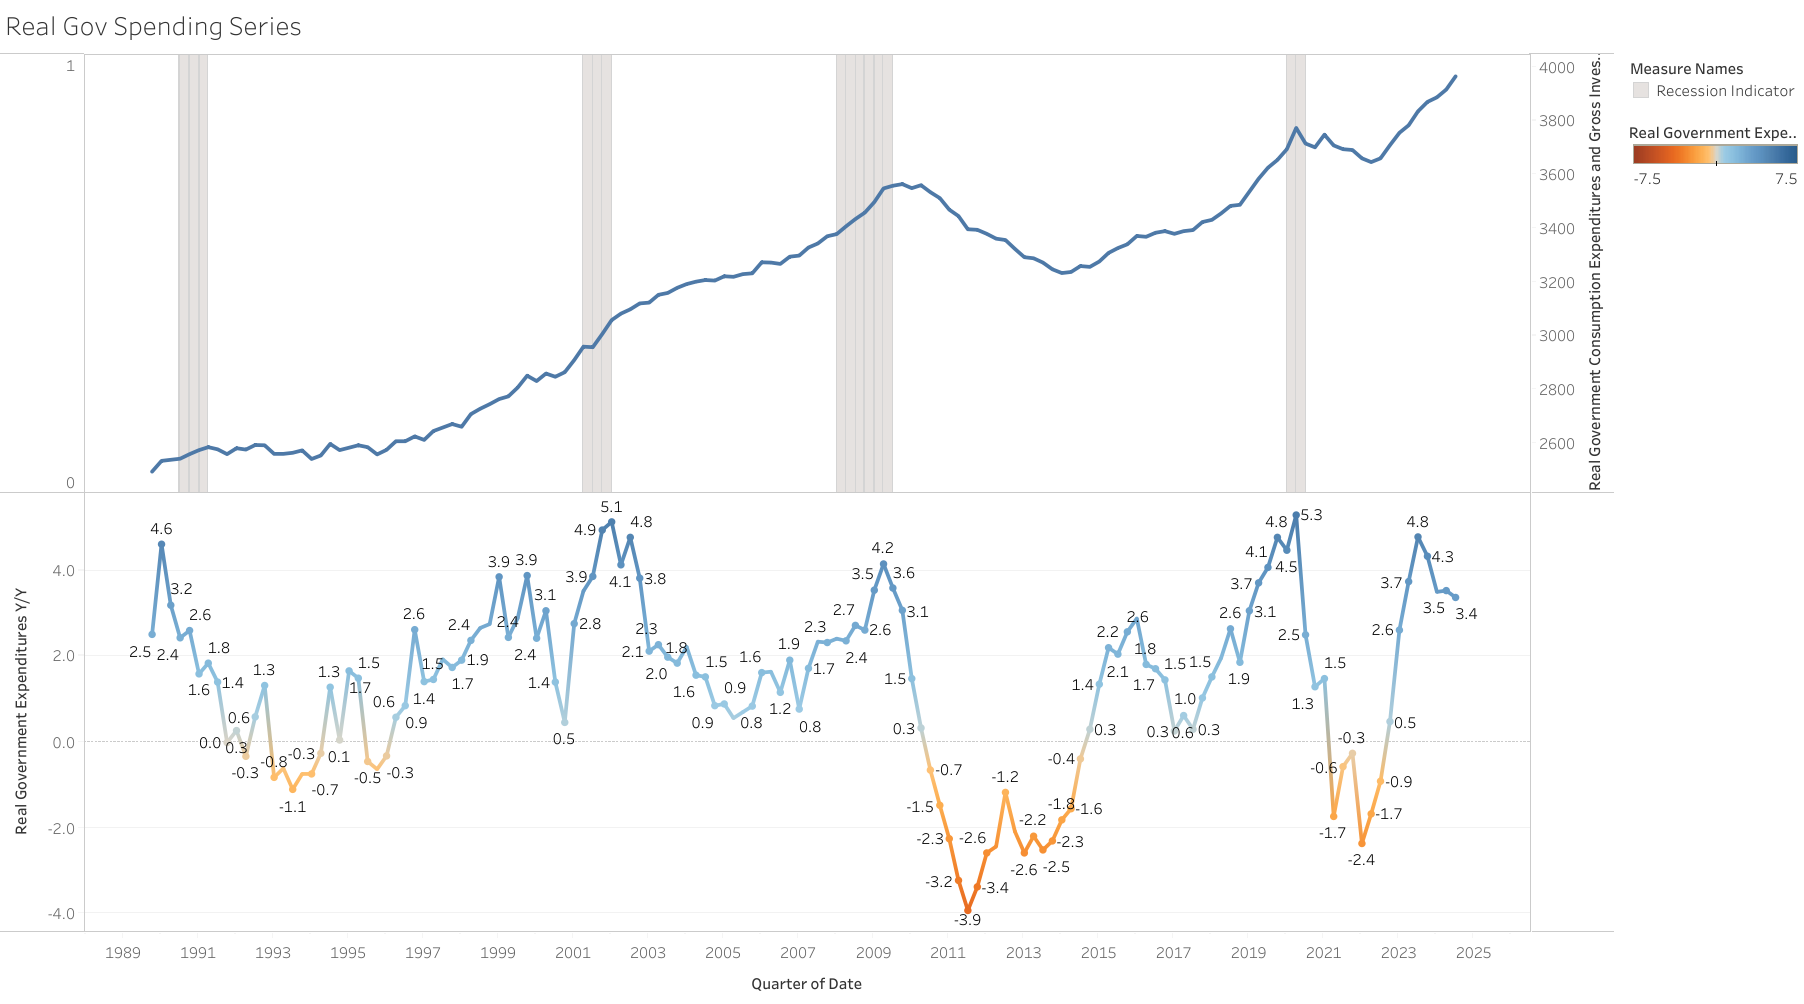
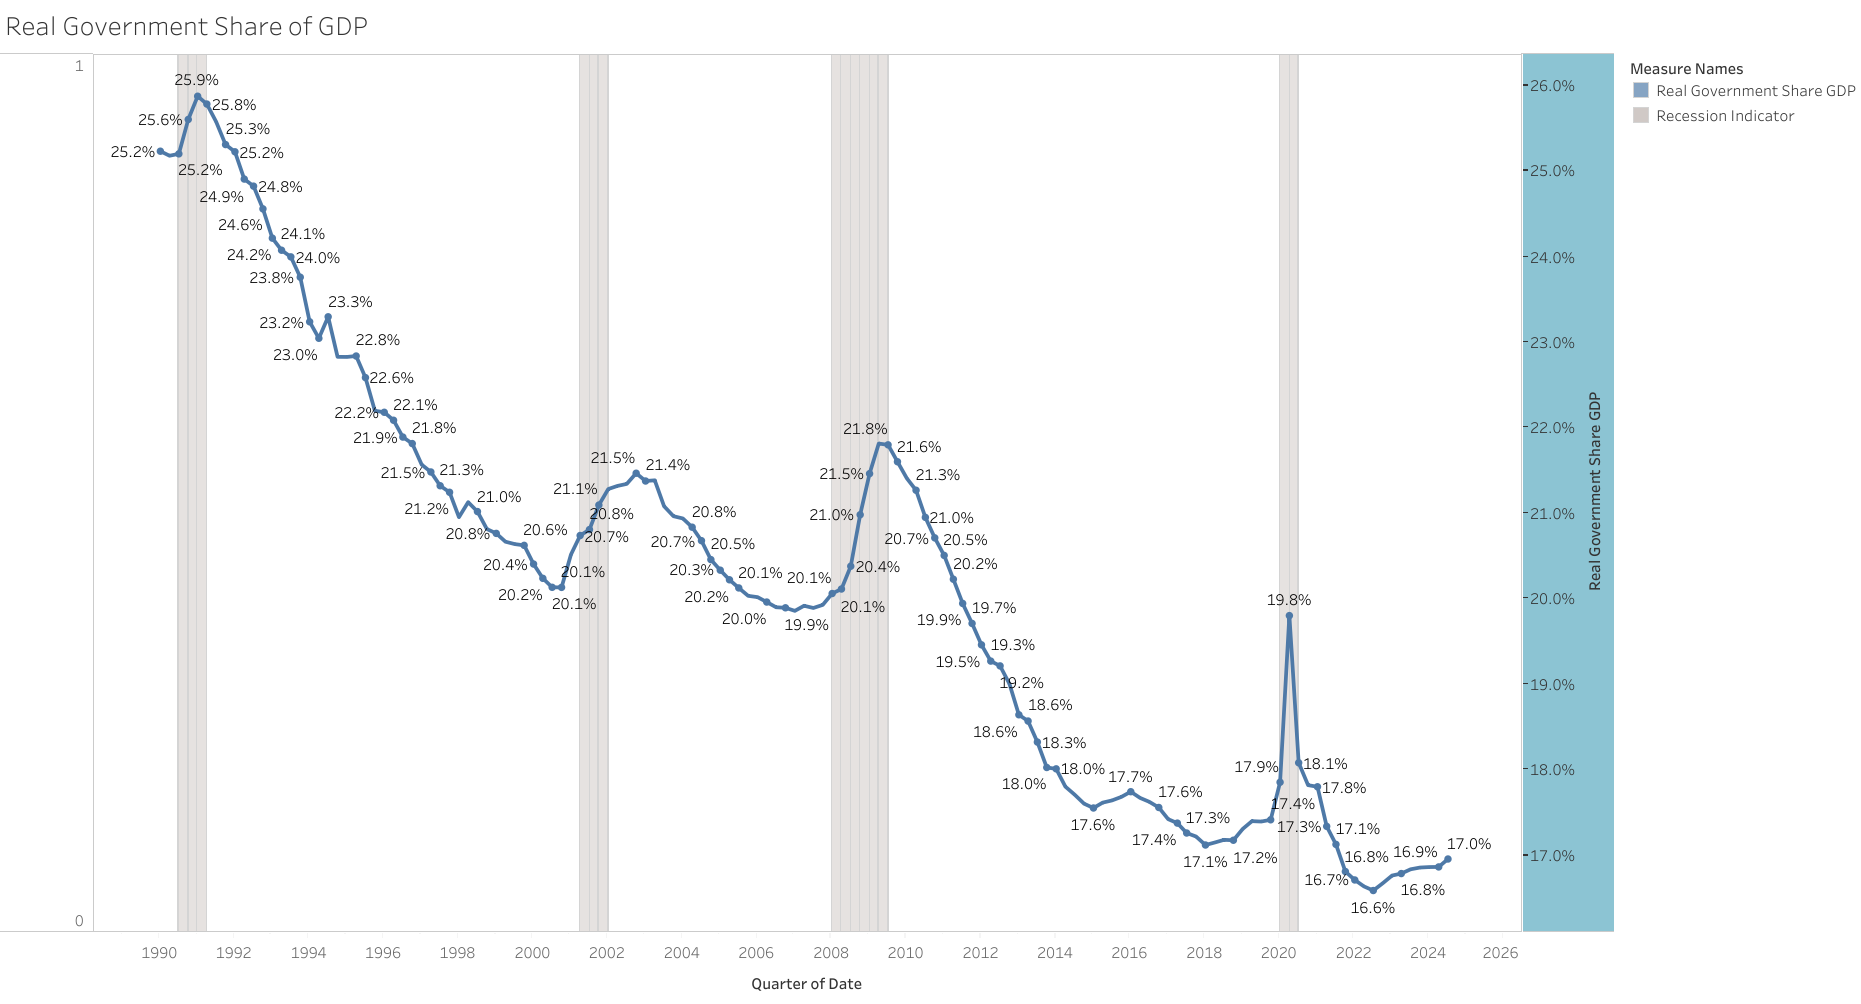
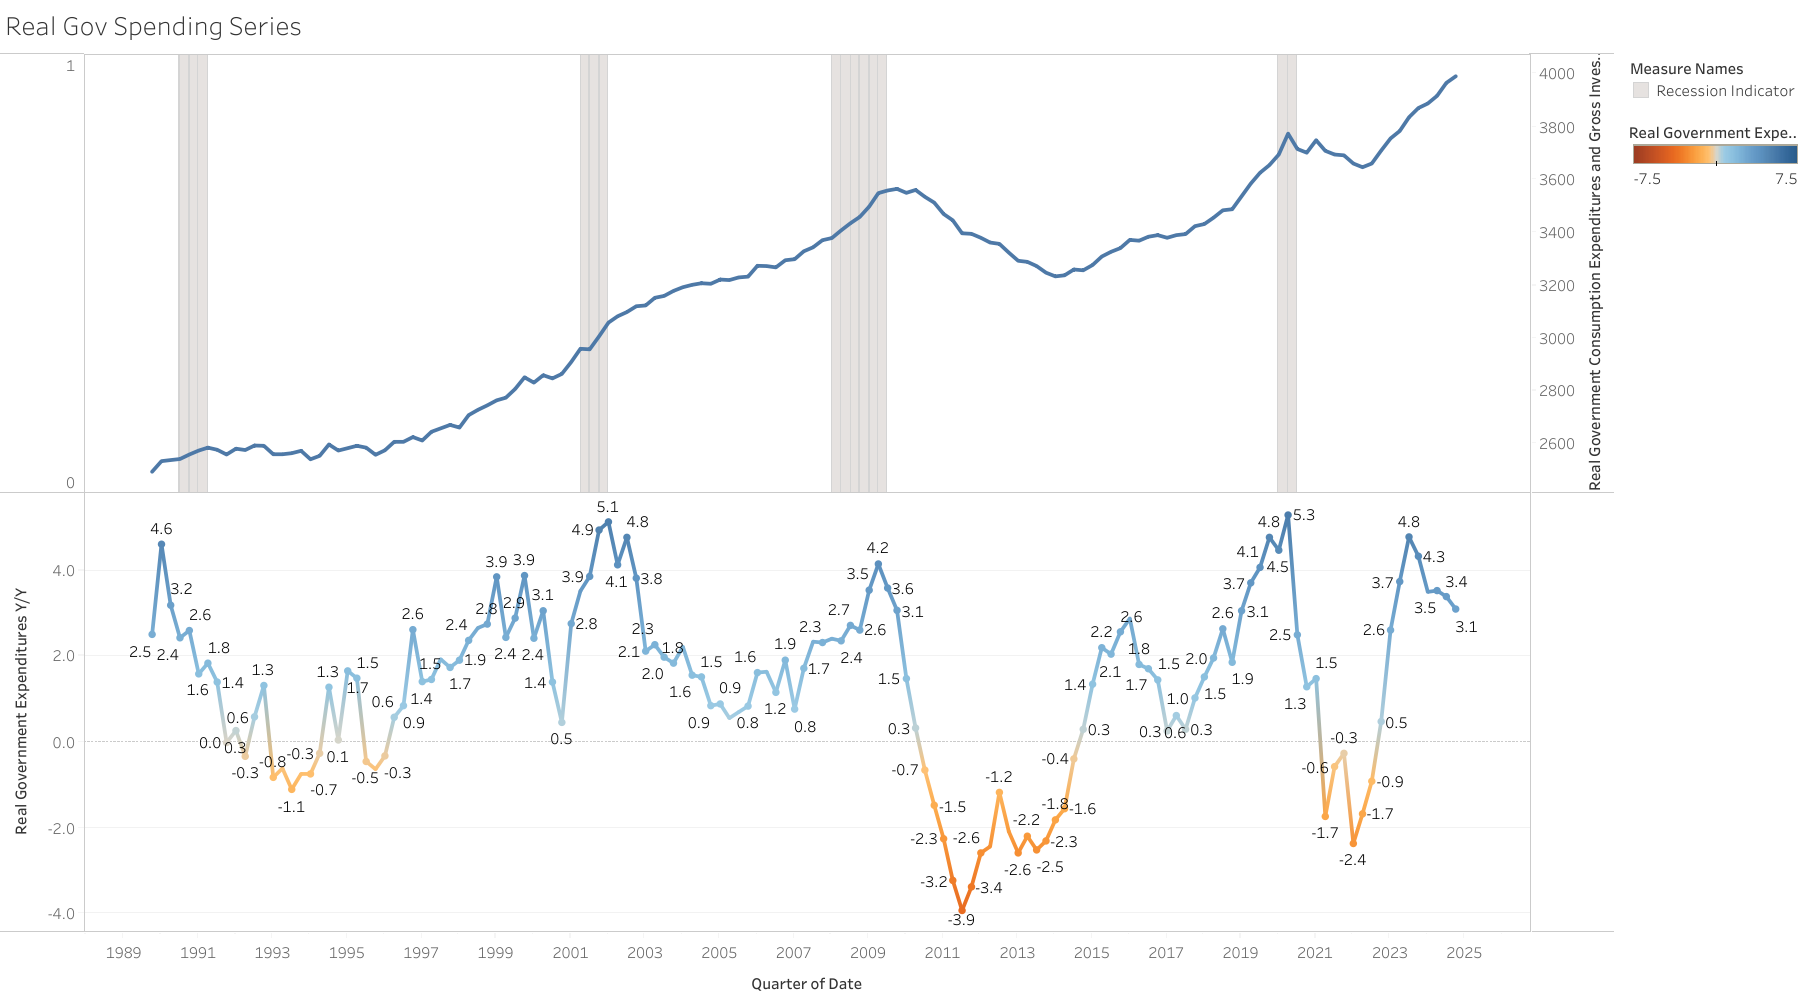
Government Spending: Government expenditures continue to grow faster than GDP
Sectoral Investment: Significant investments in sectors like AI and semiconductors
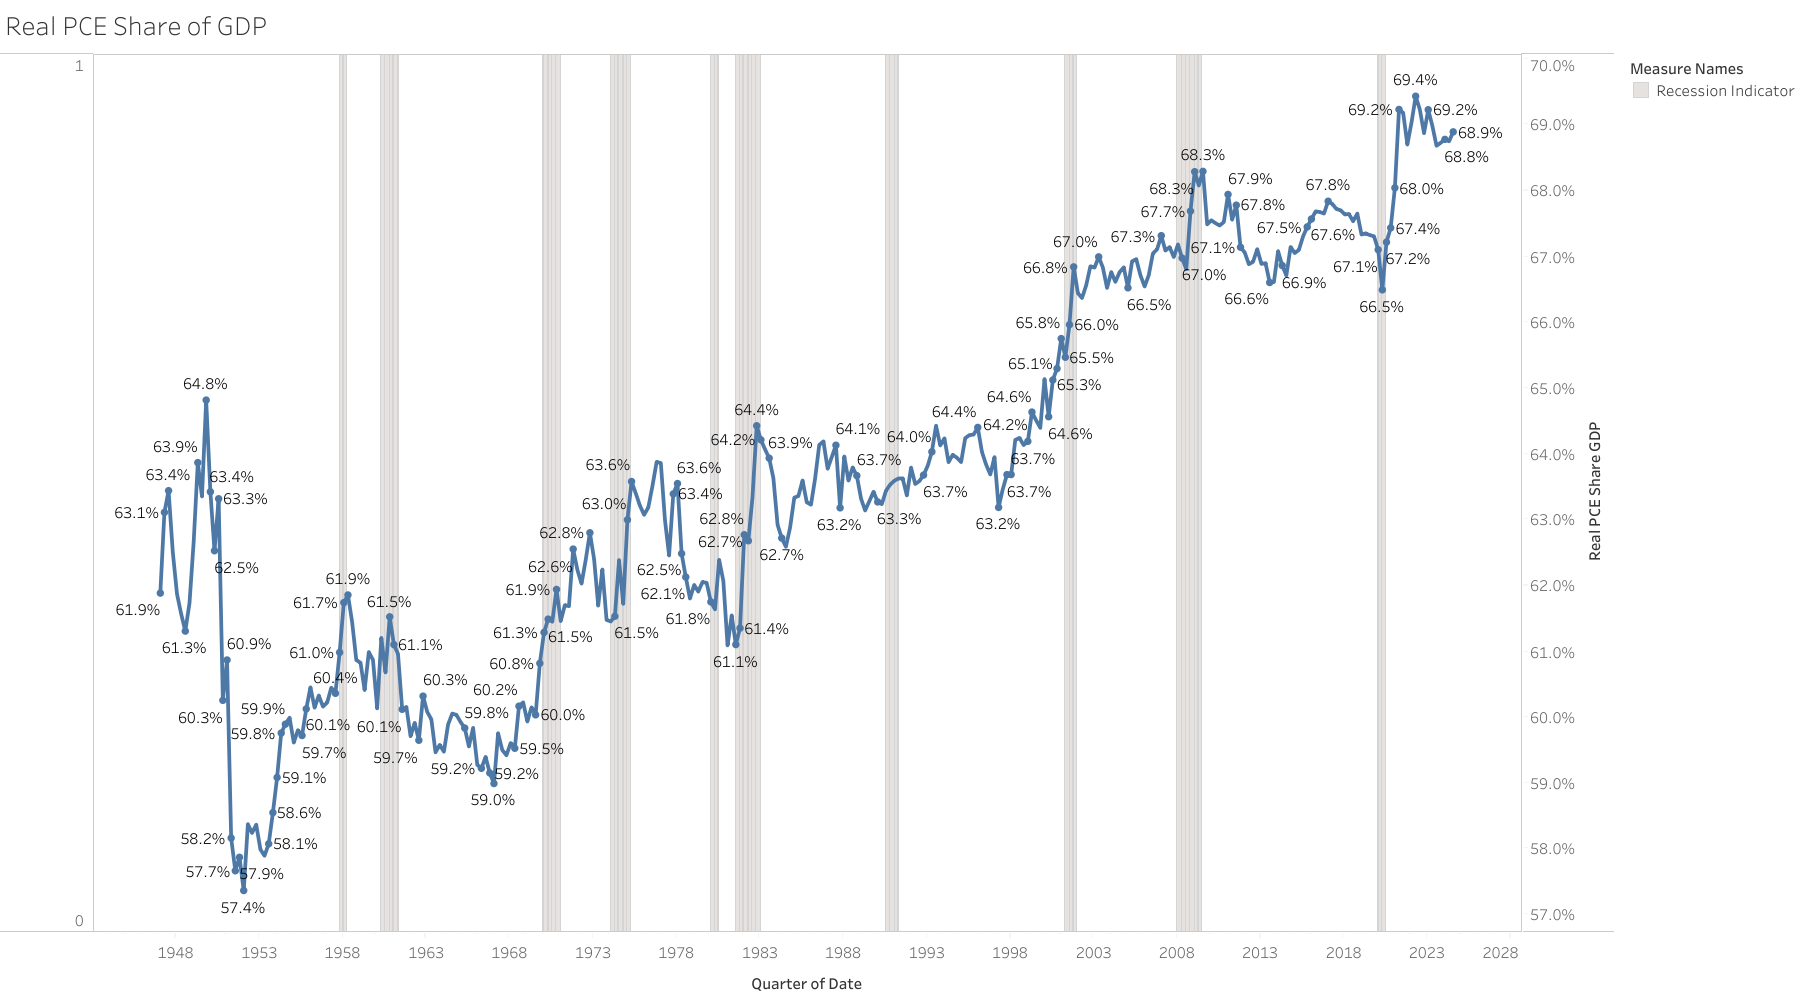
The economy is primarily driven by income growth imo (which has been decelerating), particularly through sustained wage gains, which continue to support spending (spending is almost 70% of GDP). As highlighted in my previous assessment, any significant economic downturn would likely require a more pronounced weakening in the labor market than we’ve seen to date. I expect this gradual softening in labor to continue due to current trends in the data, which underscores the importance of closely monitoring labor market dynamics in the coming months.
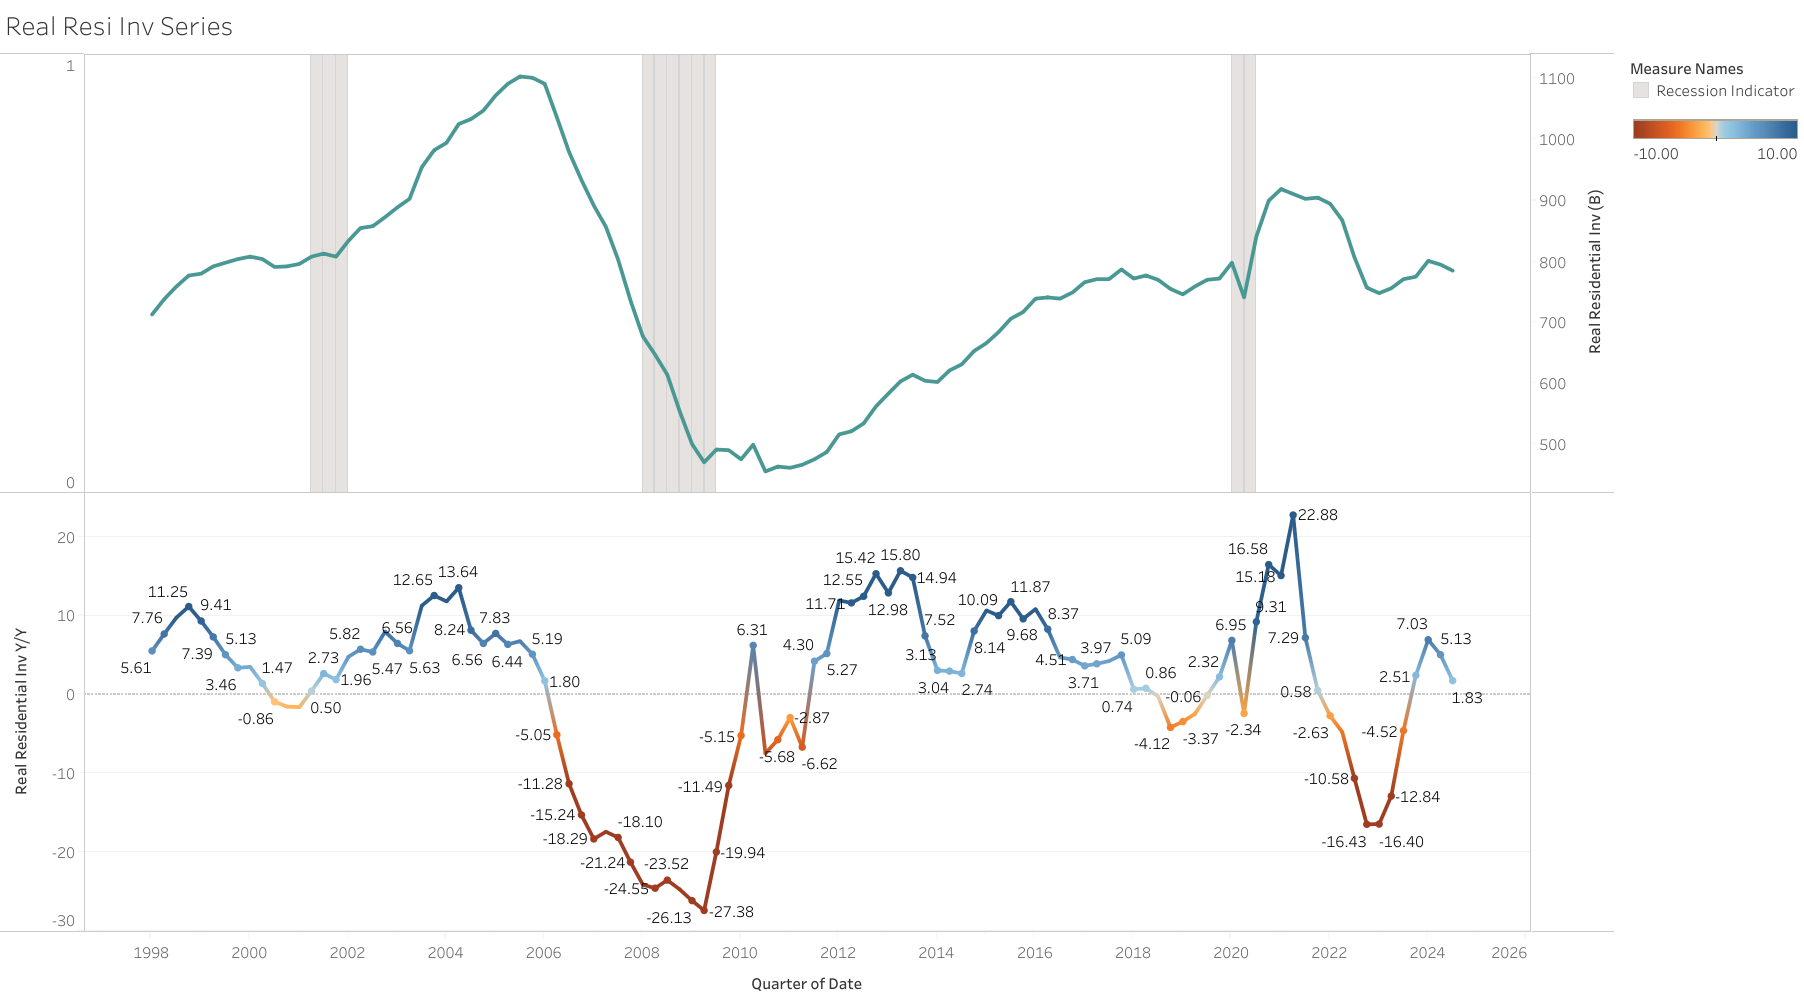
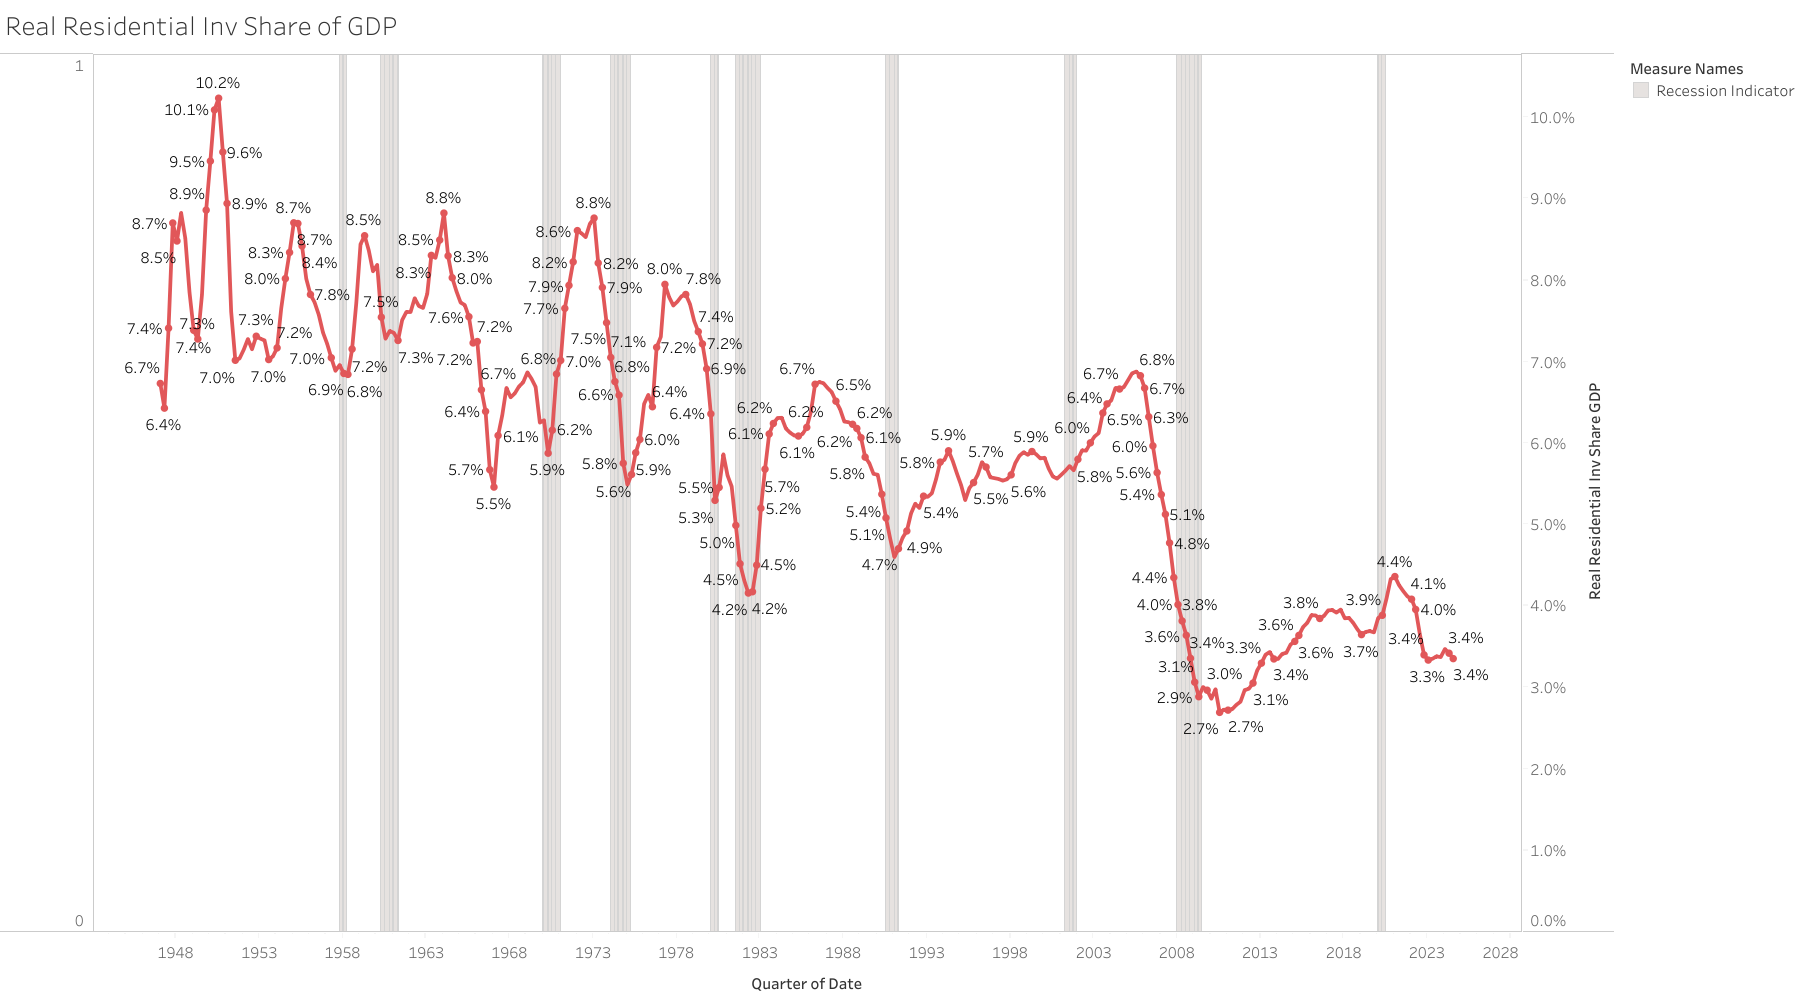
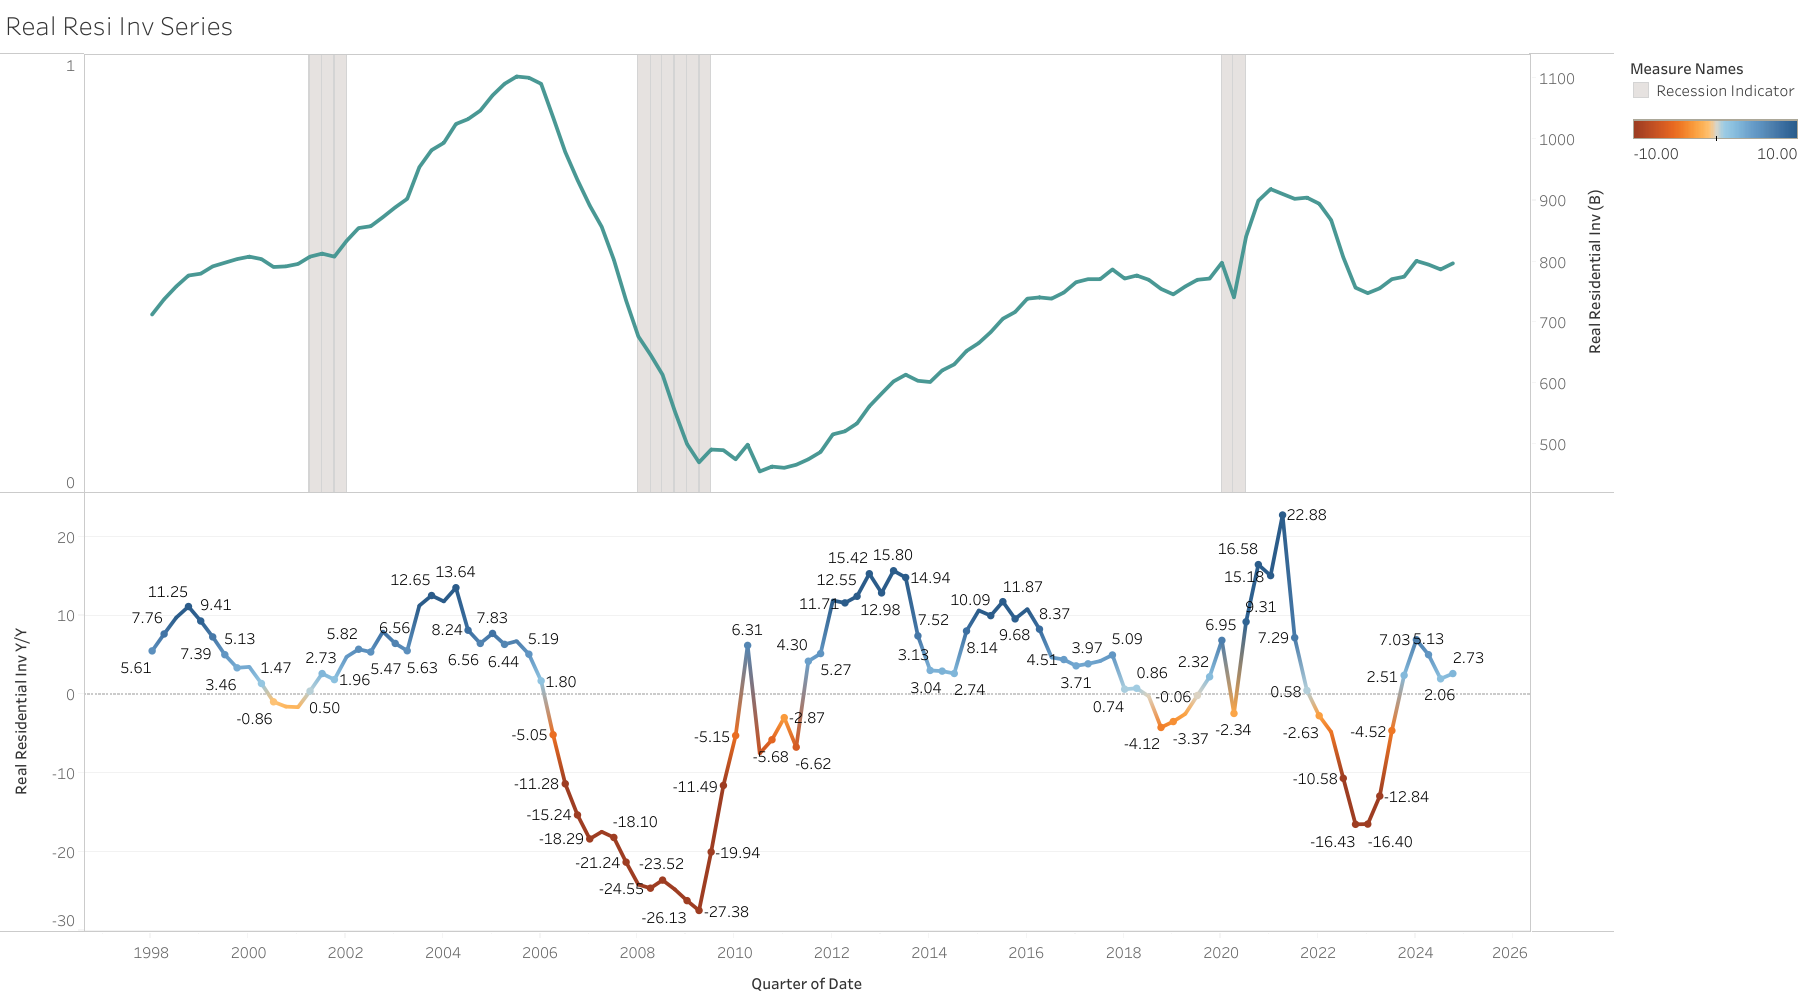
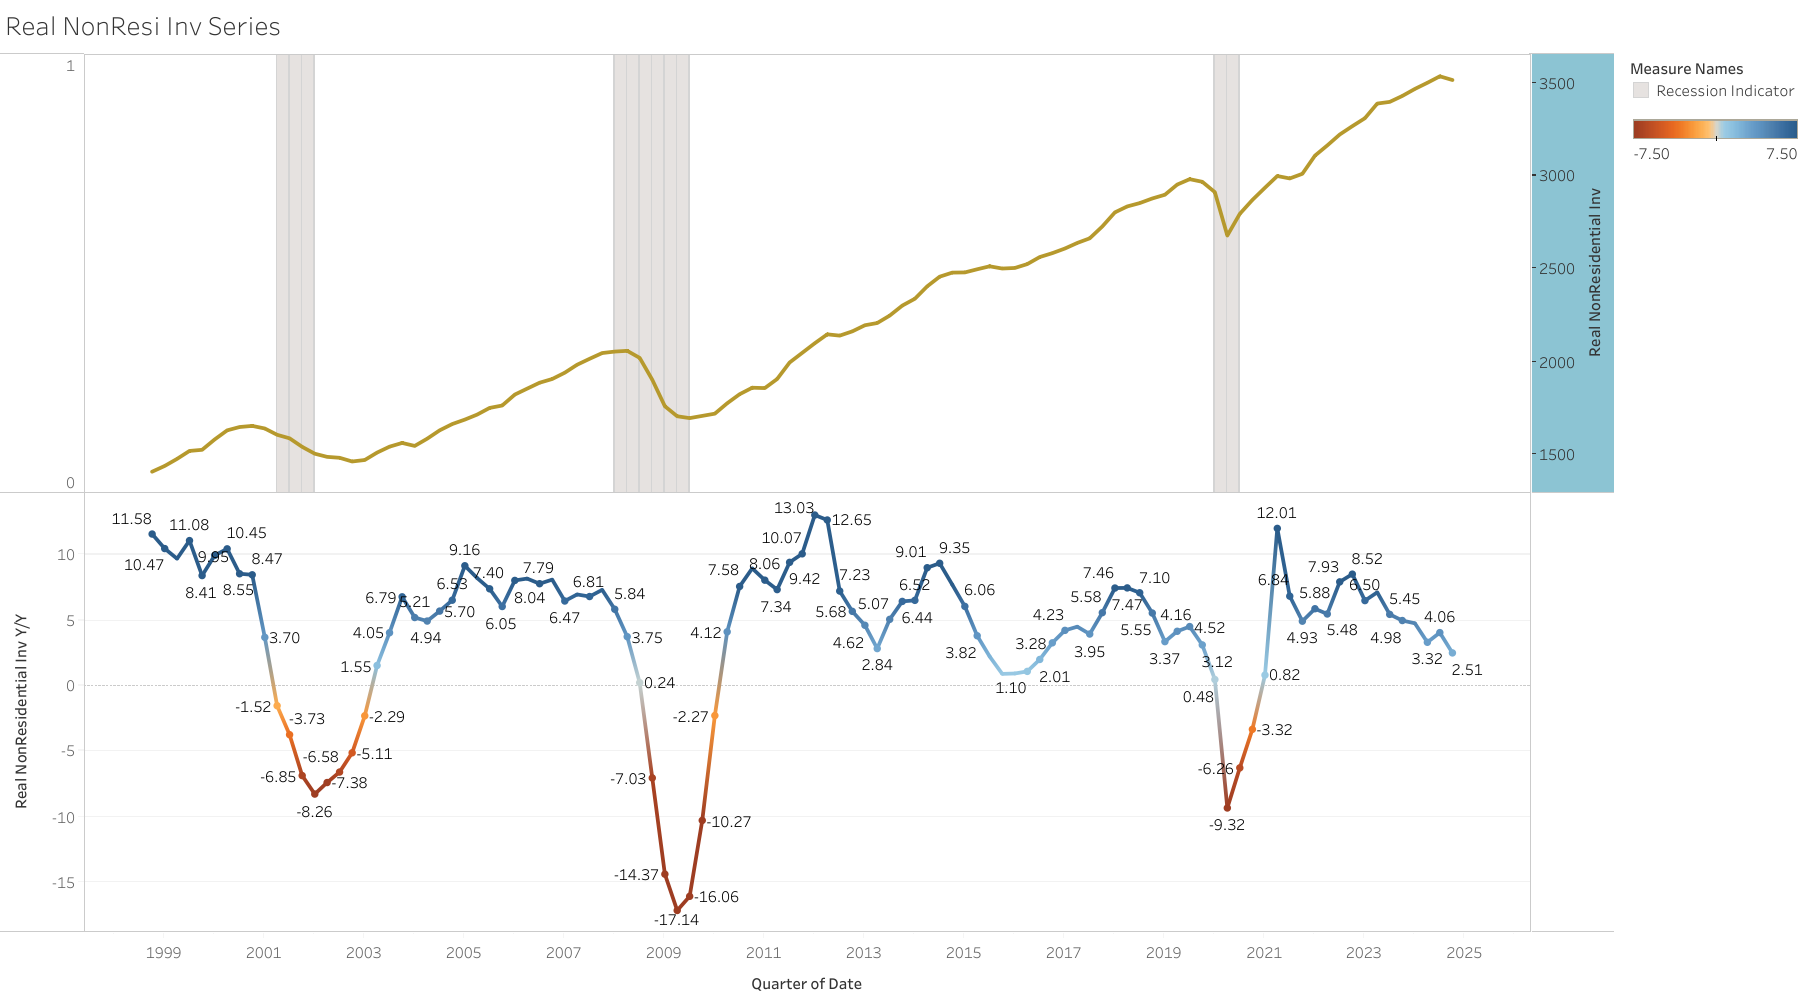
One area of concern already evident currently is the housing market, with residential investment showing signs of weakness. Although housing comprises a smaller share of GDP, it has historically been a leading indicator for economic cycles. Monitoring this sector closely is crucial, as further weakness on this sector could eventually have spillover effects on broader economic activity.
Meanwhile, other cyclical components, such as durable goods and equipment investment, are still performing reasonably well, though their growth rates are slowing and are below averages since 2010. Despite this deceleration, these cyclical segments of the economy are not indicating an imminent contraction.
Notably, aircraft investment has contributed significantly to recent growth in equipment investment, driven by accelerated demand ahead of anticipated strikes on Boeing. This tailwind may dissipate in upcoming quarters, is unlikely to solely drive a downturn in investment, but the growth rate is most likely to decline.
As I always mention GDP is only a coincident indicator, reporting only on what happened in the last quarter, and it does not provide that much signal for the future economy.
I am also very skeptical lately of making definite assessments based on these first initial government data releases, so we have to keep an open mind always that the economy could be performing much better or worse than initial numbers indicate.
The y/y growth rate of GDP continues to decelerate but at a very slow pace, still in line with the average growth experienced before the pandemic.
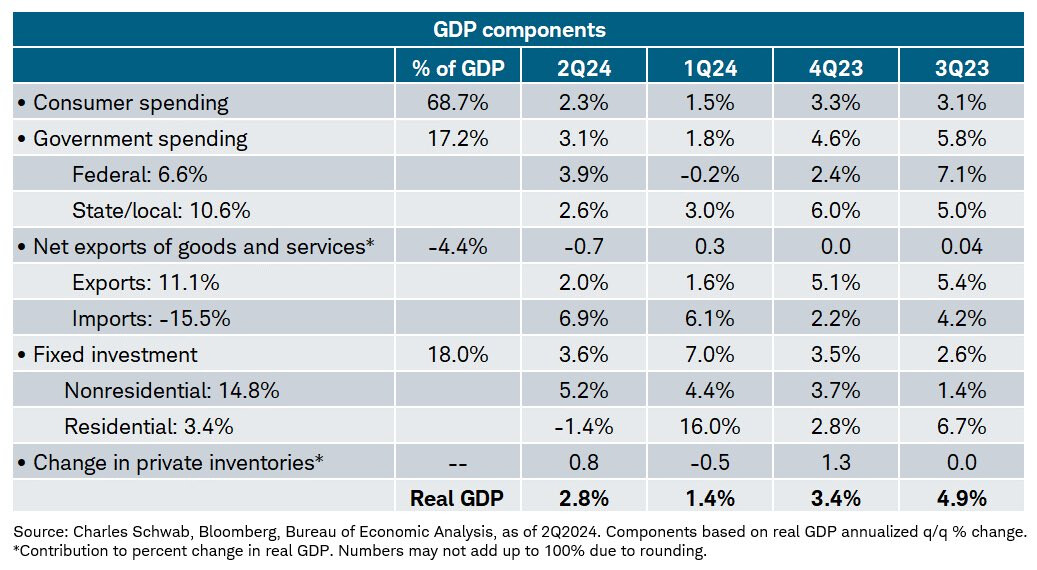
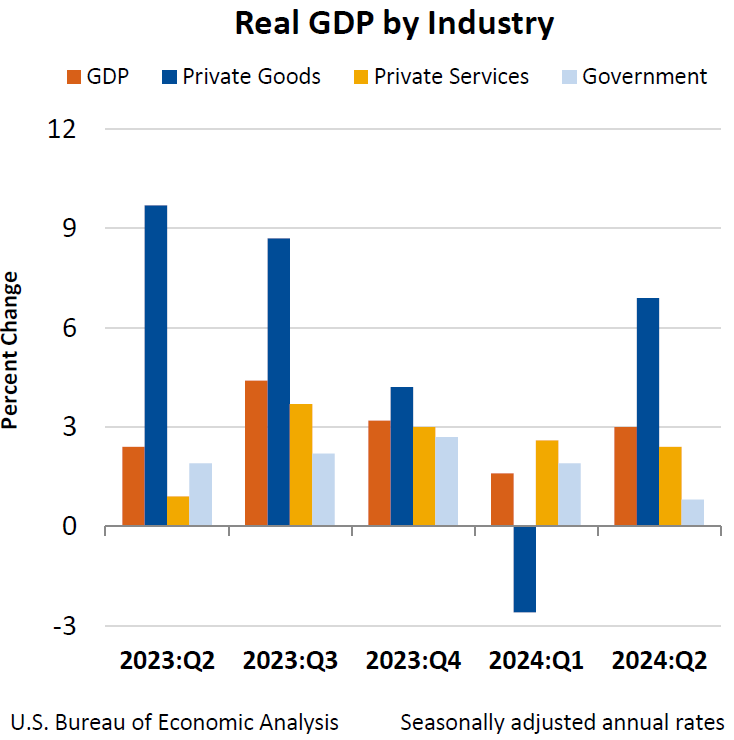
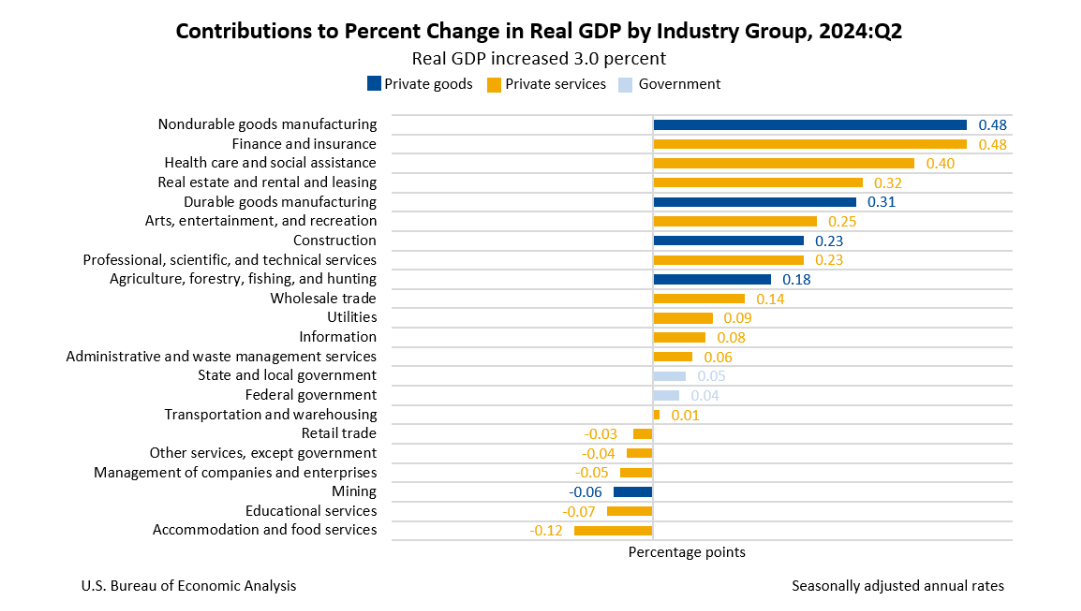
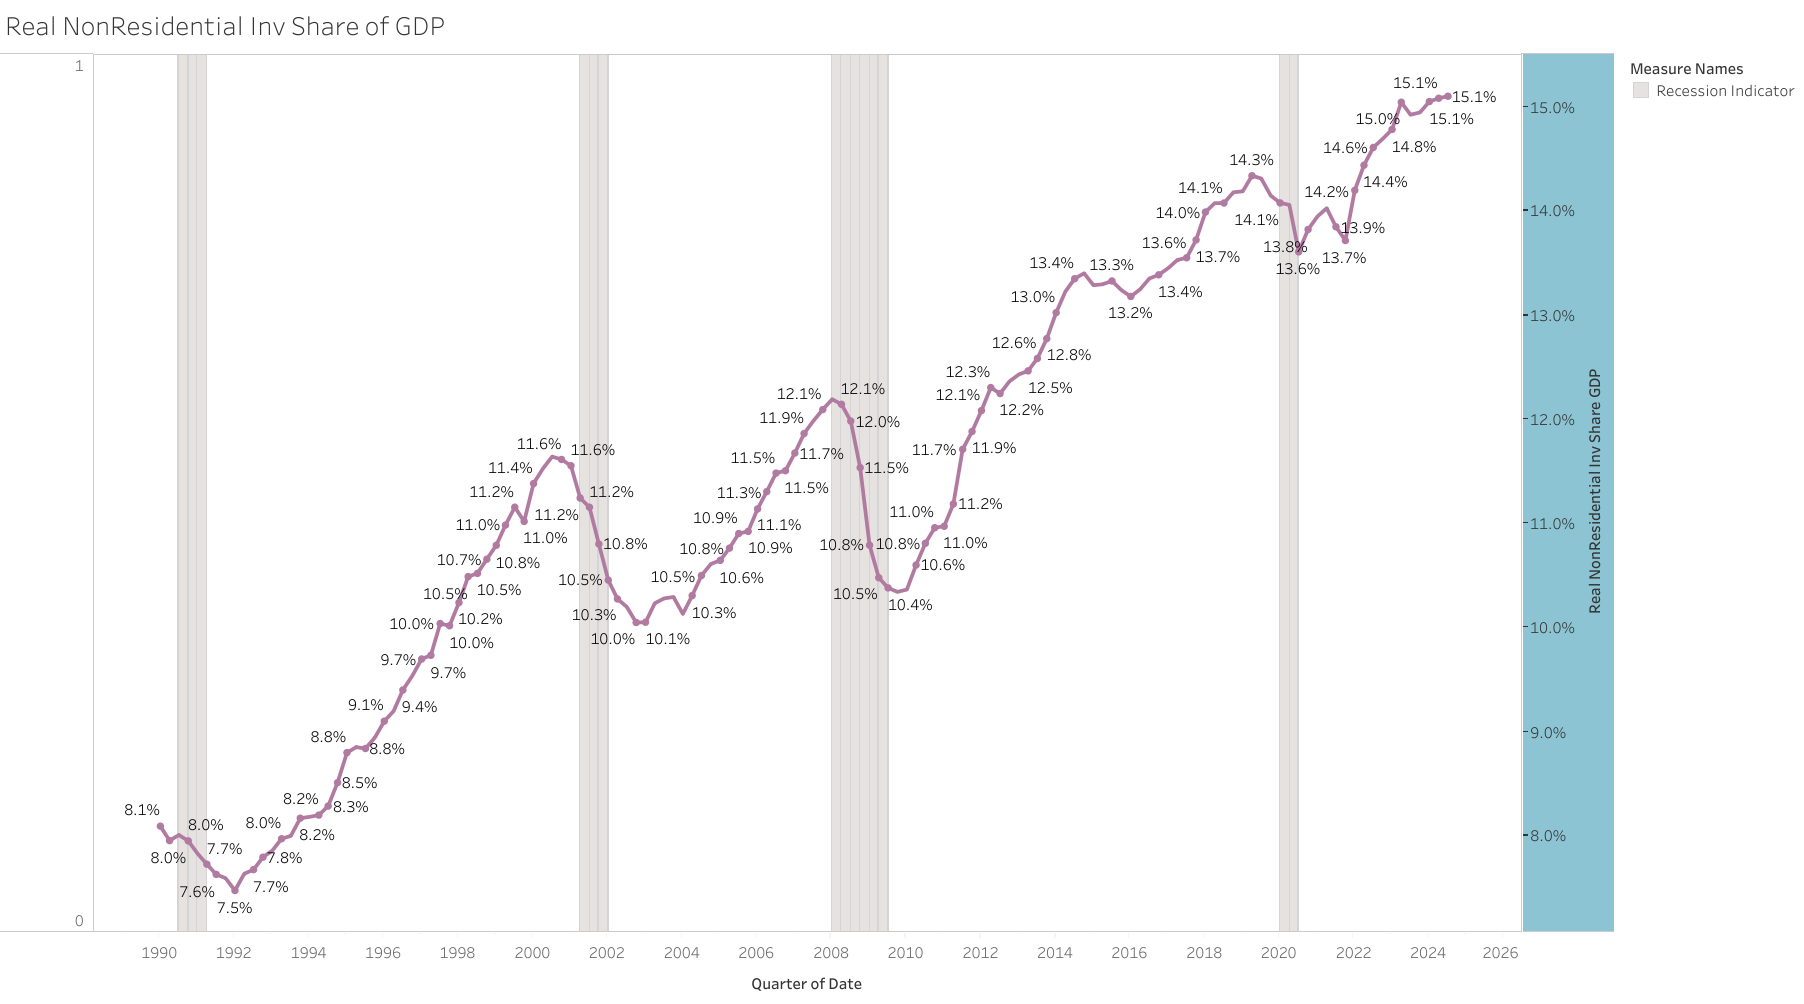
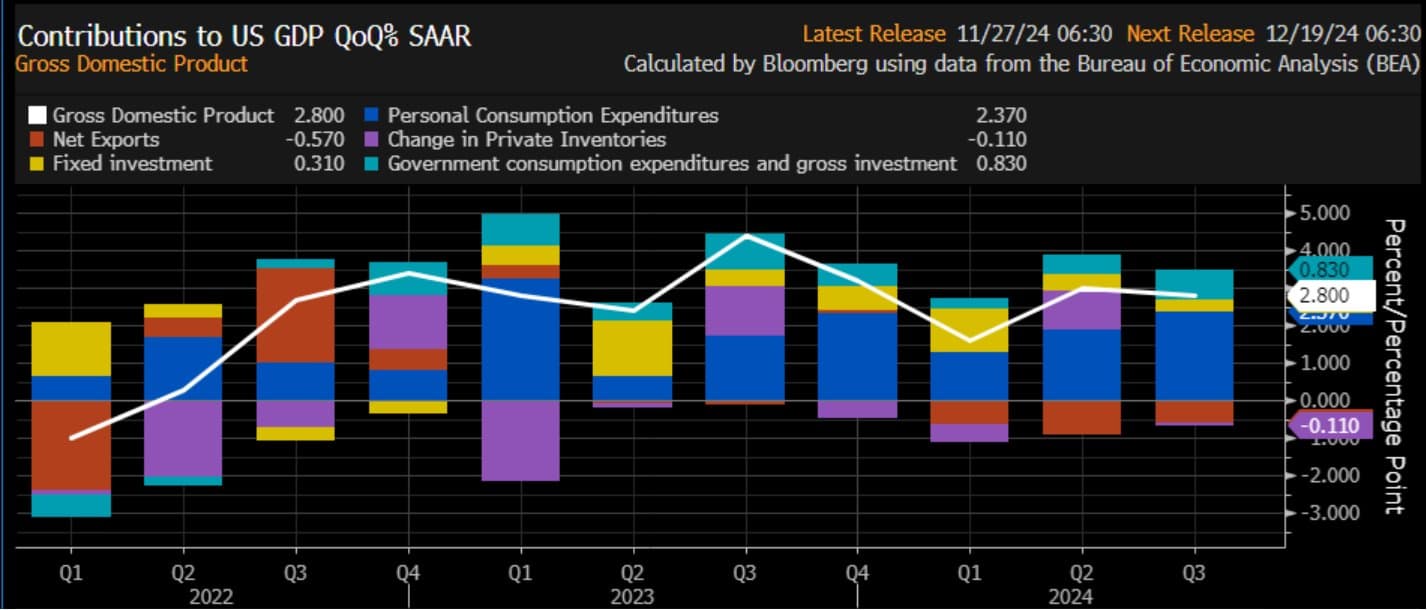
All GDP components continued to perform relatively strongly and healthy in Q3 2024, with the exception of residential investment
Investment experienced a softer quarter, primarily driven by ongoing weakness in the residential sector, which continues to weigh on the overall performance
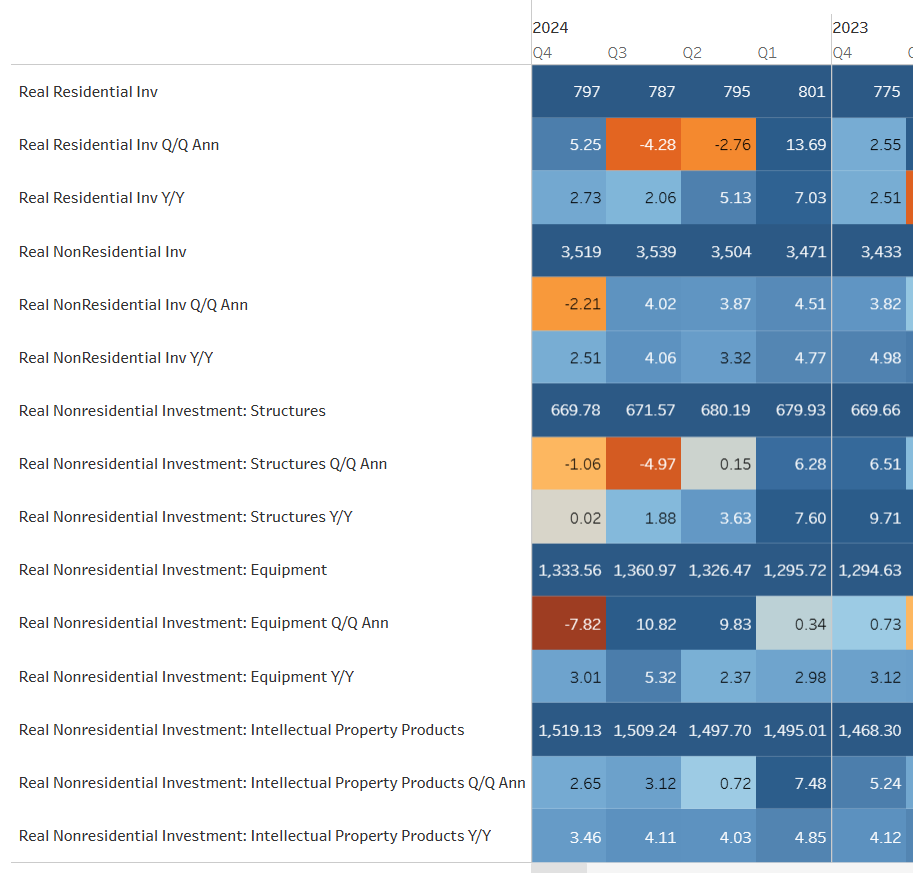
Overall real fixed investment grew 1.3% q/q ann, 3.42% y/y.
Real Residential investment declined -5.15% q/q ann, 1.8%% y/y
Real Non-Residential Investment grew 3.32% q/q ann, 3.88% y/y
Within non-residential investment, equipment investment was the primary growth driver in Q3 2024, posting an annualized quarterly growth rate of 11.12%, the other two components were relatively weak.
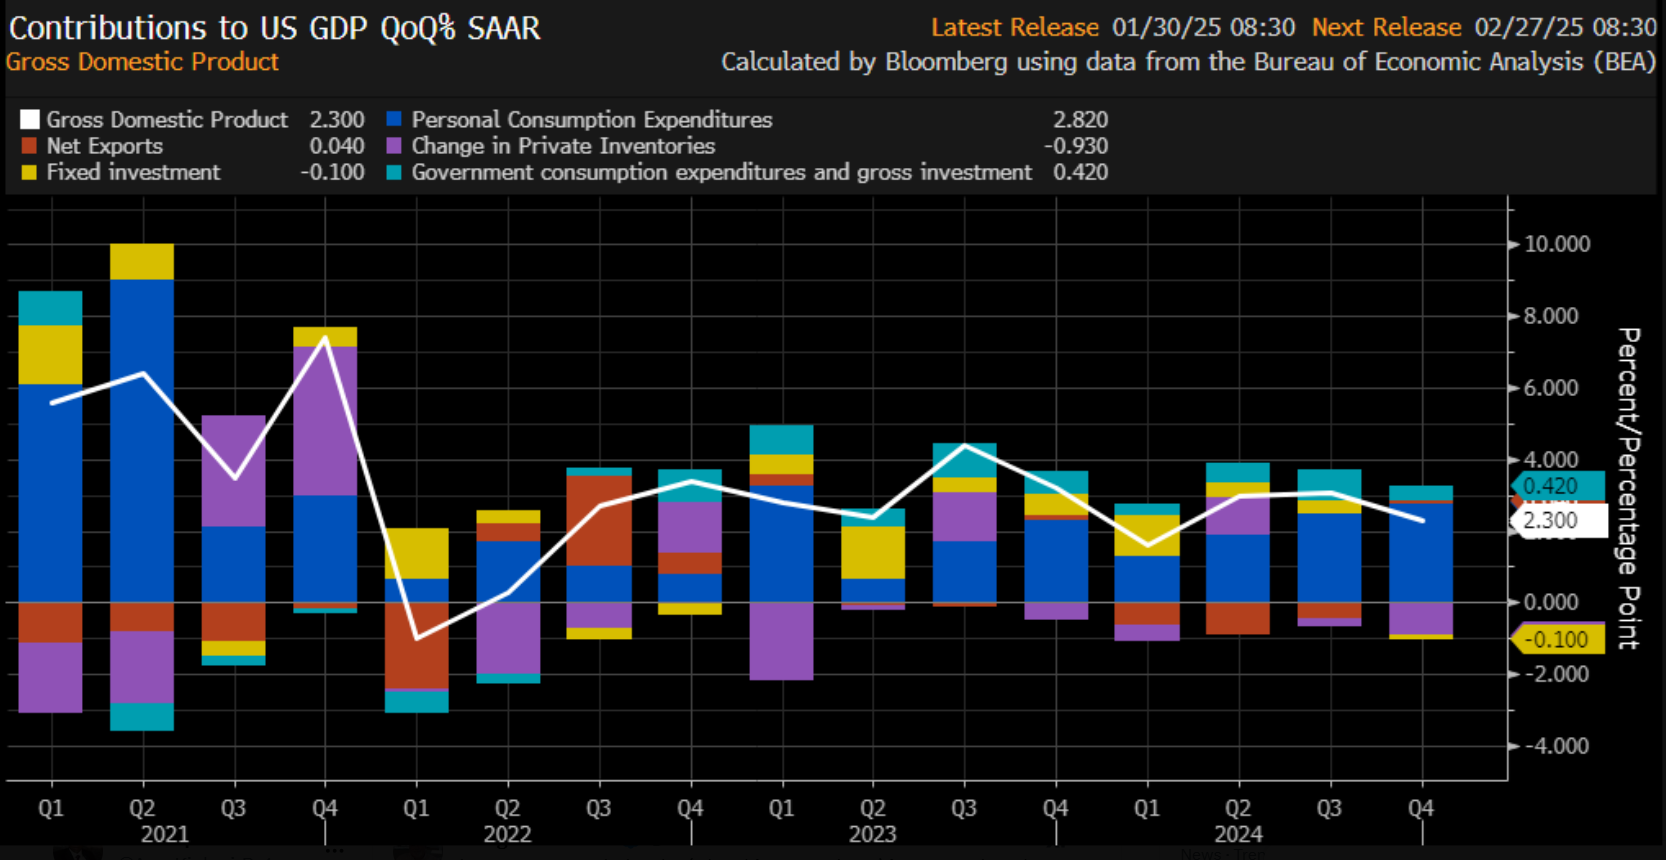
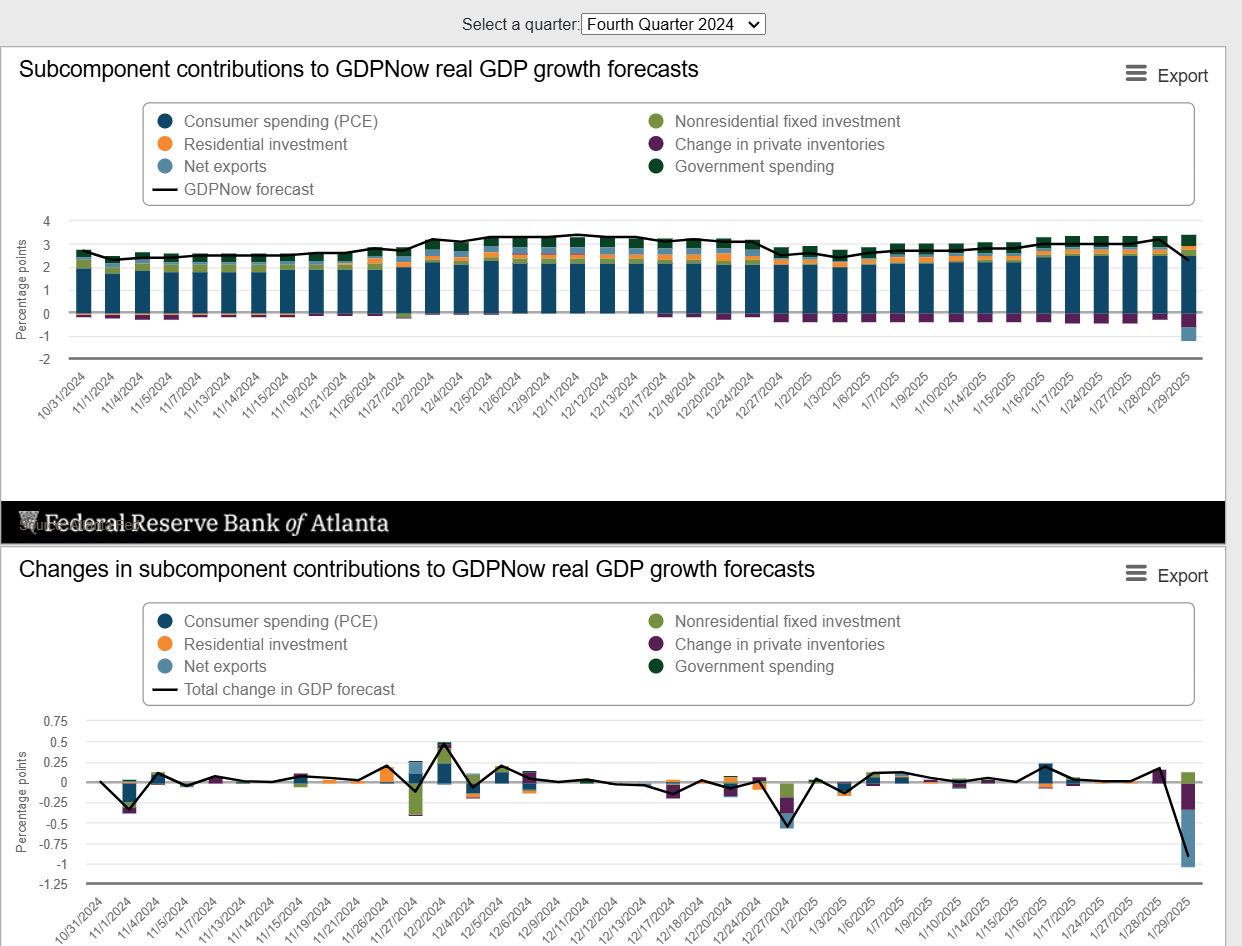
Q4 2024 and 2024 GDP Assessment: the economy grew 2.8% in 2024 vs 2.9% in 2023
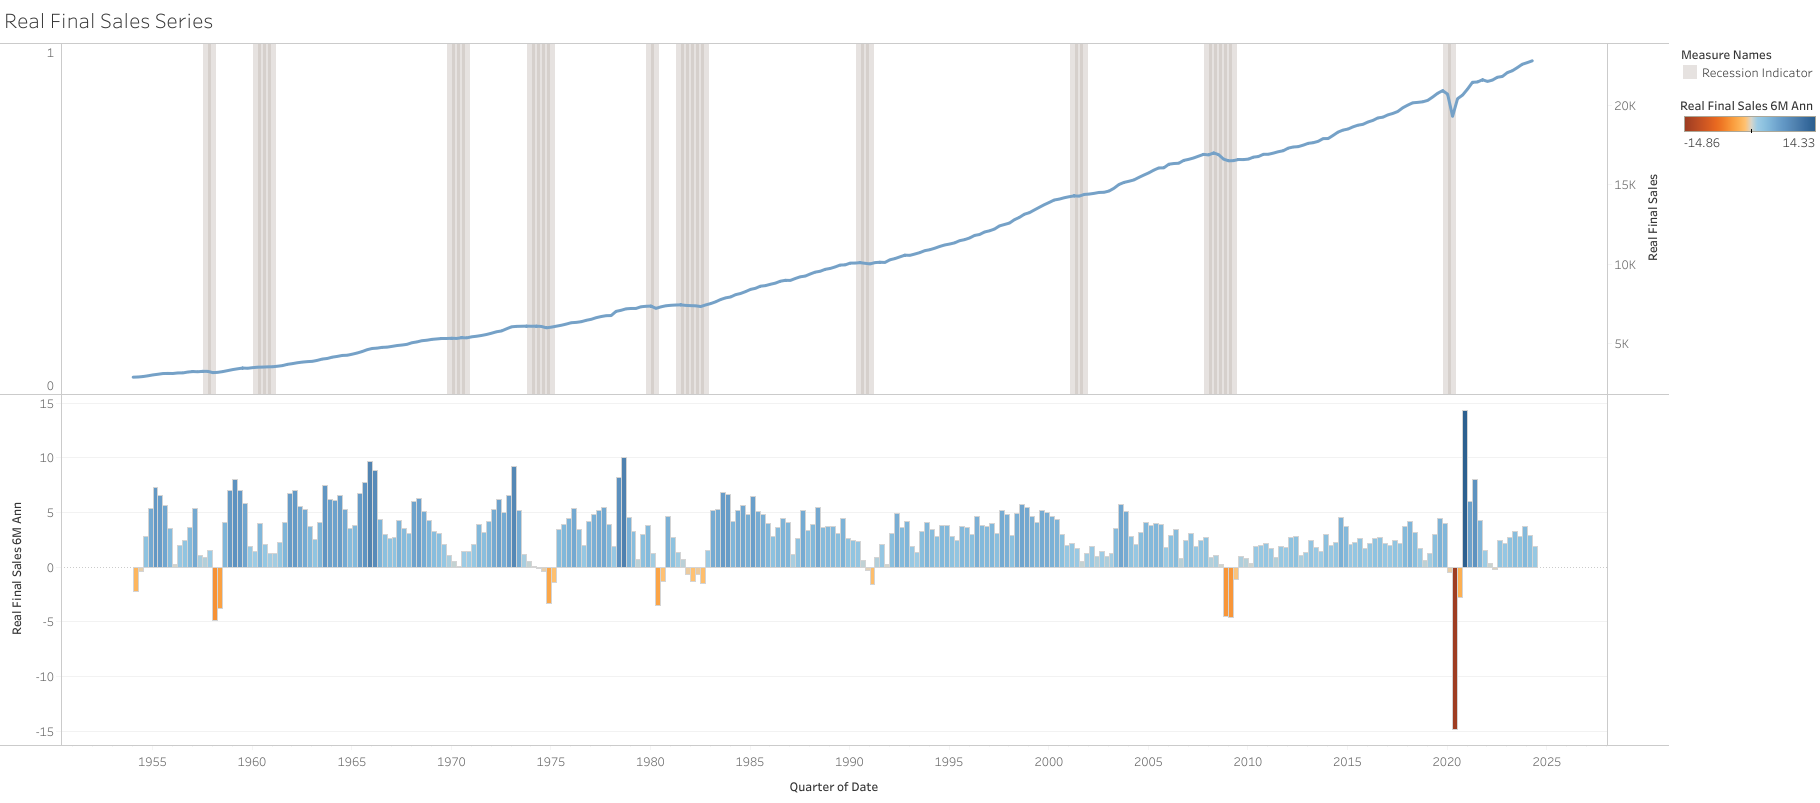
Despite a slowdown in growth this quarter, the data still points to a solid economic expansion. The primary drag came from inventories, which tend to be highly volatile, while real final sales (excluding inventories) grew at a robust 3.21% quarter-over-quarter annualized rate.
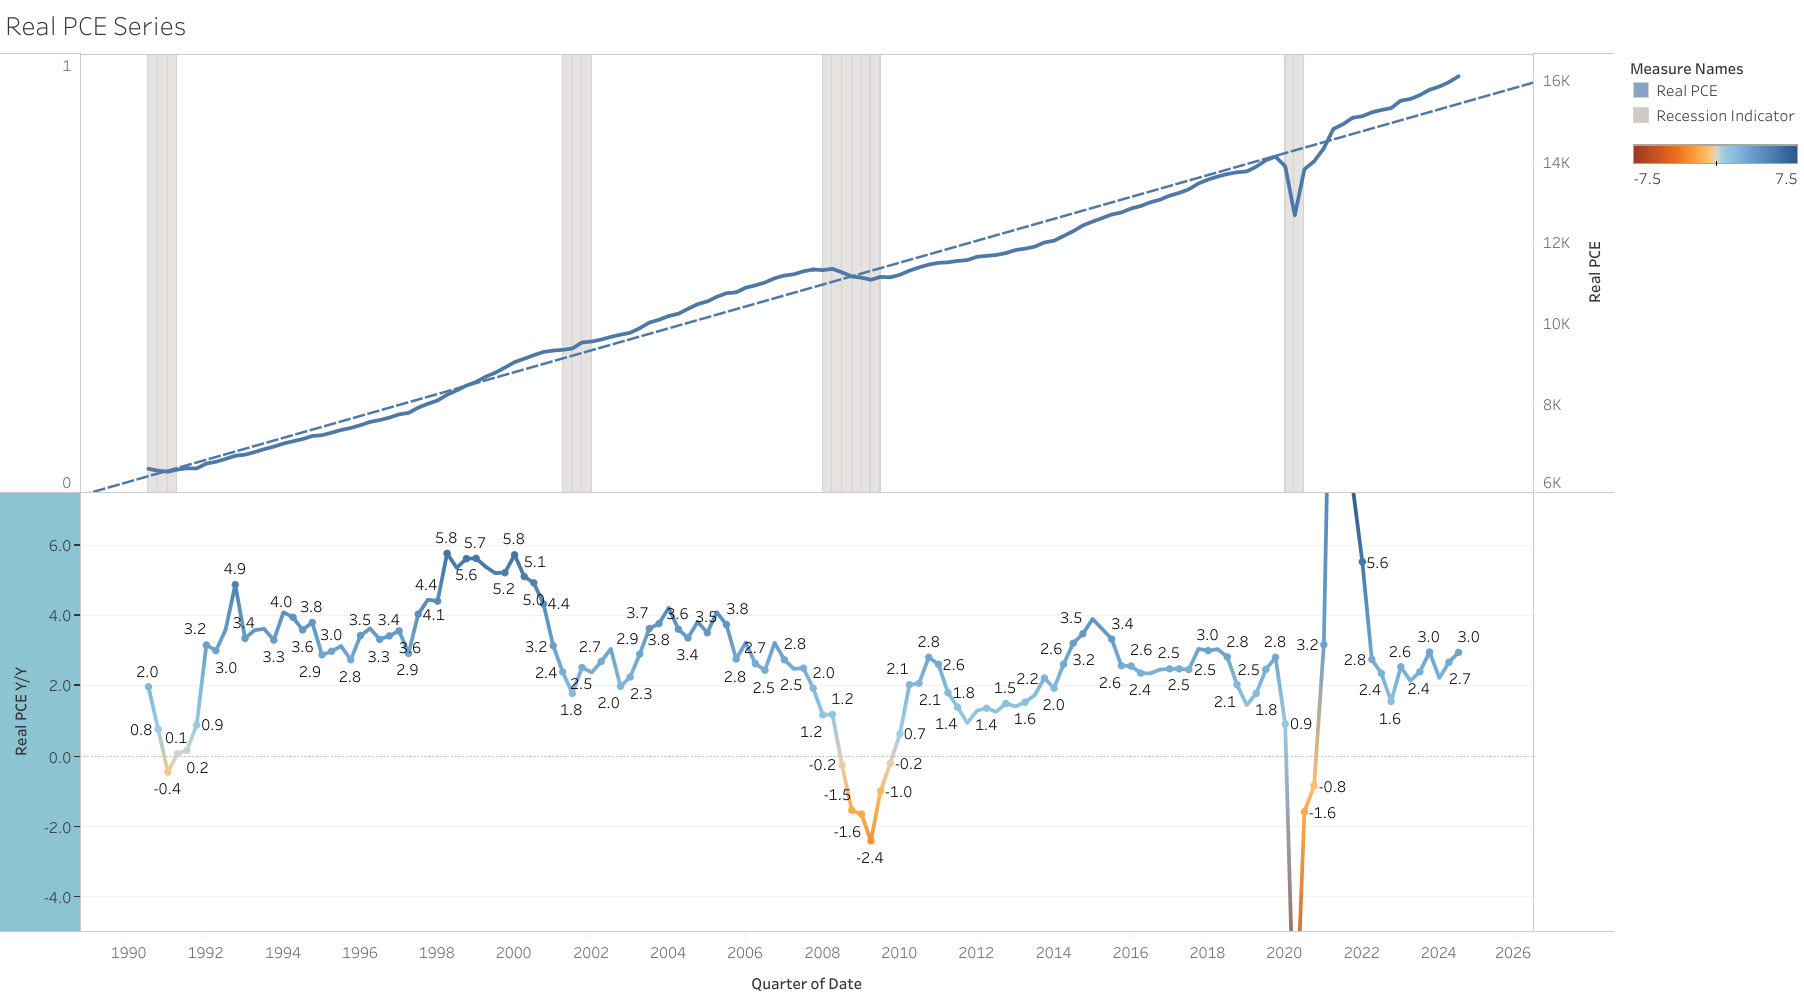
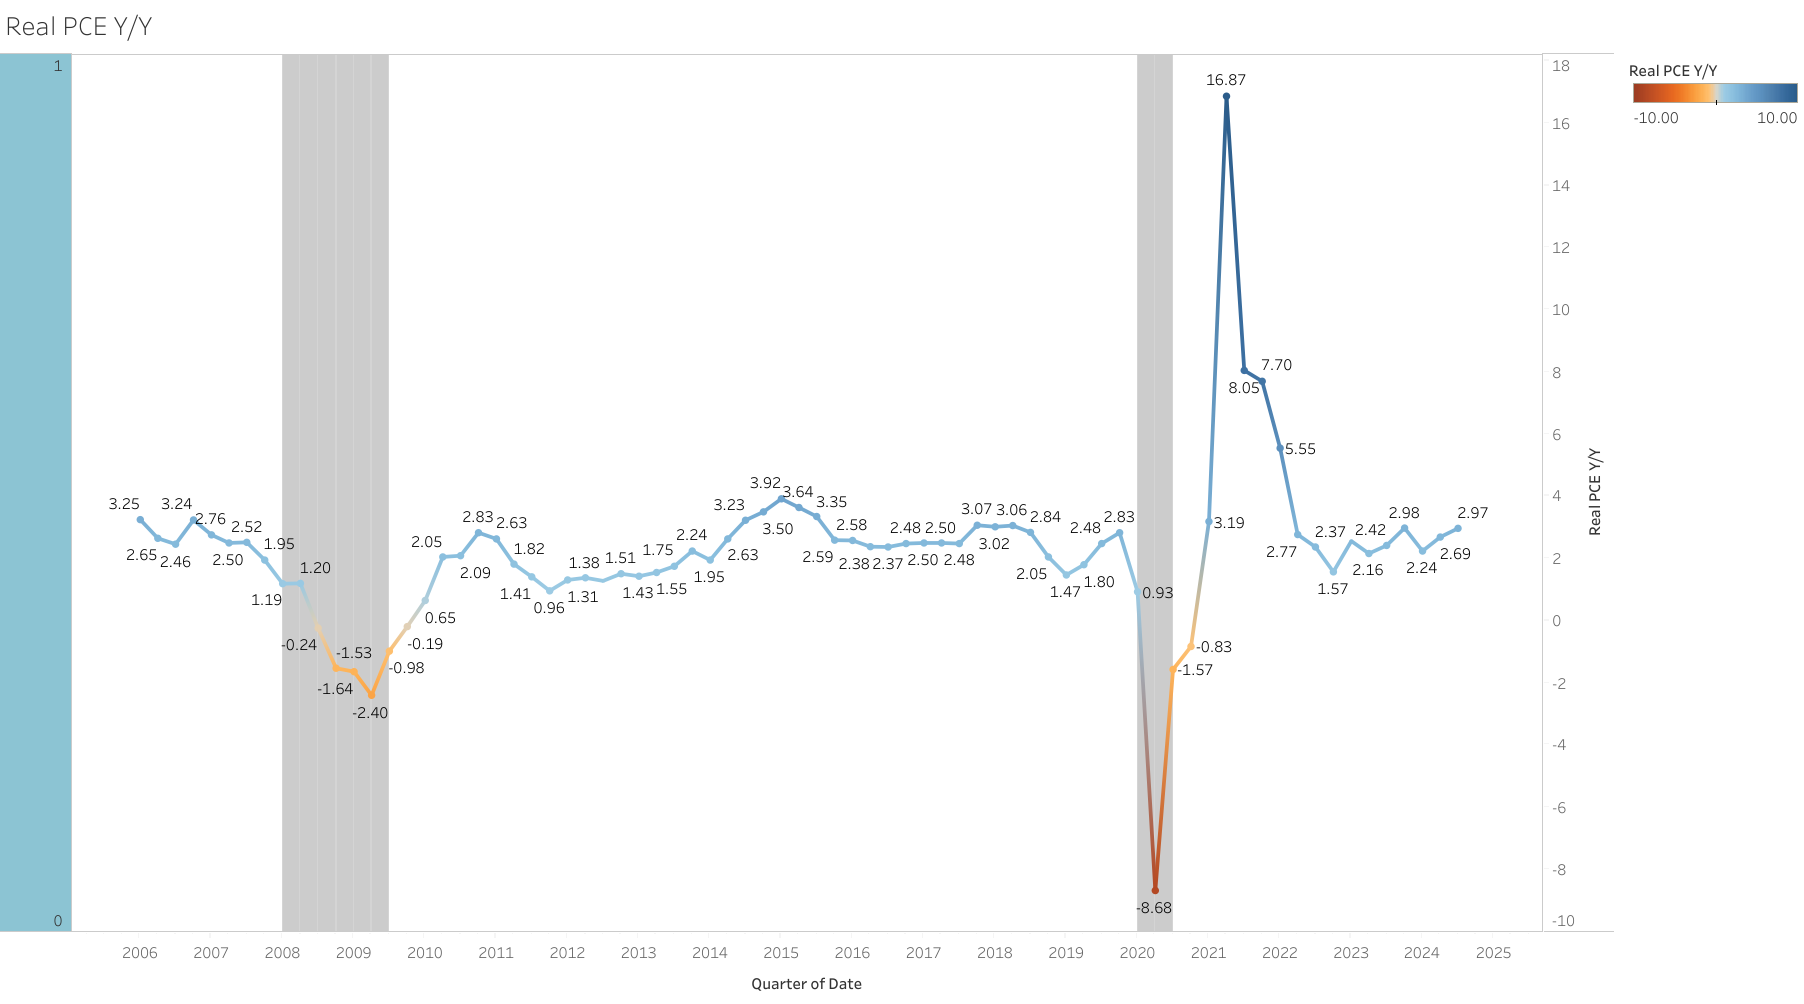
Consumer spending, which accounts for the majority of GDP, remains notably resilient, marking its strongest performance since Q1 2023. This strength is supported by a solid labor market, steady wage growth, and a significant appreciation in asset values.
An area of concern this quarter is the decline in business investment (the largest drop since the pandemic) particularly in equipment. In my previous assessment, I highlighted that aircraft investment could weigh on future growth due to demand being pulled forward, which is what we saw in q4 2024. However, the weakness in investment this quarter was broad-based, extending beyond the transportation sector.
Investments in AI, infraestructure, and government spending have contributed to growth. If these areas begin to slow, they could pose a headwind for the economy, though it’s still too early to make a definitive call, especially given potential policy shifts under a Trump administration.
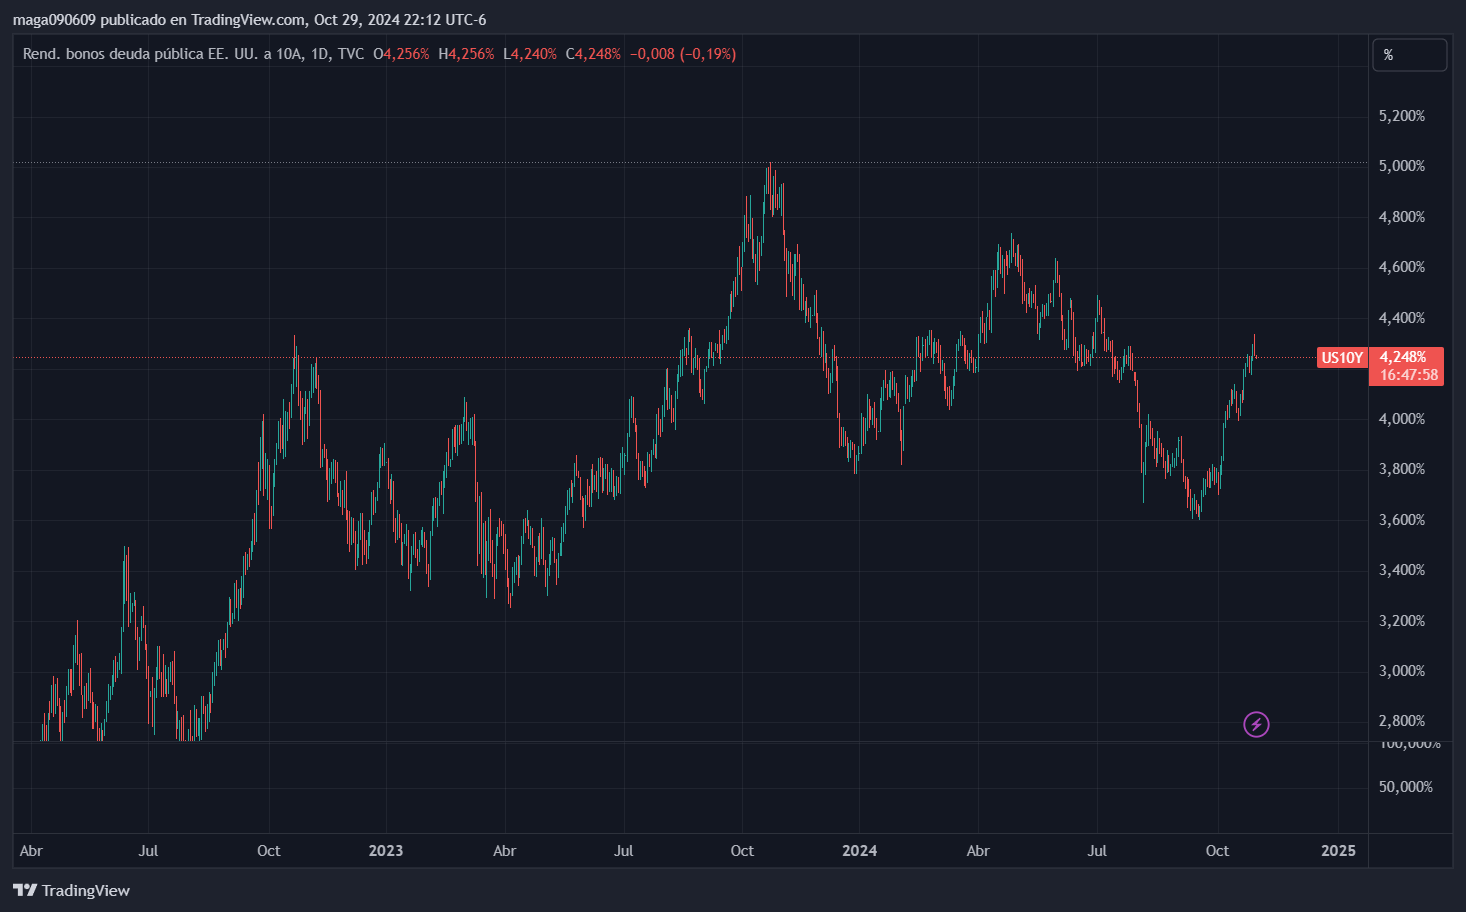
Meanwhile, residential investment saw a rebound in Q4 2024, but I remain cautious about calling this a turning point, especially as the long end of the yield curve has been rising again in recent months.
The y/y growth rate of GDP continues to decelerate 2.48% y/y in Q4 vs 2.72% in Q3, however still solid growth.
Consumer spending the main driver of growth, strong at 3.16% y/y in Q4 2024 (highest since q1 2022) vs 2.98% in Q3. Especially notable is the rebound in goods spending this year.
Business investment experienced a weak quarter, the highest decline since the pandemic. Primary driven by investments in equipment
Overall real fixed investment grew -0.4% q/q ann, 2.6% y/y.
Real Residential investment grew 5.25% q/q ann, 2.73%% y/y
Real Non-Residential Investment declined -2.21% q/q ann, 2.51% y/y
Within non-residential investment, equipment investment was the primary growth headwind in Q4 2024, posting an annualized quarterly growth rate of -7.82%, structures -1.1% and intellectual property +2.6%.
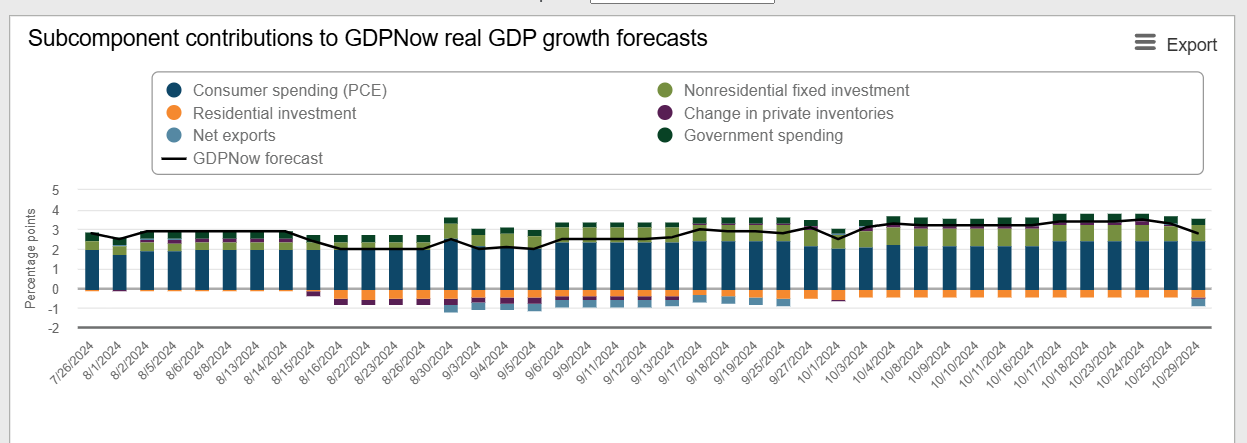
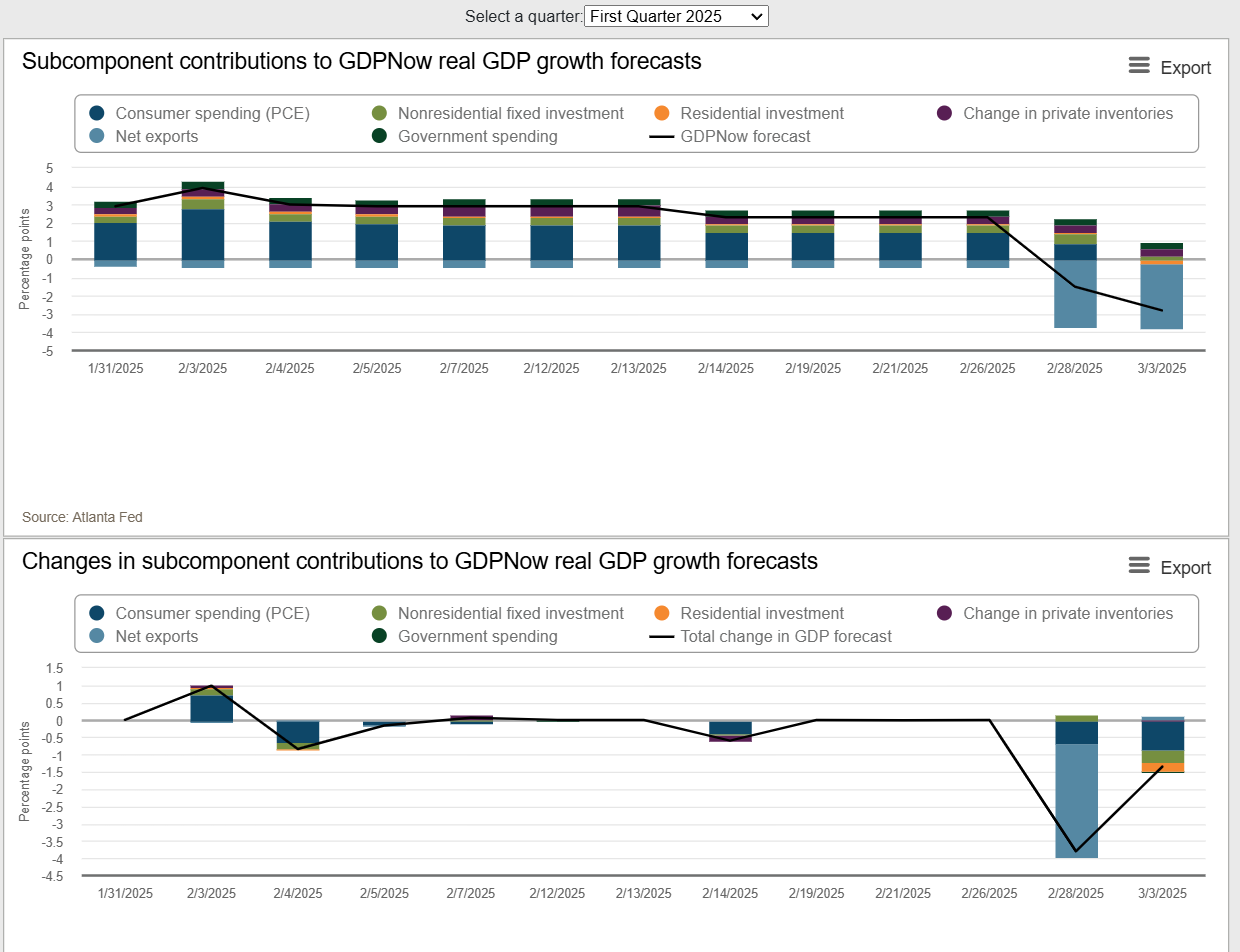
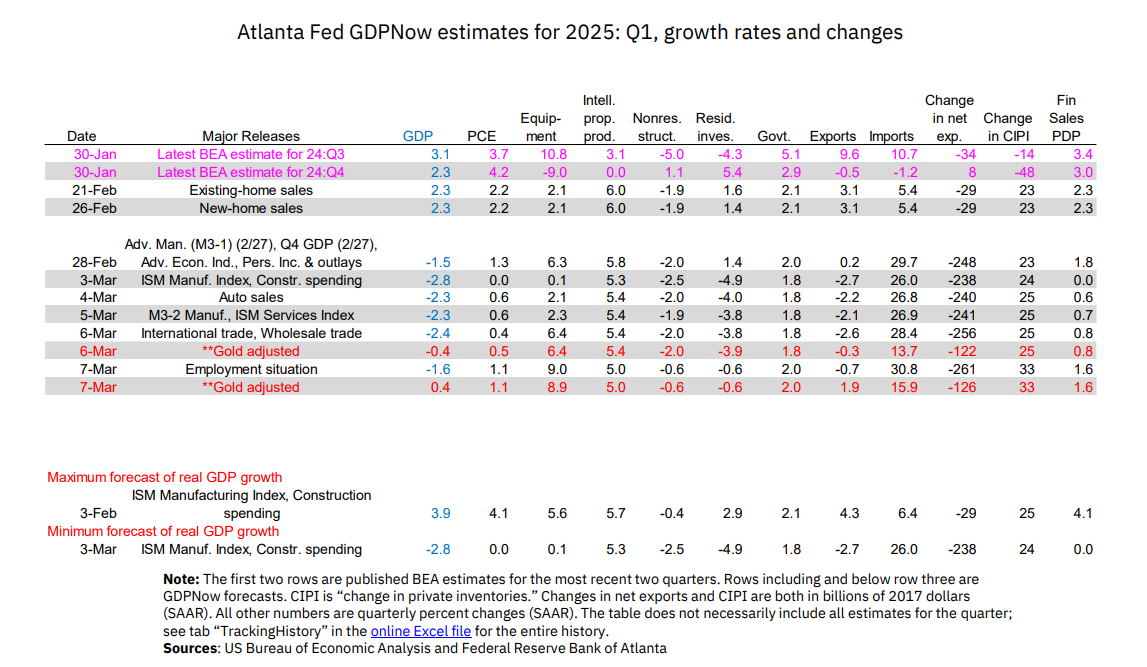
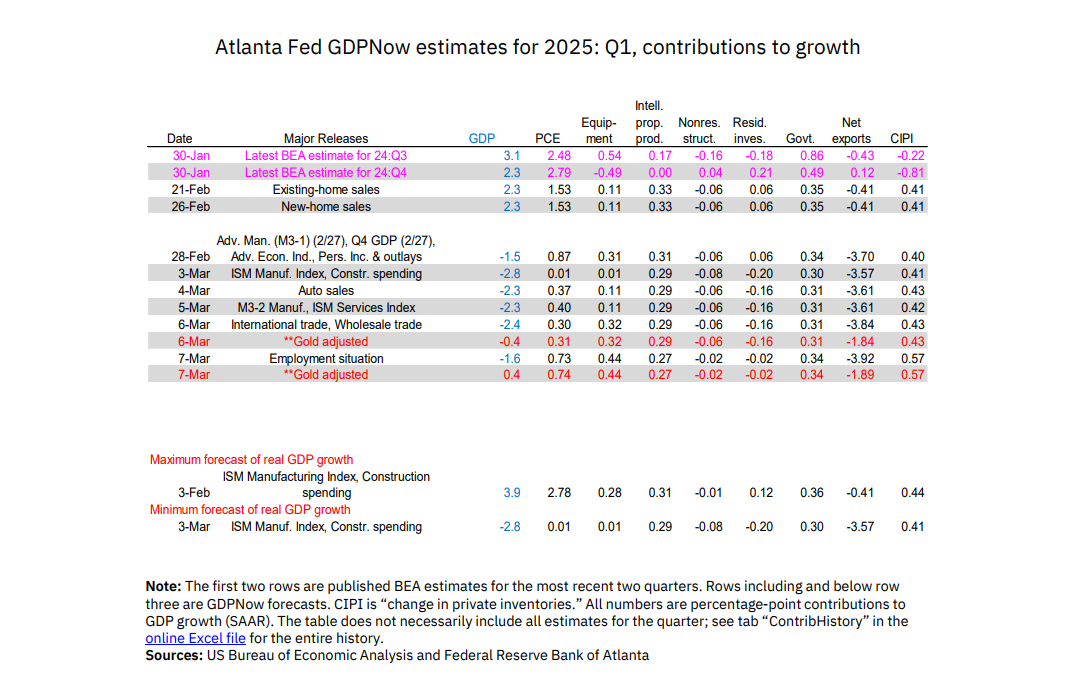
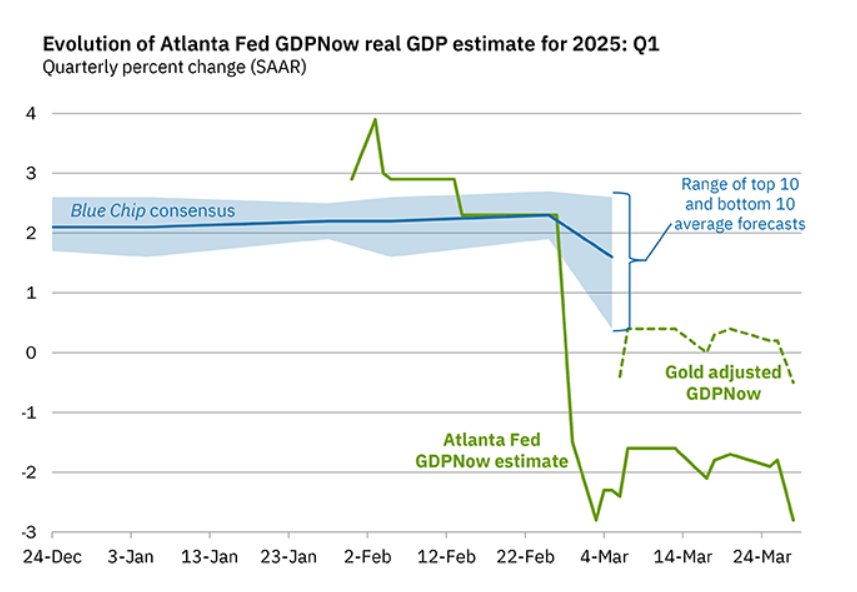
Atlanta Q1 GDP forecast (is not a subjective projection, is a mathematical model based on economic data released during the quarter) is at -2.8% for Q1.
I have not seen this number this negative for a long time.
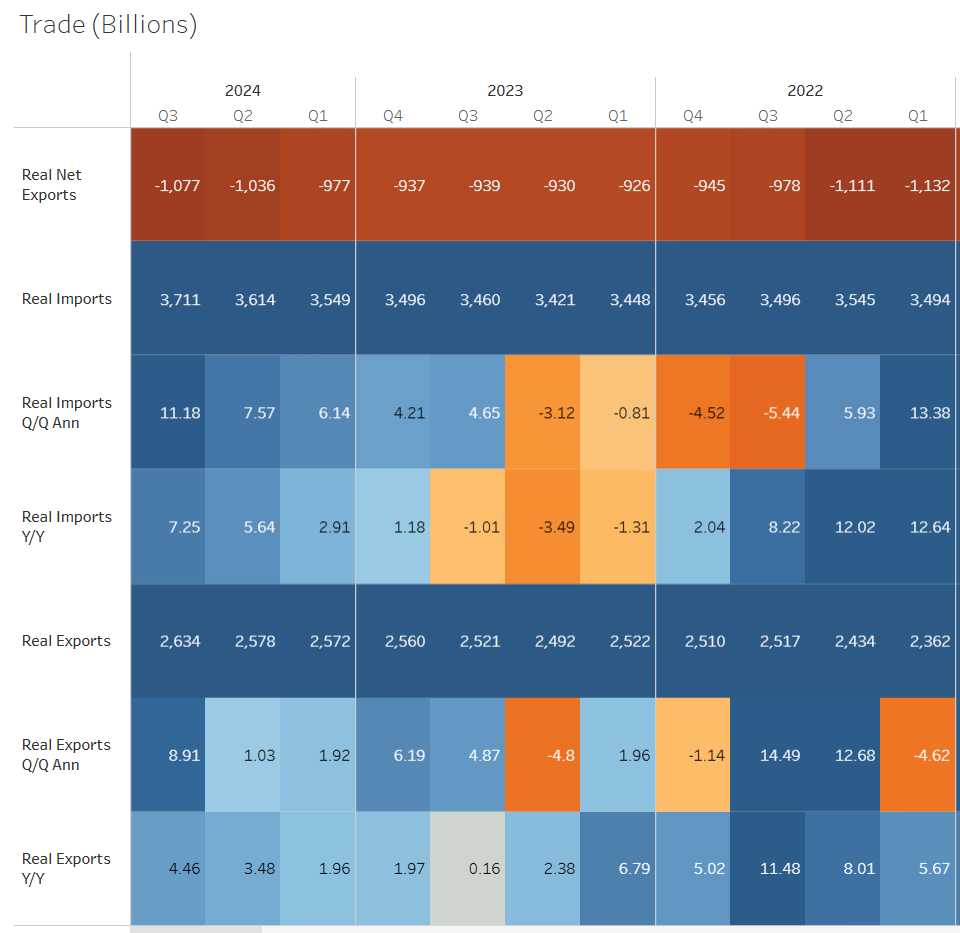
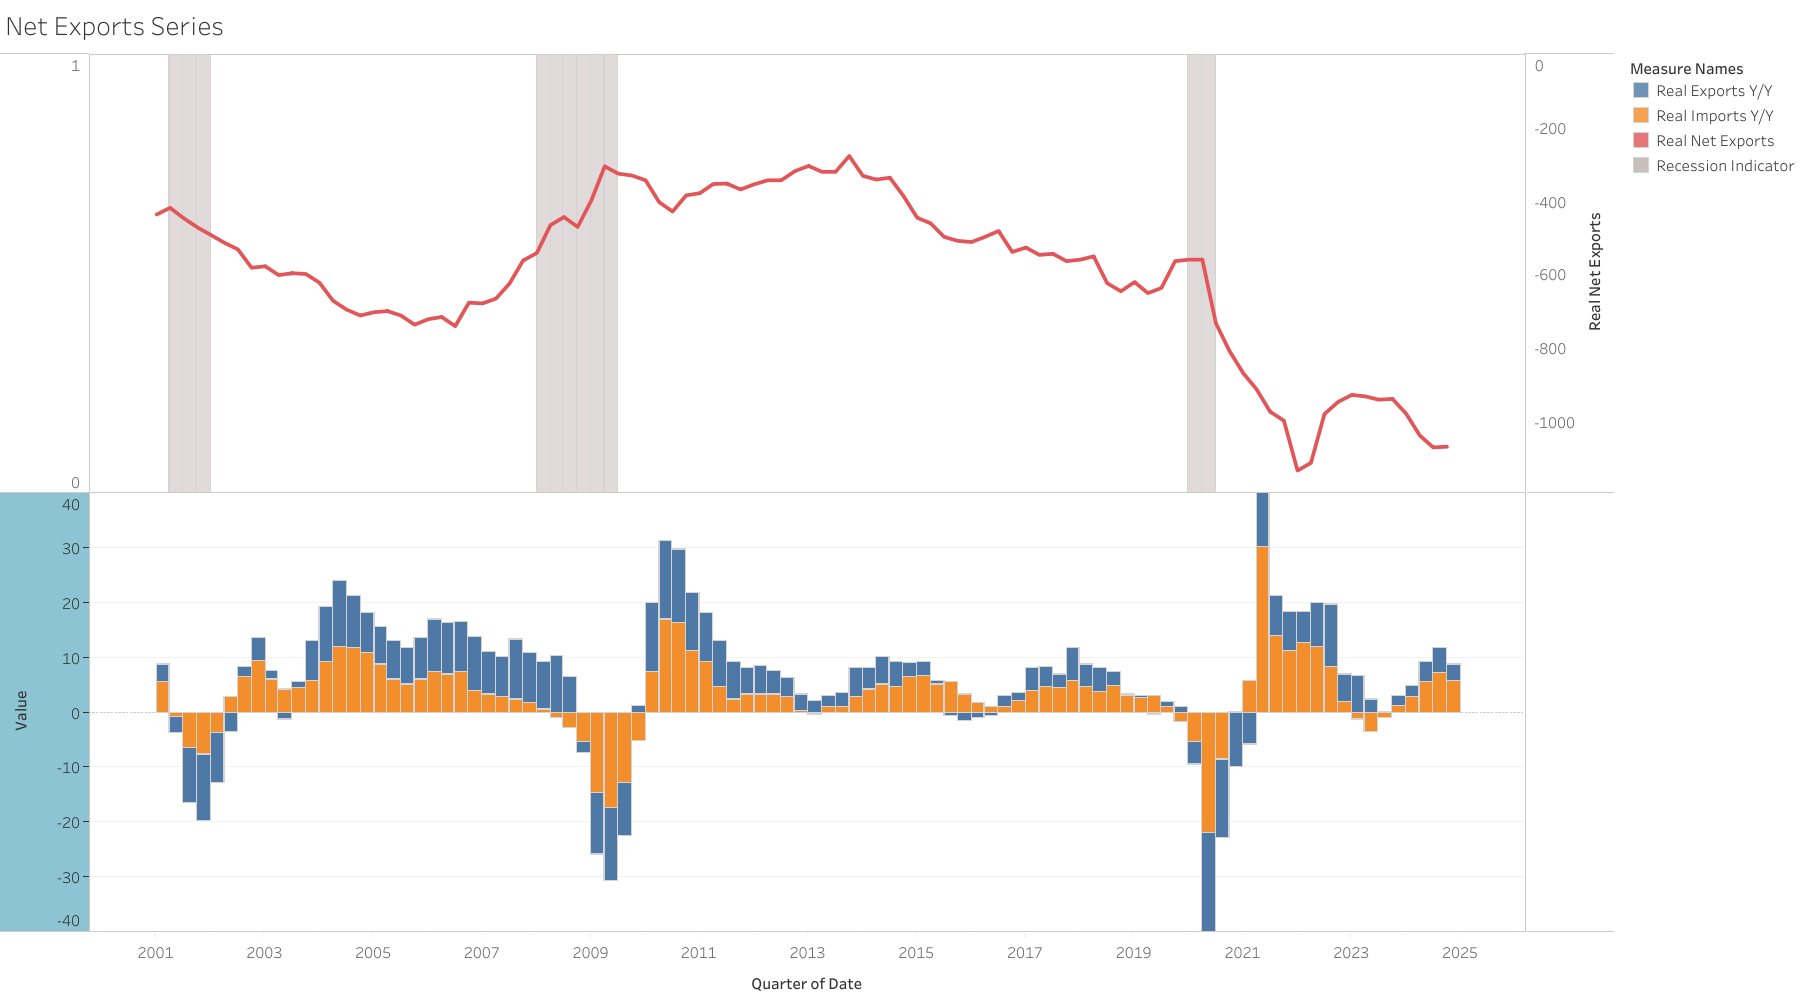
Trade uncertainty weighing on imports and the economy since net exports are the primary drag with data until now. Companies bringing forward demand due to expectations of tariffs increasing.
But other components not showing as much strength either
I expect the final number not to be as bad as this current forecast (strong holiday season affecting comps, weather events in jan, and imports brought forward that should stabilize more in upcoming data), but it is definitely not painting to be as strong as a quarter as the ones we saw in 2023/2024.
The economy does seems to be decelerating a bit currently due to all the uncertainty, and for a market that is still pricing very high expectations in growth (10% earnings growth), could lead to a continuation of a correction if this expectations continue to come down. And will continue to weigh on cuts expectations, and lower yields
@moritz this could be interesting to you, since its kind of in line with Ed Yardeni assessment
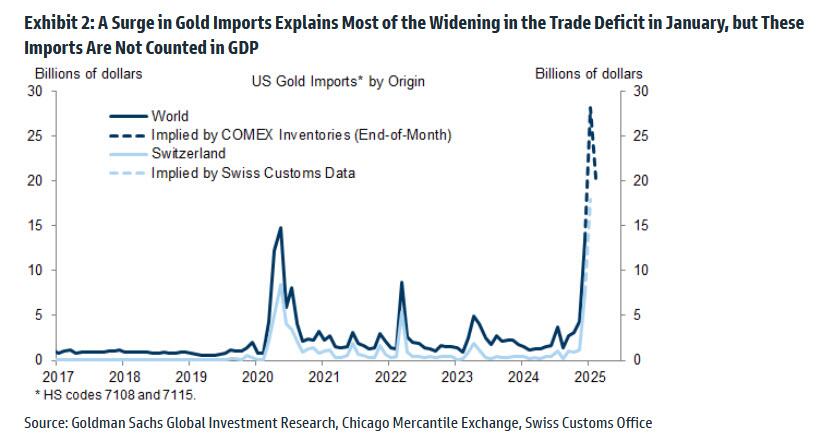
Based on research from Goldman’s Manuel Abecasis it appears everyone can relax a little bit about the huge negative GDP print from the Atlanta Fed (which is mostly, but not entirely, due to the jump in goods imports) as most of the $31bn increase in the trade deficit was a $25bn surge in gold imports as traders furiously moved gold to the US to avoid market dislocations in the event of tariffs on settling gold contracts.
If correct, that portion of the increase in imports has no actual GDP impact (the BEA excludes gold from their calculations according to Goldman, and even if they didn’t it would be added to inventories (as will other “front loading” which will be a positive offset to the negative from the imports and end up netting out in the actual report).
The rest of the GDP slowdown Goldman says is from cold weather, residual seasonality and normalization from an “unusually strong pace” in the second half of 2024. FWIW they say their tracker shows a 1.6% GDP at this point and they are looking for 2.2% when it’s all said and done.
Yeah that’s interesting indeed as its another indication that the Atlanta GDP forecast is not relevant. (Esp. the fact that Goldman Sachs model estimates 1.6% growth)
What I find a bit strange is that the Atlanta Fed model might not capture gold correctly because I would have expected that the model is sophisticated but maybe it is not.
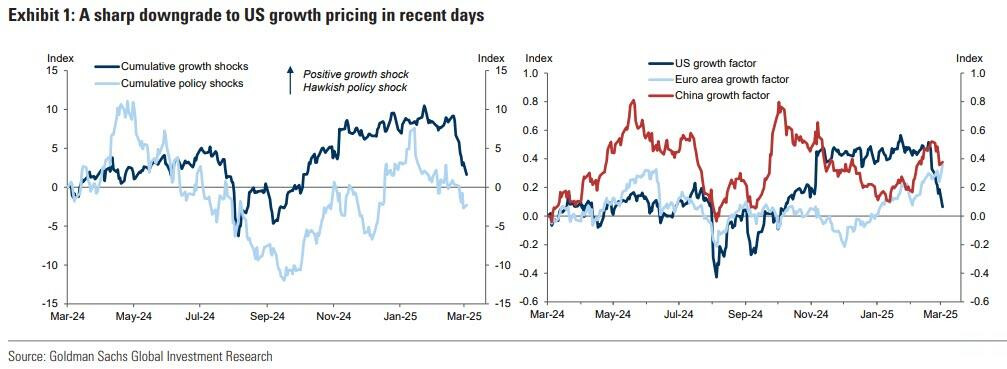
Goldman notes that US growth pricing has plummeted to the lowest since October (when it was going the other way), but says while “growth pricing now looks … lower than our baseline growth forecast … we still think there are plausible scenarios where growth pricing might need to fall more, particularly if trade policy risks escalate or if the impact of uncertainty on spending is large.”
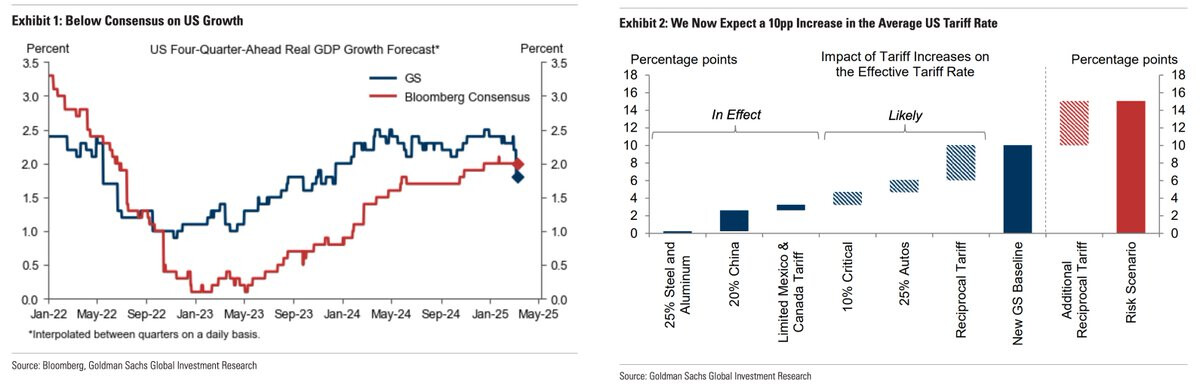
Goldman cut seven tenths their 2025 GDP forecast to +1.7%.
The bank’s Jan Hatzius said while the concerns over a negative GDP print for 1Q were “greatly exaggerated…trade policy assumptions have become considerably more adverse.”
Goldman now expects the average US tariff rate to rise by 10 percentage points in 2025, double the bank’s previous forecast and, as Hatzius noted, “about five times the increase seen in the first Trump administration," with an additional 10% levy on critical goods, a 25% global tariff on cars and the “reciprocal” tariffs to be unveiled April 2nd.
“The reciprocal tariff matters most,” Hatzius said. “Not because other countries impose much higher tariffs on the US than vice versa — with a few exceptions such as India they don’t — but because the administration views e.g. Europe’s VAT of 20% as equivalent to a tariff, even though it is imposed equally on imported and domestically produced goods…a VAT-inclusive reciprocal tariff alone could raise the average US tariff rate by 10ppt or more.
Atlanta Fed on Friday did a manual adjustment to their GDP model to account for the monetary gold imports
The standard GDPNow model forecast was initially revised downward to -2.4%, but after excluding gold-related effects, an alternative “gold-adjusted” model suggests a less severe GDP contraction (ranging from -0.4% to +0.4% growth).
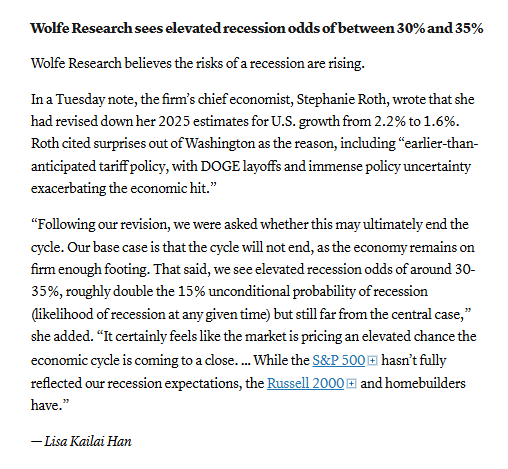
Wolfe Research’s chief economist, Stephanie Roth, says she’s revising down her 2025 GPD estimate six tenths to 1.6% and raising the firms recession probability to 30-35%.
Roth cited surprises out of Washington as the reason, including “earlier-than-anticipated tariff policy, with DOGE layoffs and immense policy uncertainty exacerbating the economic hit
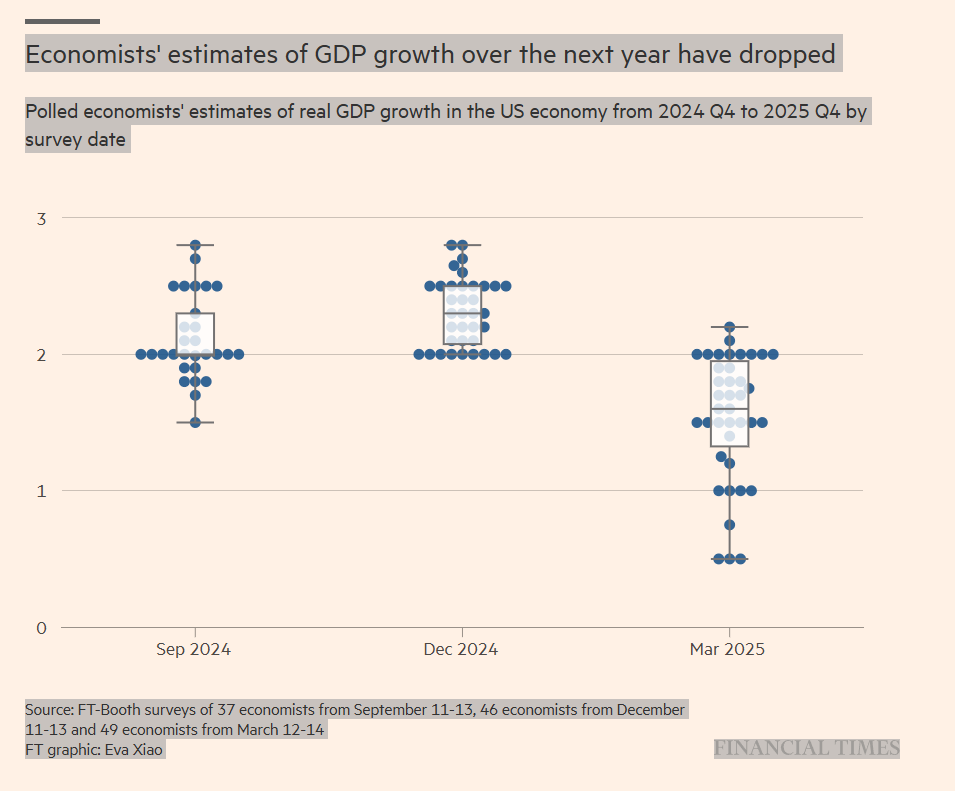
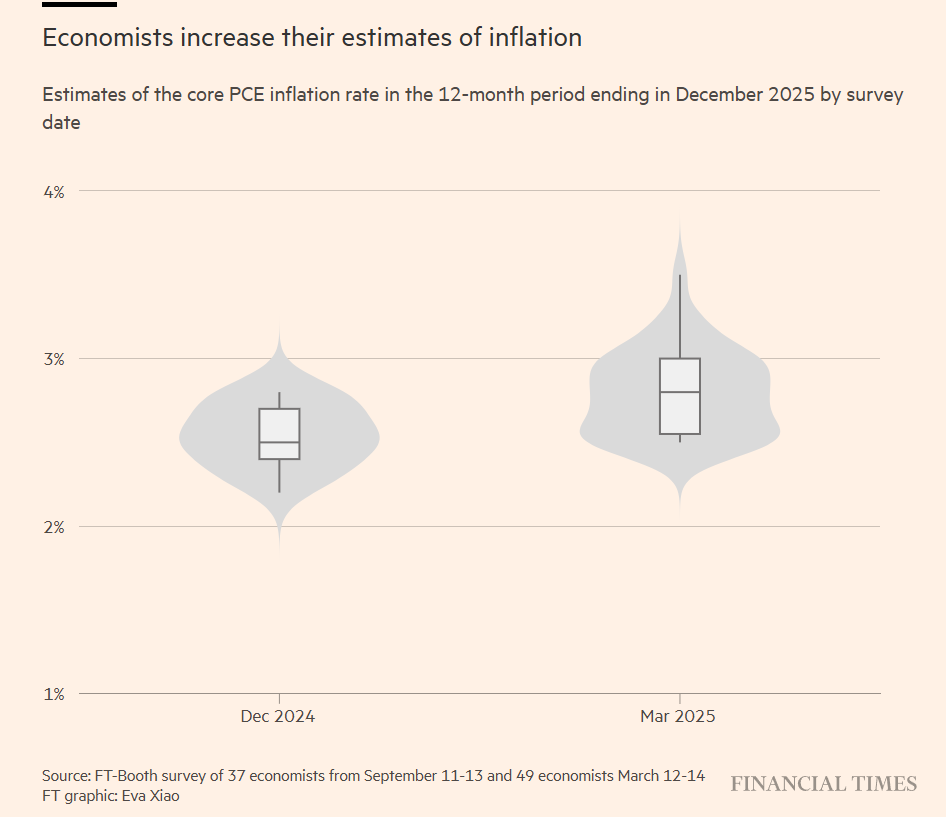
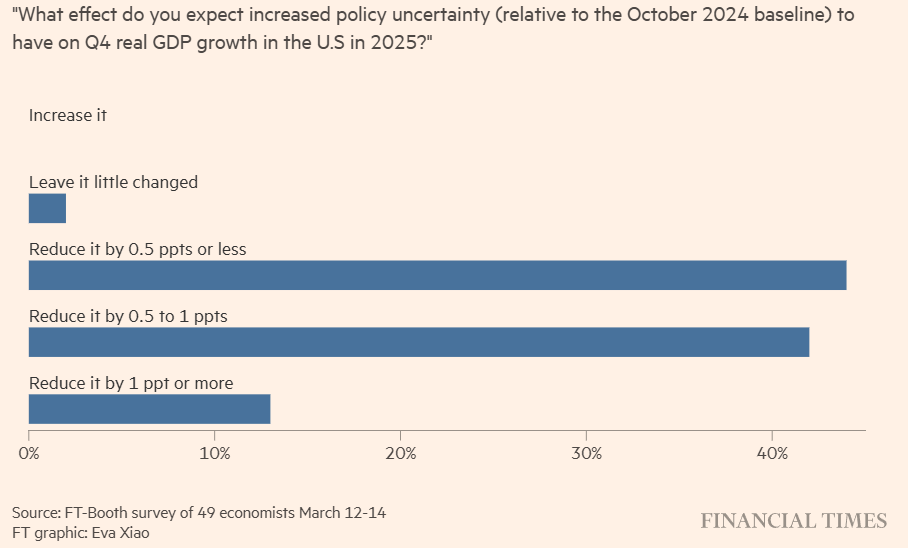
Economists have lowered their estimates for U.S. GDP growth and raised those of inflation over the next year, according to FT-Booth survey.
The median estimate among the 49 economists surveyed was for the economy to expand 1.6 per cent in 2025, down sharply from 2.3 per cent in the December survey
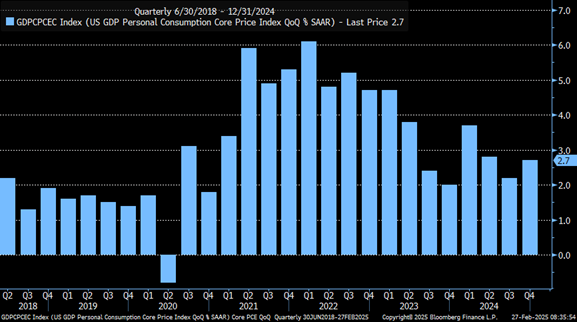
They expect the core PCE to rise at an annual rate of 2.8 per cent by year-end from a December forecast of 2.5 per cent.
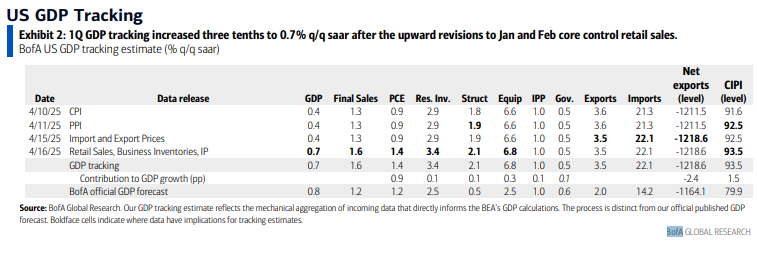
After the last two weeks of data (including most jan and feb) Atlanta Real GDP models forecasts Q1 GDP at -0.5% (adjusted for gold imports)
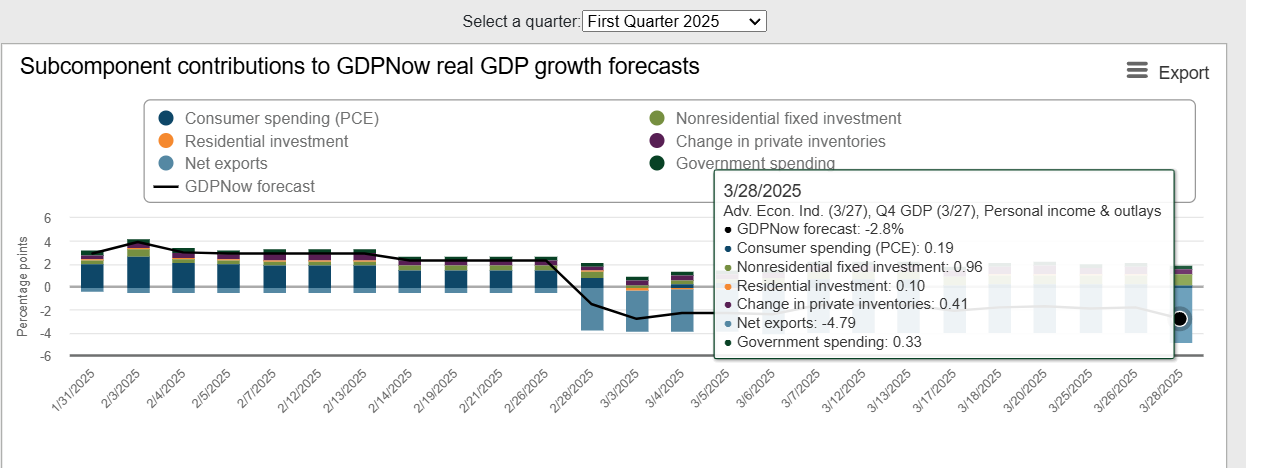
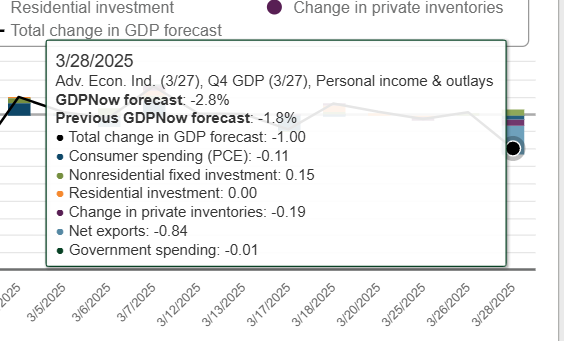
Consumer spending expected to have very low contribution this quarter after the weak real spending reading for these 2 months.
Net exports will still be a negative contributor beyond the gold exports. This week February trade balance was also high at -147 B vs -153 B in January 2025.