US Nonfarm Payroll and Employment Levels

Amazing overview in tableau! This makes it very easy to put the decline into perspective.

As can be seen in the methodological table 3 posts ago, the sample size for the household survey is small; therefore, sampling errors can be way larger and a 600k employment error is within the realms of possibility.

This appears to be definitely not the case with the contraction of full-time employment!

If you find any insightful sources, analysis, or discussion of the topic, it would be great if you could post it directly here. I also wonder if this decline is discussed on Wall Street’s main media (CNBC, Bloomberg, etc.)

Big surprise in nonfarm job creation in January, the divergence between the 2 surveys continues to increase, which is very confusing.
Overall the underlying weakness in the data is still present, much more than what the job creation would indicate.

Also, last month’s big drop in employment and full-time employment seems to be an outlier since this month was much smaller but still negative.

  • The US added +353,000 jobs in January versus 187,000 expected (last month also had a significant revision up +115k), however, the employment survey shows that employment declined by -31,000, most labor force decreasing.
    In 2023, nonfarm payrolls showed 3,056 jobs added, while the household survey only has 1,883 new employed persons. And their 6M annualized growth rate is showing different very trends too.

  • Unemployment is unchanged at 3.7% vs 3.8% expected.

  • 1 of the negatives is that wage growth increased strongly again, 0.6% m/m (0.3% expected) and 4.5% y/y (4.1% expected)

  • And while employees’ weekly earnings are increasing, their hours worked are being cut very significantly, hence their Aggregate Hours growth is very weak currently too at 0.16% 6m annu rate.

  • Full time employment declined by 63k, part time for economic reasons increased by 233k, and multiple job holders decreased by 293k.

  • U6 unemployment rate did increase to 7.2% from 7.1%

https://www.bls.gov/news.release/empsit.nr0.htm

2 Likes

This is probably why government data is each time less helpful and trustworthy, and producing so many mixed signals and revisions.
Most of the data reported is only statistical computations and inference.

https://twitter.com/LizAnnSonders/status/1760708047897346393/photo/1

1 Like

I=8

  • Nonfarm payrolls increased by 275,000 in February, exceeding January’s 229,000 (revised down from 353,000) and 200,000 estimate.
  • Unemployment rate rose to 3.9%, above 3.7% estimate.
  • Labor force participation rate was steady at 62.5%
  • Average hourly earnings rose 0.1% on the month, lower-than the 0.2% estimate (+0.6% previously).
  • Yearly, average hourly earnings rose 4.3%, lower-than 4.4% estimate (+4.5% previously).
  • Job gains were led by healthcare (+67,000), leisure and hospitality (+58,000),government (+52,000), social assistance (+24,000) and construction (+23,000).
  • Stock futures rose slighly following the results- Nasdaq 100 added 0.2% while S&P 500 gained 0.2%.

https://www.bls.gov/news.release/pdf/empsit.pdf

1 Like

Those revisions for payroll numbers happening are wild, more than 100k from one month to another. So jobs added could very well be much less than 275k this month.

2 Likes

Permanent job losses increasing, while temporary layoffs decreasing. Another not-so-great sign.

I also created a table and chart to illustrate that recessions usually start when unemployment rate increases from the low are still pretty mild and on avg ~0.5
We can also see that all recessions have seen unemployment go over 2pts increases from the low, even mild ones. So, currently, I would expect unemployment to reach at least a minimum of ~6% in a recession scenario for this cycle.


And this is also a surprising chart for me, according to the same government data, all the net employment added since 2019, has been all for immigrants. US Native employment has remained the same at ~130M, and actually declining lately.
Immigration probably helping with shortages and at lower cost probably too.
So, basically the US economy net job gains lately seem to be mostly immigrants part time jobs.


1 Like

I=8

  • Nonfarm payrolls increased by 303,000 in March, above 200,000 estimate and 270,000 added in February (revised down from 275,000).
  • Unemployment rate moved down to 3.8%, against expectations for it to stay at 3.9%.
  • Labor force participation rate rose to 62.7% in March from 62.5% in February, above 62.6% estimate.
  • Average hourly earnings rose 0.3% for the month and 4.1% y/y, both in line with the estimates.
  • Job gains were led by healthcare (+72,000), government (+71,000), construction (+39,000) and leisure and hospitality (+49,000).
  • Stock futures rose following the report- Nasdaq 100 added 0.4% while S&P 500 gained 0.3%.

https://www.bls.gov/news.release/archives/empsit_04052024.pdf

2 Likes

Overall good report on the surface, with the same underlying weaknesses present but stable for now.

The divergence between the two measures continues, but this month it got better. The household survey added 498K employees but was still weaker than payrolls. (this survey is highly volatile, so big increases/declines are normal)


The increase in employment was all due to part-time jobs in March 2024. Part time increased by 691K, while full-time declined by 6K.
Since the FED started hiking, full-time is basically flat, and all gains point to part-time.

Most job gains continue to come from the non-cyclical parts.

Unemployment decreased mostly due to the labor force increasing. As long as supply continues to improve, unemployment will behave relatively okay.

2 Likes

I=8

  • Nonfarm payrolls increased by 175,000 in April, below 240,000 estimate and 315,000 added in March (revised up from 303,000).
  • The unemployment rate rose to 3.9% against expectations that it will stay unchanged at 3.8%.
  • Average hourly earnings rose 0.2% for the month and 3.9% y/y, both lower-than estimates.
  • Labor force participation rate held steady at 62.7%.
  • Job gains were led by healthcare (+56,000), social assistance (+31,000), transportation and warehousing (+22,000) and retail (+20,000).
  • Stock futures rose following the report- Nasdaq 100 added 1.6%, Dow Jones rose 1.3% while S&P 500 gained 1.1%.

https://www.bls.gov/news.release/archives/empsit_05032024.pdf

1 Like

Soft report all around, but is still tight enough that don’t signal cuts anytime soon.
Powell said only a significant weakness will allow them to.

While there were 175K payroll added, employment only increased by 25k. The divergence continues between the 2.

There was a significant increase in full-time employment of 949K this month.
Part time for economic reasons also continued to increase, 131k more this month.


Payrolls by sector. The deceleration in payrolls came mostly from government, leisure, and construction.

Not only unemployment has been increasing from the lows. The level and share of Permanent job losses have also been on the rise, since job openings and hiring have declined very significantly.
U6 unemployment also increased from 7.3% to 7.4%.


2 Likes

I=8

  • Nonfarm payrolls increased by 272,000 in May, up from 165,000 (revised down from 175,000) in April and exceeding the 190,000 estimate.
  • Unemployment rate rose 4% against expectations for it to stay steady at 3.9%.
  • Labor force participation rate fell to 62.5% from 62.7% in April.
  • Average hourly earnings rose 0.4% for the month and 4.1% y/y, above 0.3% and 3.9% estimate.
  • Job gains were led by health care (+68,000), government (+43,000), leisure and hospitality (+42,000) and professional services (+32,000).
  • Stock futures were down slightly following the report- Nasdaq 100 shed 0.3%, Dow Jones were down 0.2% while S&P 500 slipped by 0.4%.

https://www.bls.gov/news.release/pdf/empsit.pdf

2 Likes

It is so mixed this report, that it is difficult to make a clear assessment. Overall I think additional sofness continues, but still mild, and not enough to change FED mind, especially with wages still surprising to the upside.

All data used: US Economic Data - Google Sheets

2 Likes

I=7
Job gains cool in June, unemployment rate rose to 4.1%

  • The U.S economy added 206,000 jobs in June, less-than 218,000 in May (revised downwards from 272,000) but better -than the 200,000 estimate.
  • The unemployment rate rose to 4.1% - the highest level since October 2021, against expectations for it to stay steady at 4%.
  • Labor force participation rate rose to 62.6% from 62.5% in May.
  • Average hourly earnings were up 0.3% for the month and 3.9% on a yearly basis, both in-line with the estimates.
  • Job gains were mostly driven by government jobs (+70,000), health care (+49,000) and social assistance (+34,000).
  • U.S stock futures ticked higher following the report- Nasdaq 100 futures gained 0.9% while S&P 500 futures were up 0.5%.

https://www.bls.gov/news.release/pdf/empsit.pdf

2 Likes

Some insights following the June 2024 report

The unemployment rate has increased by 0.7% since the cycle lows. Every time in the past we have seen an increase of this magnitude (excluding 2020), the economy is entering a recession already.

The Sahm rule (Indicator signals the start of a recession when the three-month moving average of the U3 unemployment rate rises by 0.50 percentage points or more relative to the minimum of the three-month averages from the previous 12 months.) is also close to triggering at 0.43

But I would be wary currently of making conclusions right away since this cycle has broken many past relationships.

Job growth continues to come mostly from non-cyclical industries

Private job growth has cooled but remains mostly on par with pre-levels. Government job growth is taking a more important share recently.

The majority of the increase in the labor force has been mostly from the prime age group (25-54 years)


And mostly from immigration

Data: US Economic Data - Google Sheets

2 Likes

I=10

July nonfarm payrolls lower-than estimates, unemployment rate rises to 4.3% from 4.1%

  • Nonfarm payrolls fall to 114,000 in July from 179,000 in June (revised downwards from 206,000), coming below expectations for a 176,000 increase.
  • The unemployment rate rose to 4.3% against expectations for it to remain steady at 4.1%.
  • Labor force participation rate rose to 62.7% from 62.6%.
  • Average hourly earnings was up 0.2% for the month and 3.6% on a yearly basis, both coming below expectations for a 0.3% and 3.7% increase.
  • Dow futures shed 1.3%, S&P 500 fell 1.6% while Nasdaq 100 declined 2.3% as the jobs report raises recession fears.

https://www.bls.gov/news.release/archives/empsit_08022024.pdf

2 Likes

The challenge with the labor market is that when it begins to weaken, the decline can accelerate very rapidly
I wonder if the FED regrets not cutting rates in July., because if for some reason they have to cut more than expected in September or any point in the rest of the year (more than 25 bps), it will not send a great signal to the market, suggesting there were late once again to react.

The market seems is no longer taking bad news as good news, either.

50bps is being priced in already for September with a high probability.
The Jackson Hole Symposium this year will have special attention again.

Mohamed A. El-Erian opinion:
I am stunned by how quickly the market narrative has changed about what the Federal Reserve should do.
The widespread comfort of just a few days ago about the Fed having time to wait until September to cut rates by 25 bps is being replaced by more analysts and economists calling for 50 bps. I’ve even heard someone mention a cut between meetings!
Notwithstanding both my view of a faster and broader US economic slowing than many expected and the aggressive market reaction, it is unlikely that this already mistake-prone Fed will start its cutting cycle with 50 bps.
25 bps is more likely, and I say this even though I have consistently argued that they should have cut last Wednesday.

The Sahm Rule has been fully triggered at 0.53, indicating that the economy is already in a recession or on the verge of entering one.
As I mentioned previously, I am more skeptical this cycle that this rule will function exactly as it has in the past due to all the anomalies in this cycle. (maybe this time will require a higher threshold). However, I do not dismiss it entirely, given its 100% track record since 1960.
Hence, I wouldn’t be surprised if the deterioration trend in the unemployment rate continues that it will lead the NBER to declare in the future that we are already in a recession by now or about to enter one.

As I mentioned in the GDP post (some might question how we could be in or on the verge of a recession when GDP remains positive), GDP is not a reliable indicator of the economy’s future developments because the economy can continue to grow at the beginning of recessions.
Thus, it’s better imo, to keep an open mind and consider all data in conjunction.

I am in the process of processing and analyzing all the data, so I will post the details later on.

2 Likes

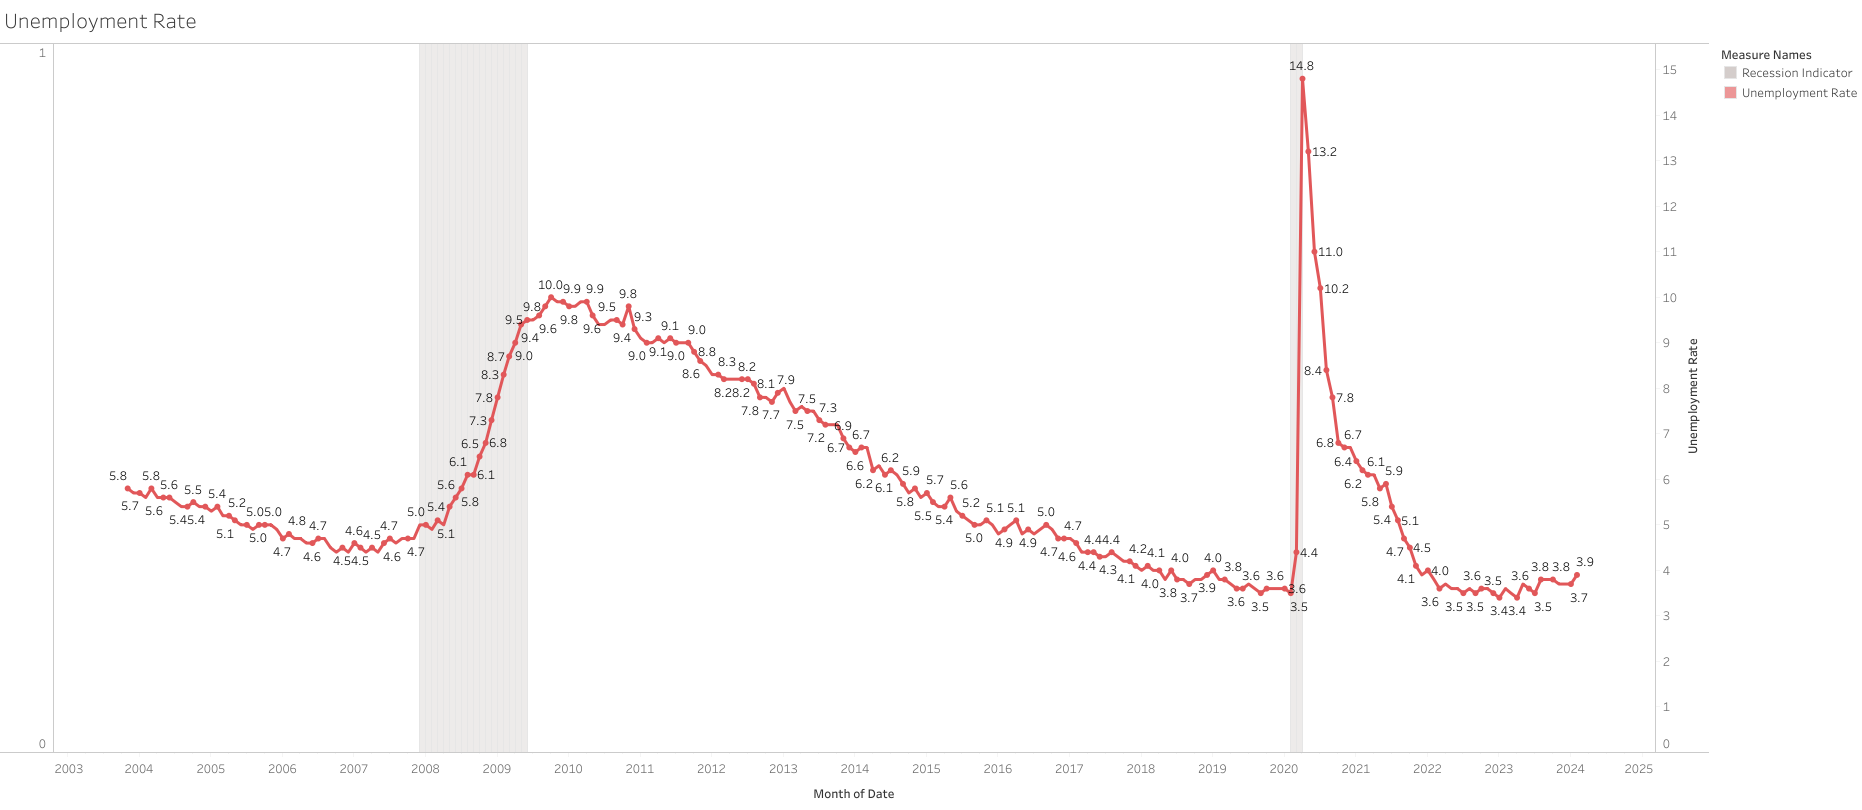
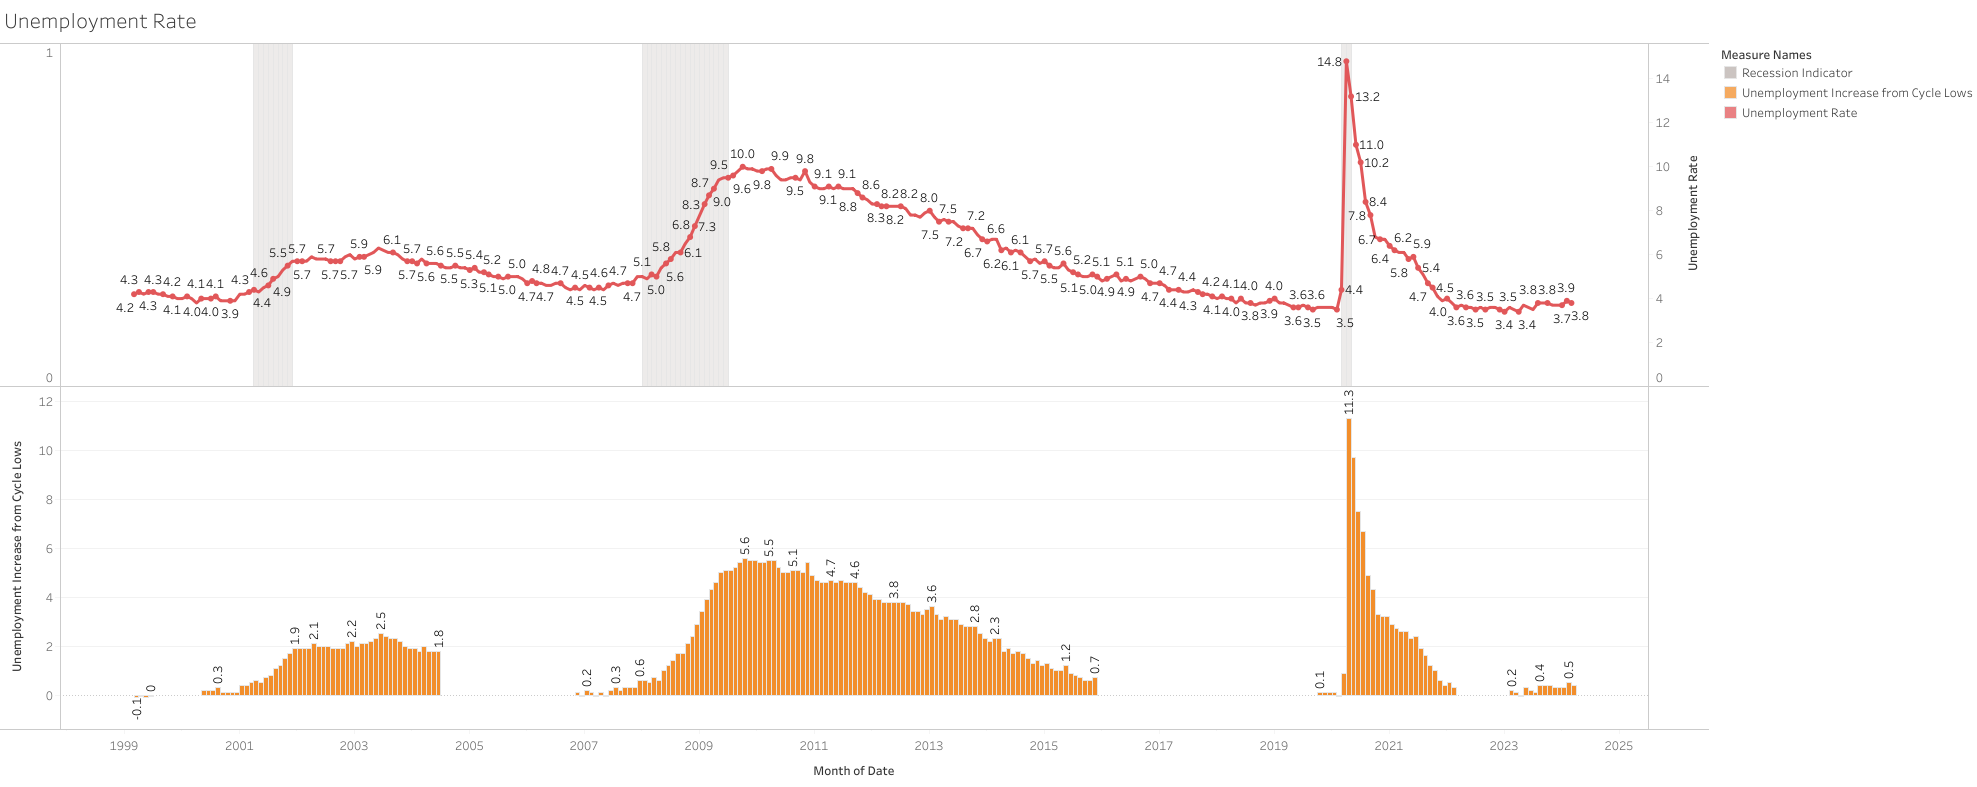
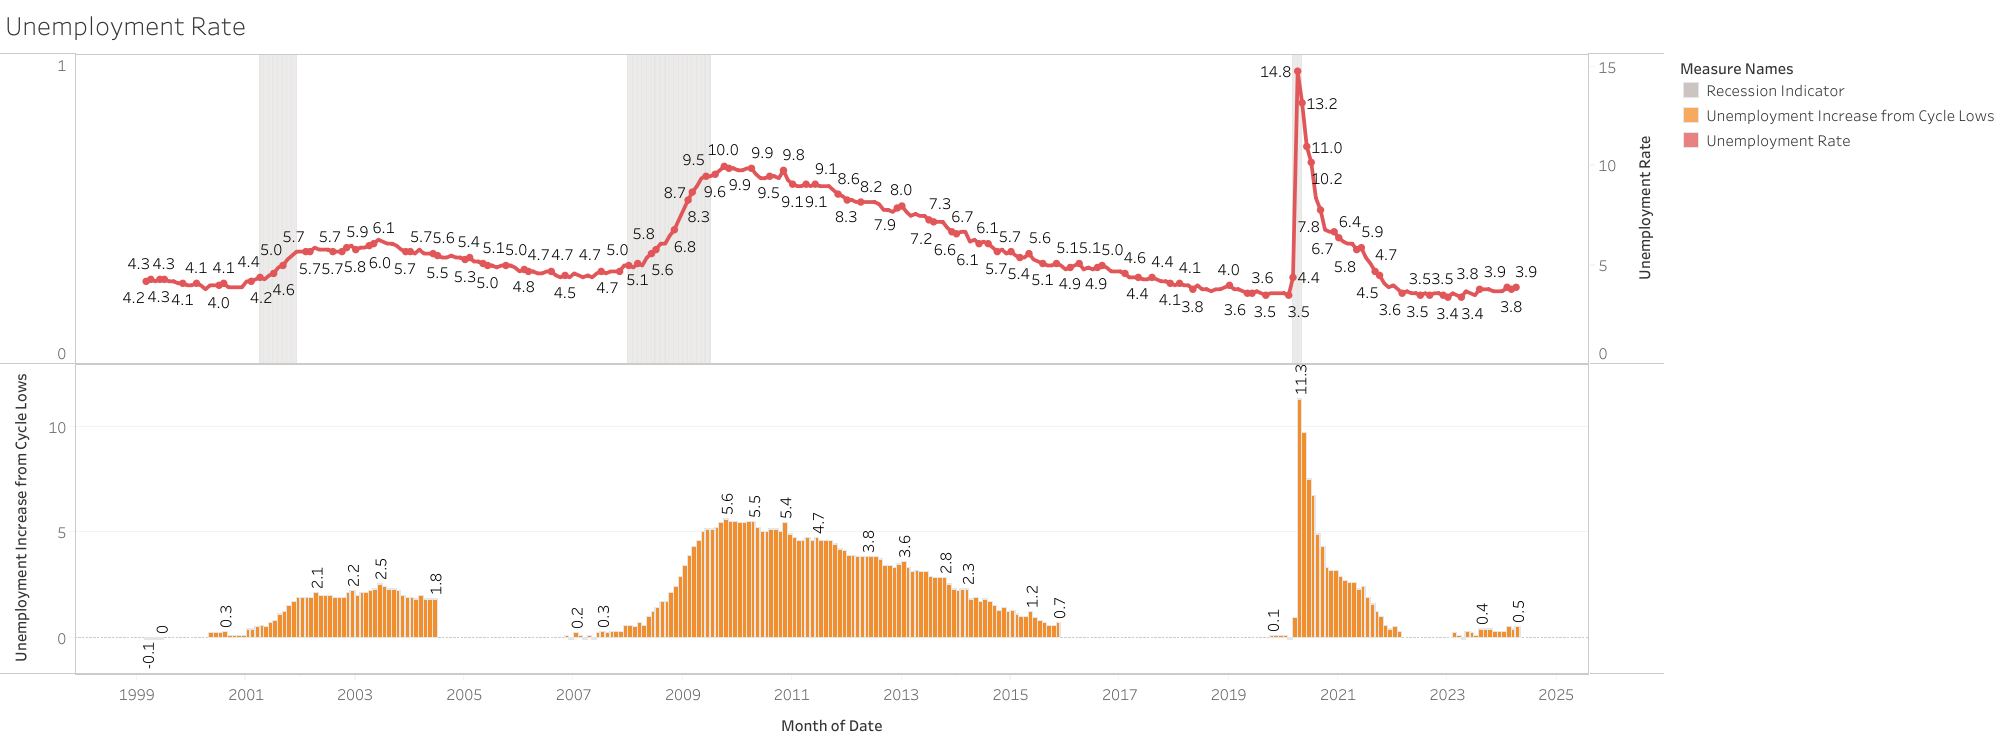
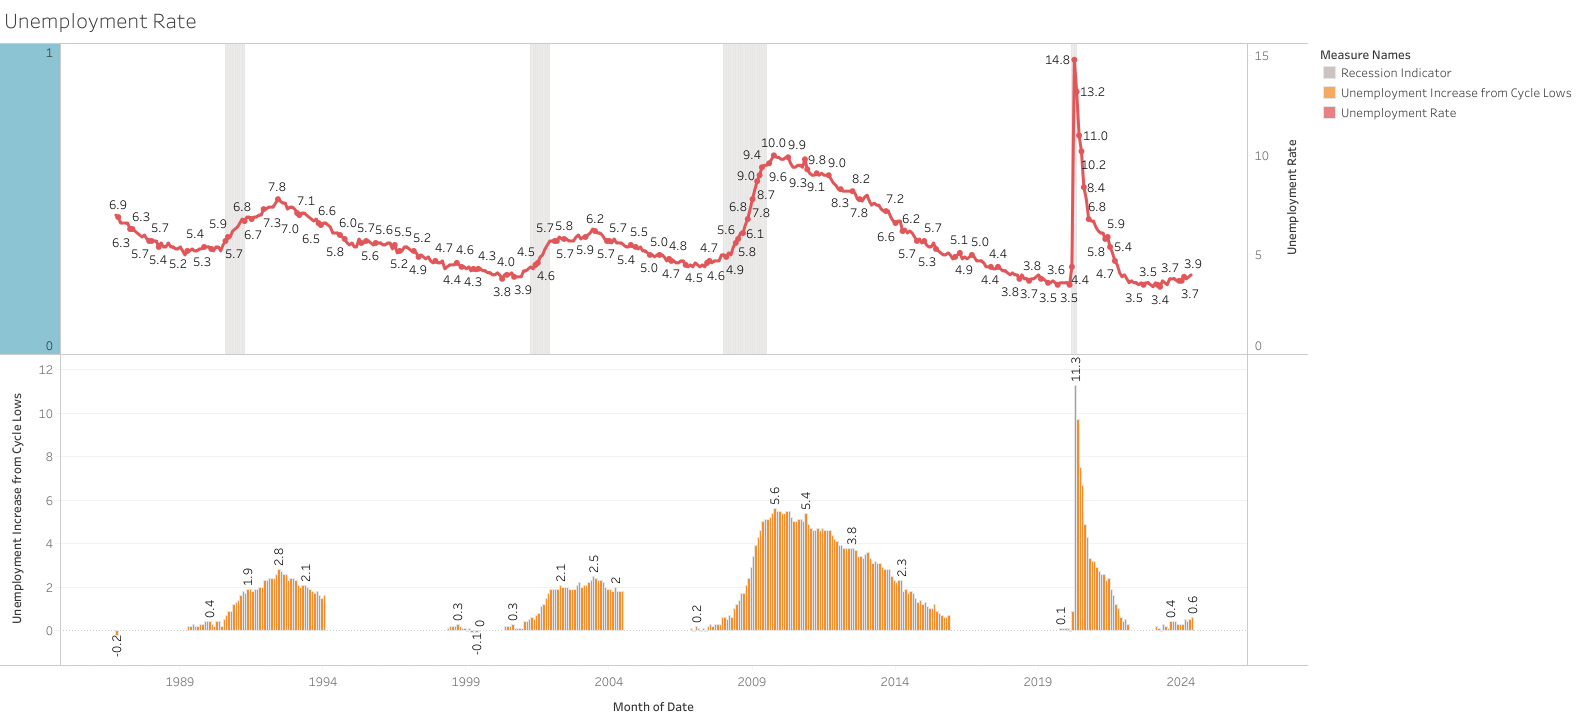
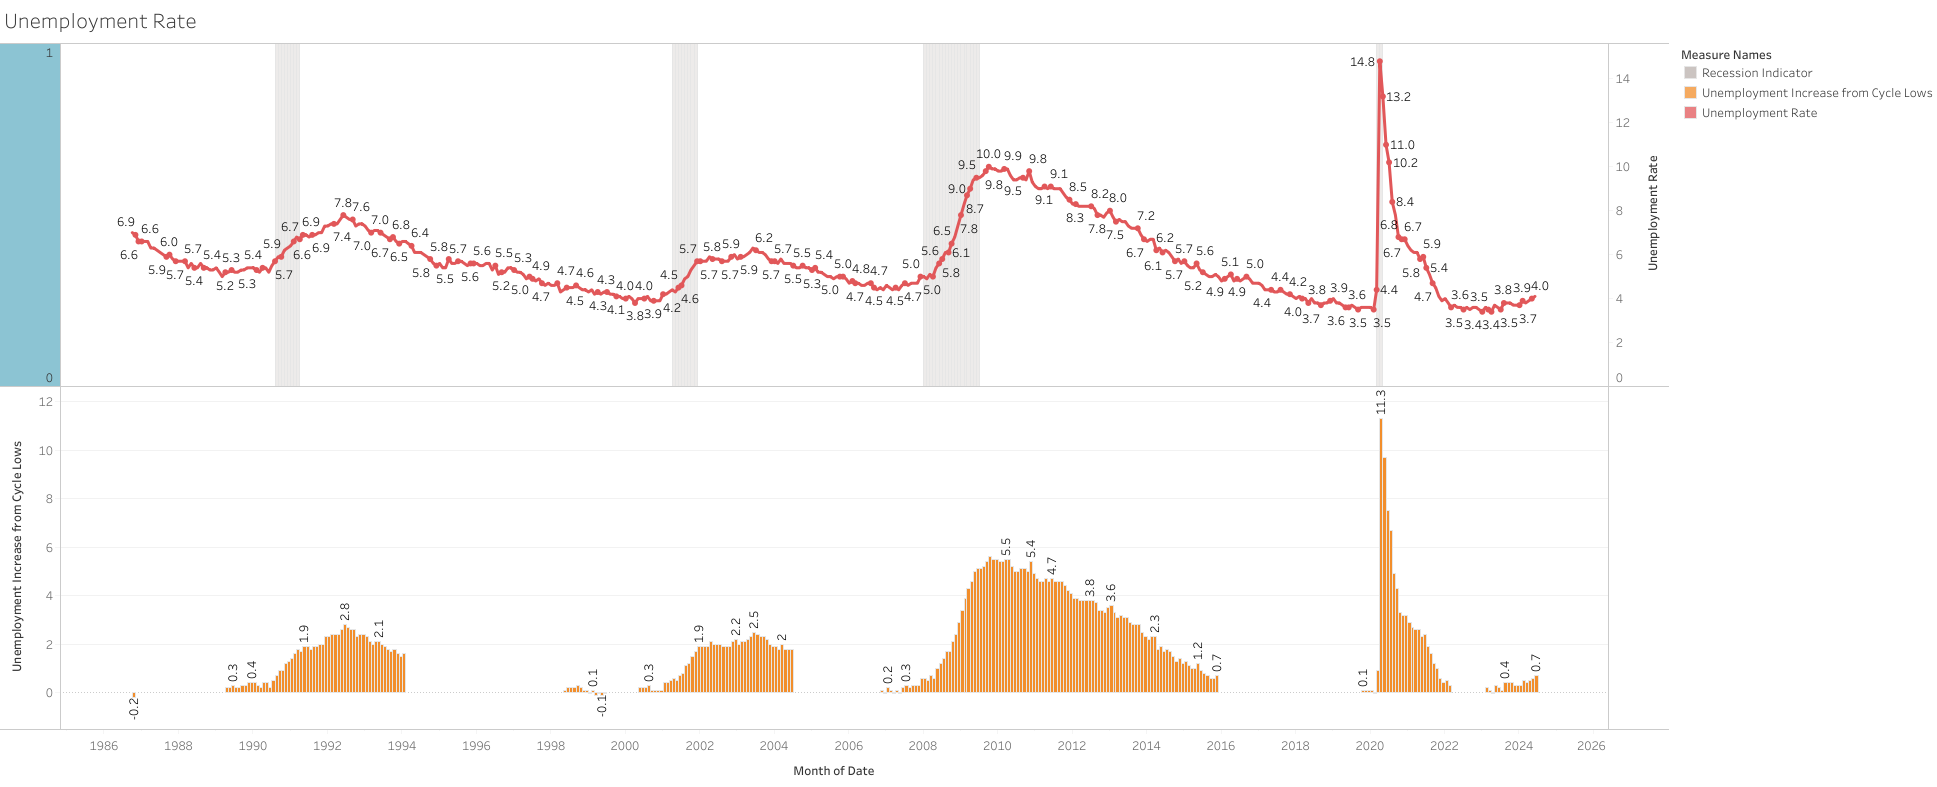
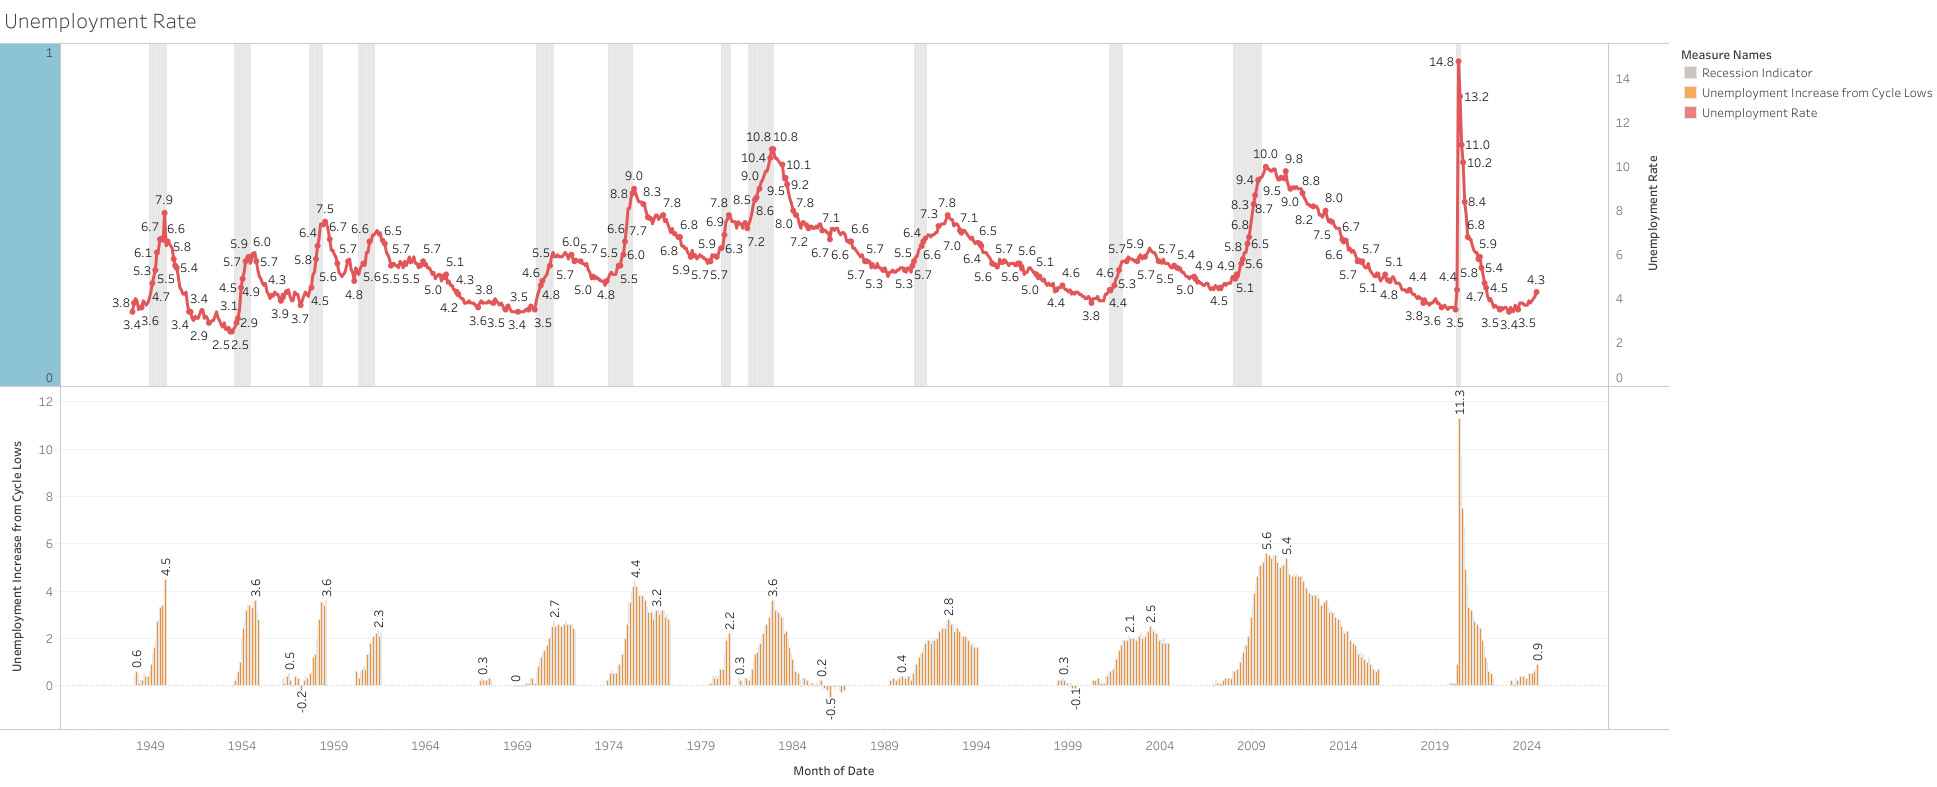
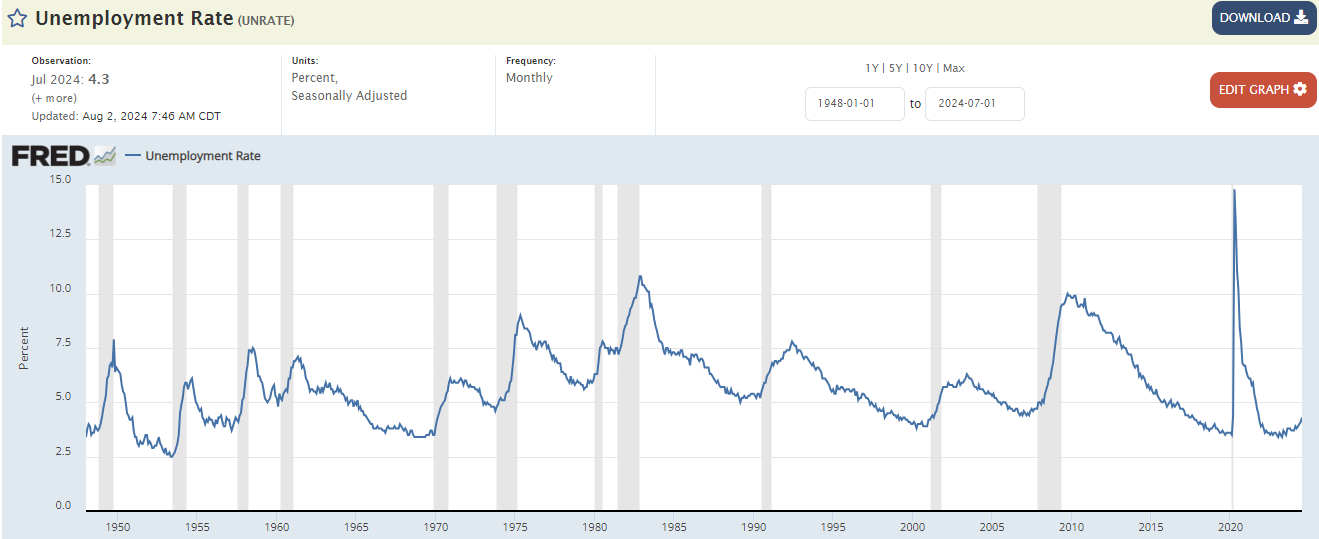
Unemployment Rate up almost 1 percent from the cycle lows (3.4%)

  • U6 unemployment (which includes marginally attached workers and those working part-time for economic reasons) had a bigger increase during the month of 0.4% getting to 7.8%, up 1.3% from cycle lows.
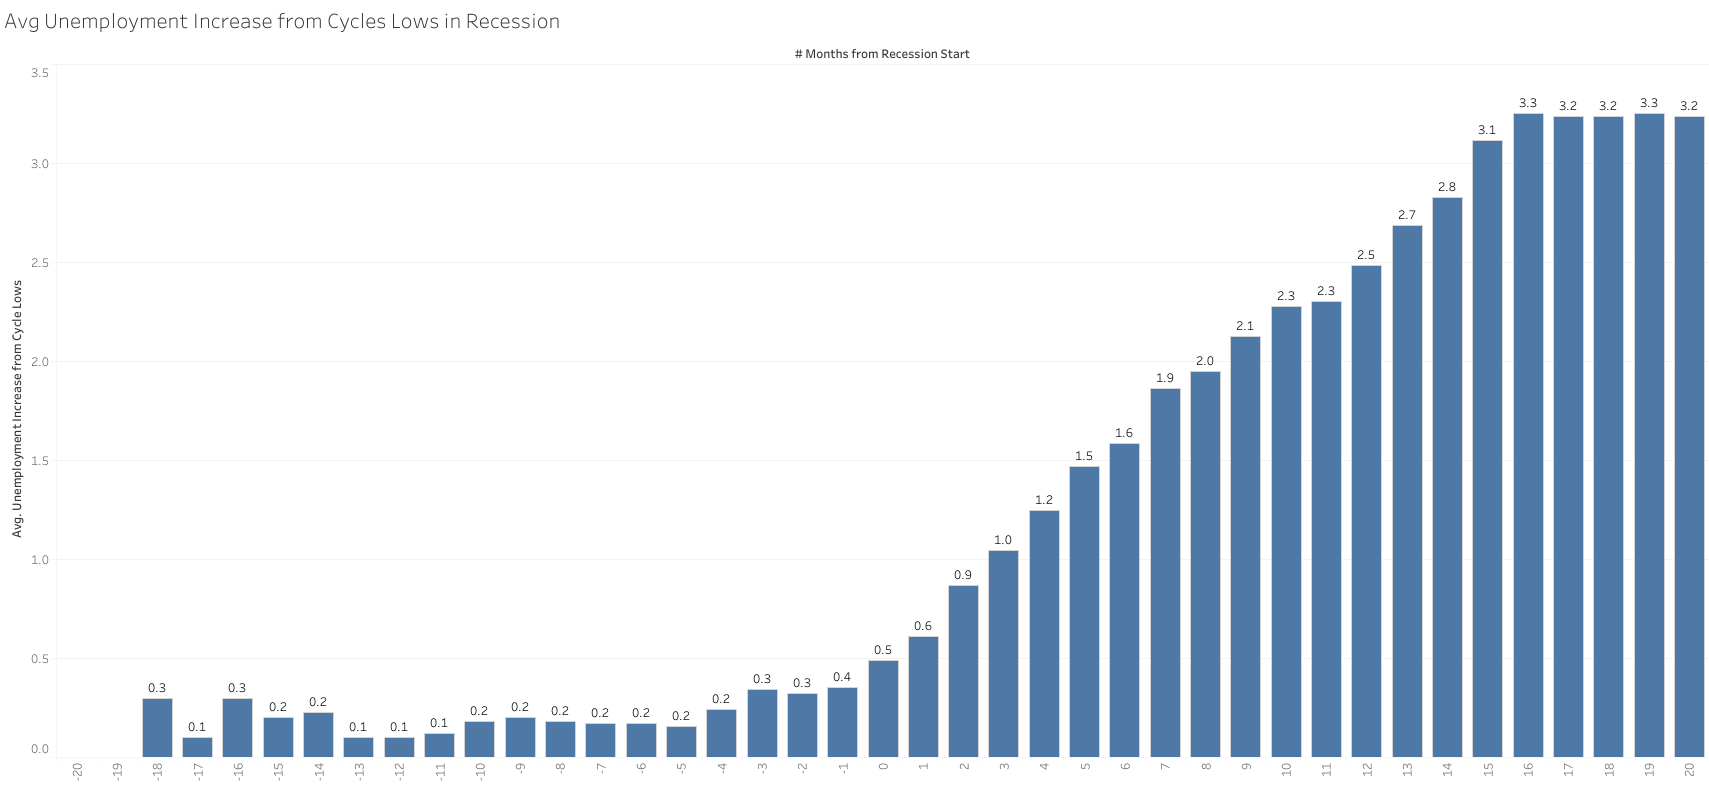
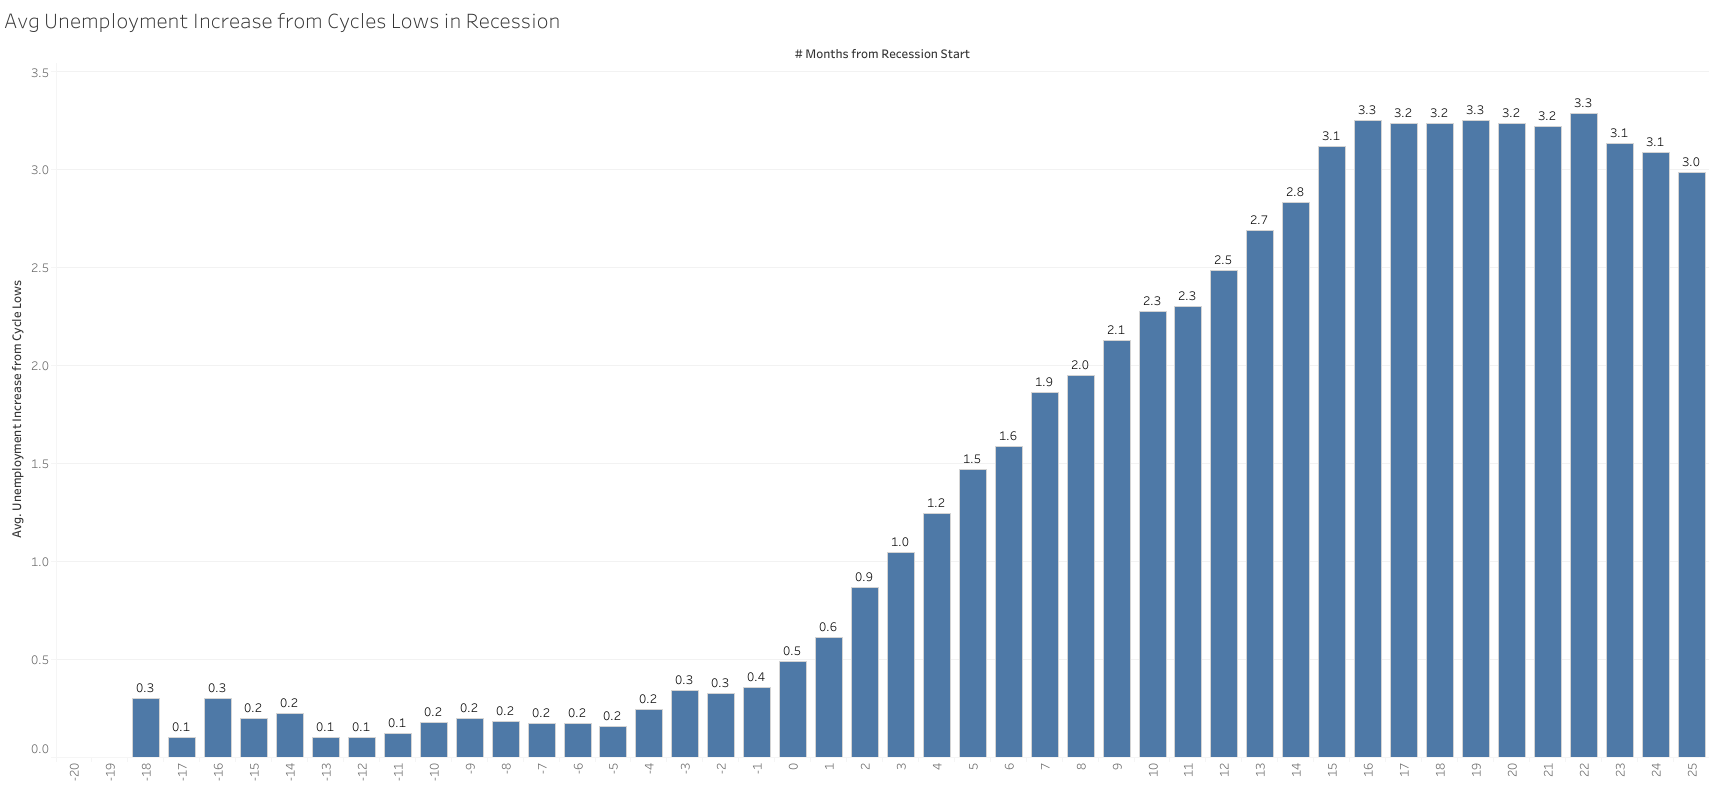
  • At a 0.9% increase in unemployment, the economy was already well into recession in past cycles since 1948. Unemployment has usually gone up in most cases by ~2-3% from the lows (2008 was an over 500 bps increase).

I have seen people argue that ~4% unemployment is still low for a recession to happen or to worry about, that’s wrong thinking imo.
There have been recessions starting at different levels of unemployment, and ~4% at the start is common to see actually. Recessions are declared by the increase from the lows in unemployment (and other indicators), and not the starting level.
Eg. 2008 starting at 5% unemployment rate (4.4% cycle lows) was a pretty severe recession compared to others starting at similar levels or worse.

Obviously, an economy with ~4% unemployment vs one with 7% is a much more robust economy overall, but this does not prevent temporary problems from arising, even severe ones.
I am not saying this is what will happen, just that an open mind about all of this is needed.

image

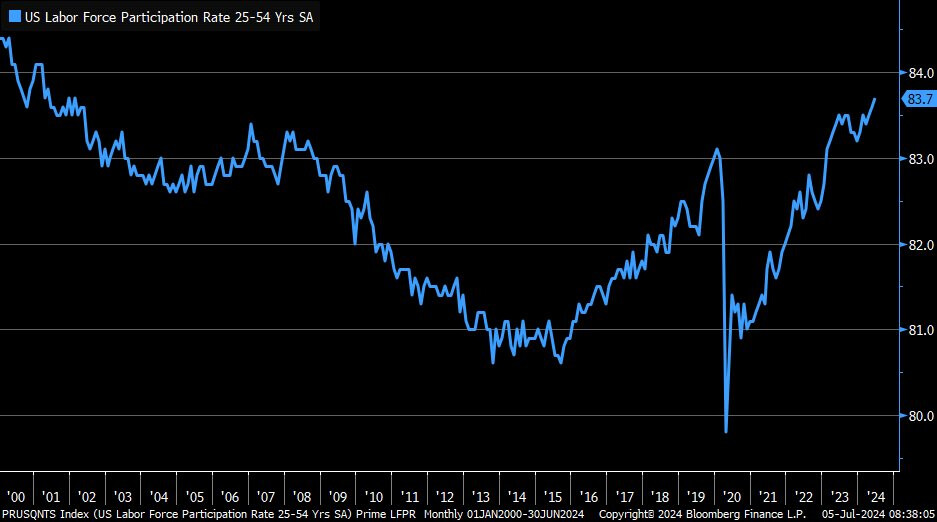
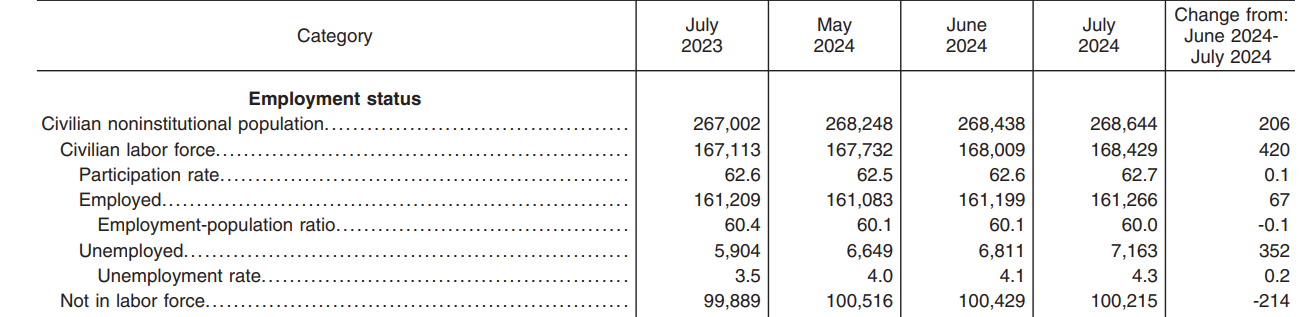
The unemployment rate this month came from both labor force expansion and an unemployment increase.

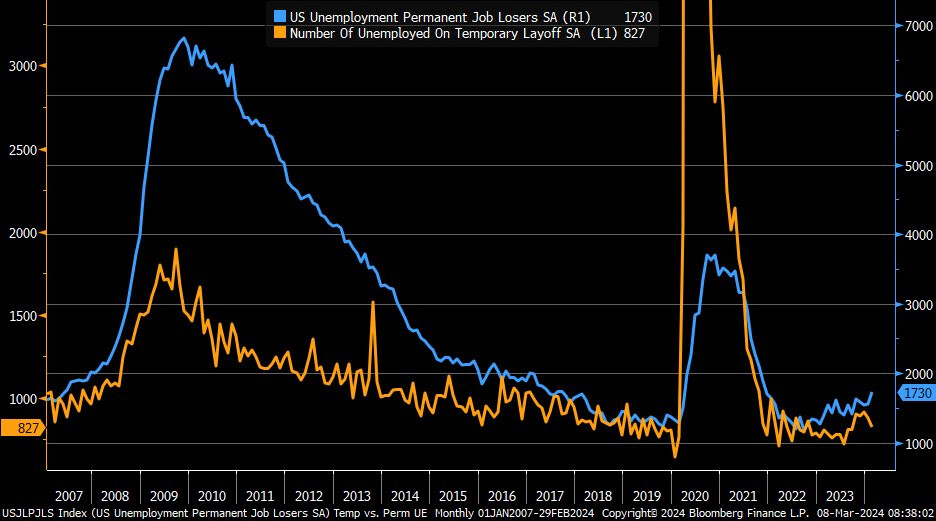
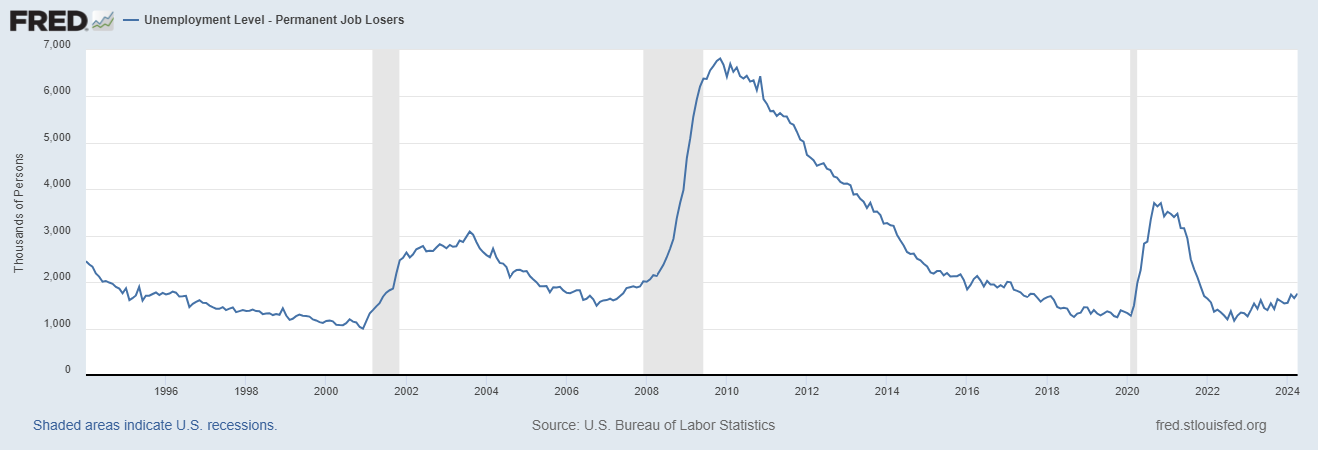
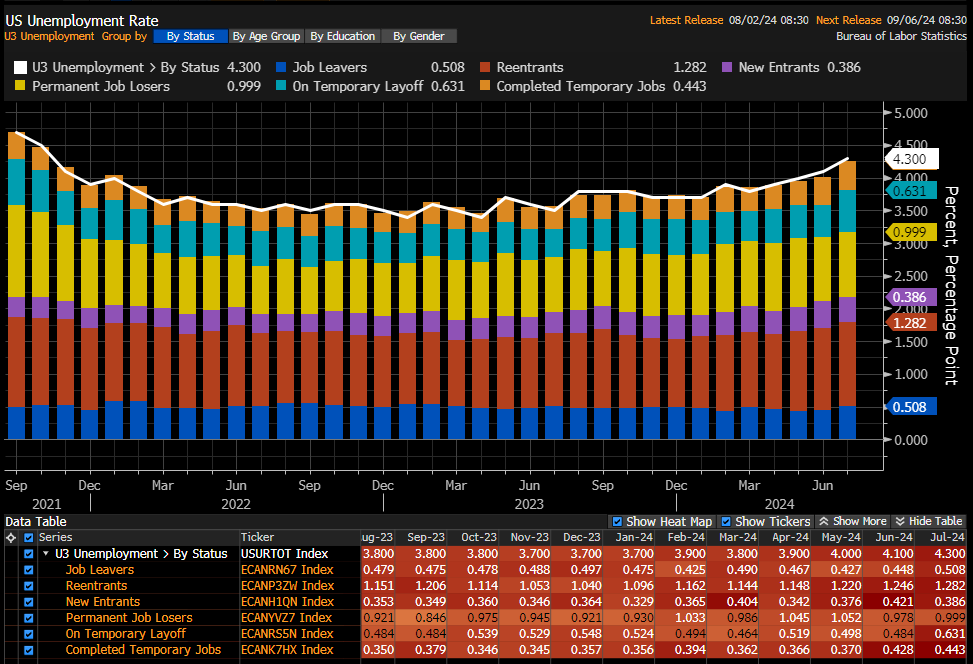
However, it seems reentrant or new entrant is not the primary reason for unemployment increasing this month, rather people leaving or on temporary layoff.
A reversal in unemployment in the coming months, making this month a temporary increase, will be dependent if these people can enter employment again relatively soon or not. So, while the increase in July 2024 is worrisome, additional confirmation is probably needed in the coming months to be sure.

I would take a more cautious stance going forward, but probably overreacting is not the best as the market is doing.

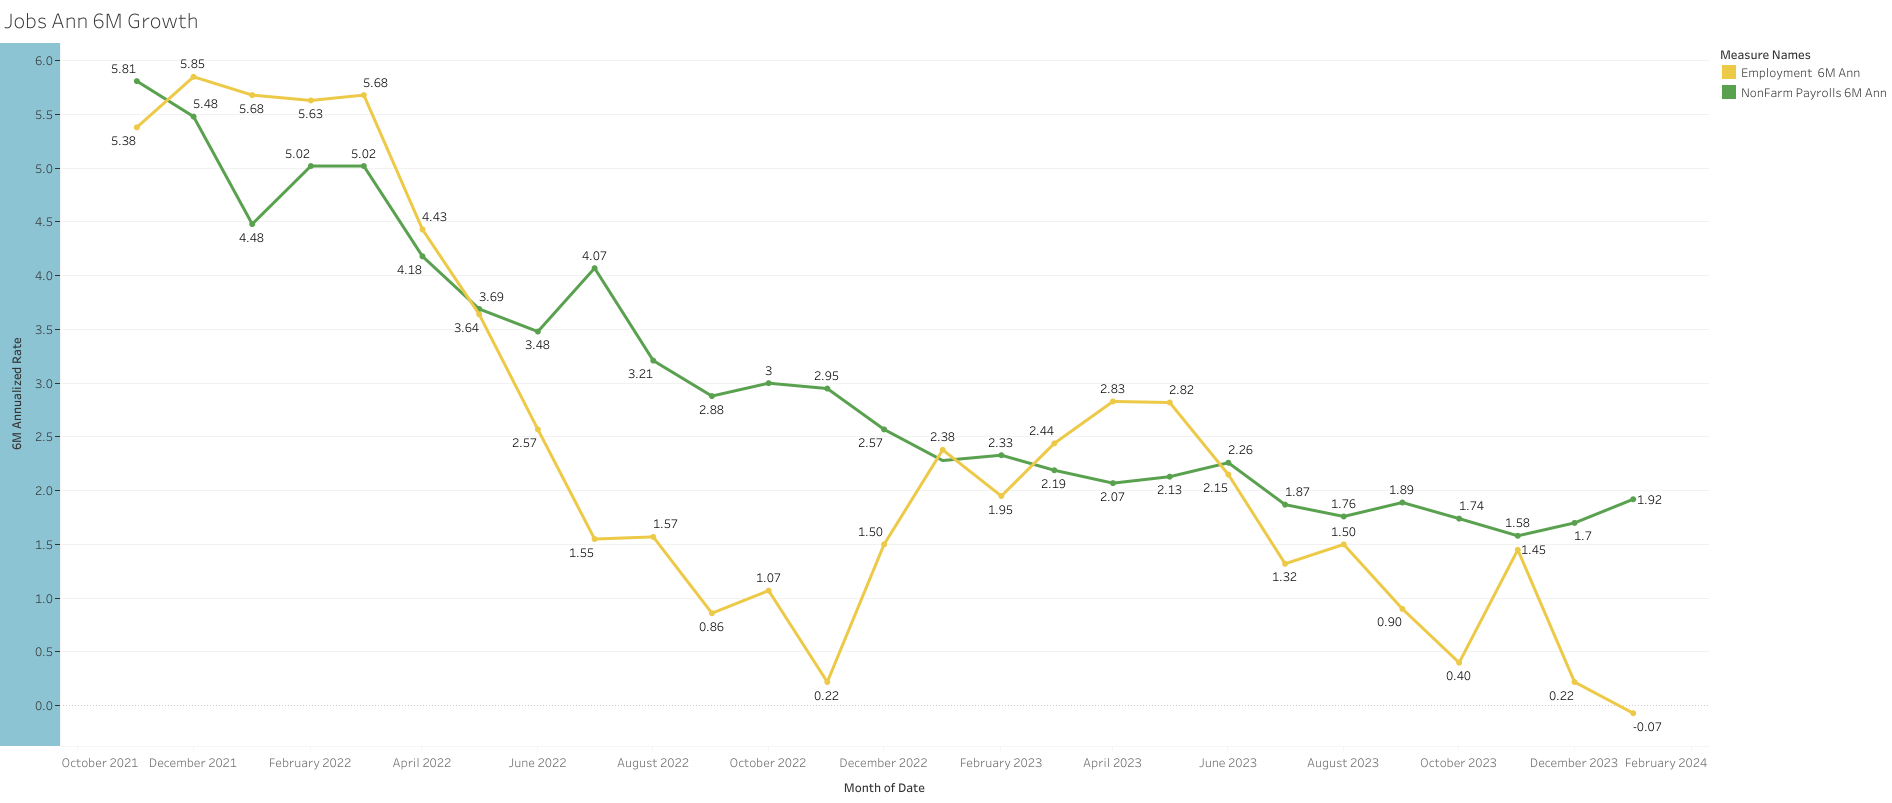
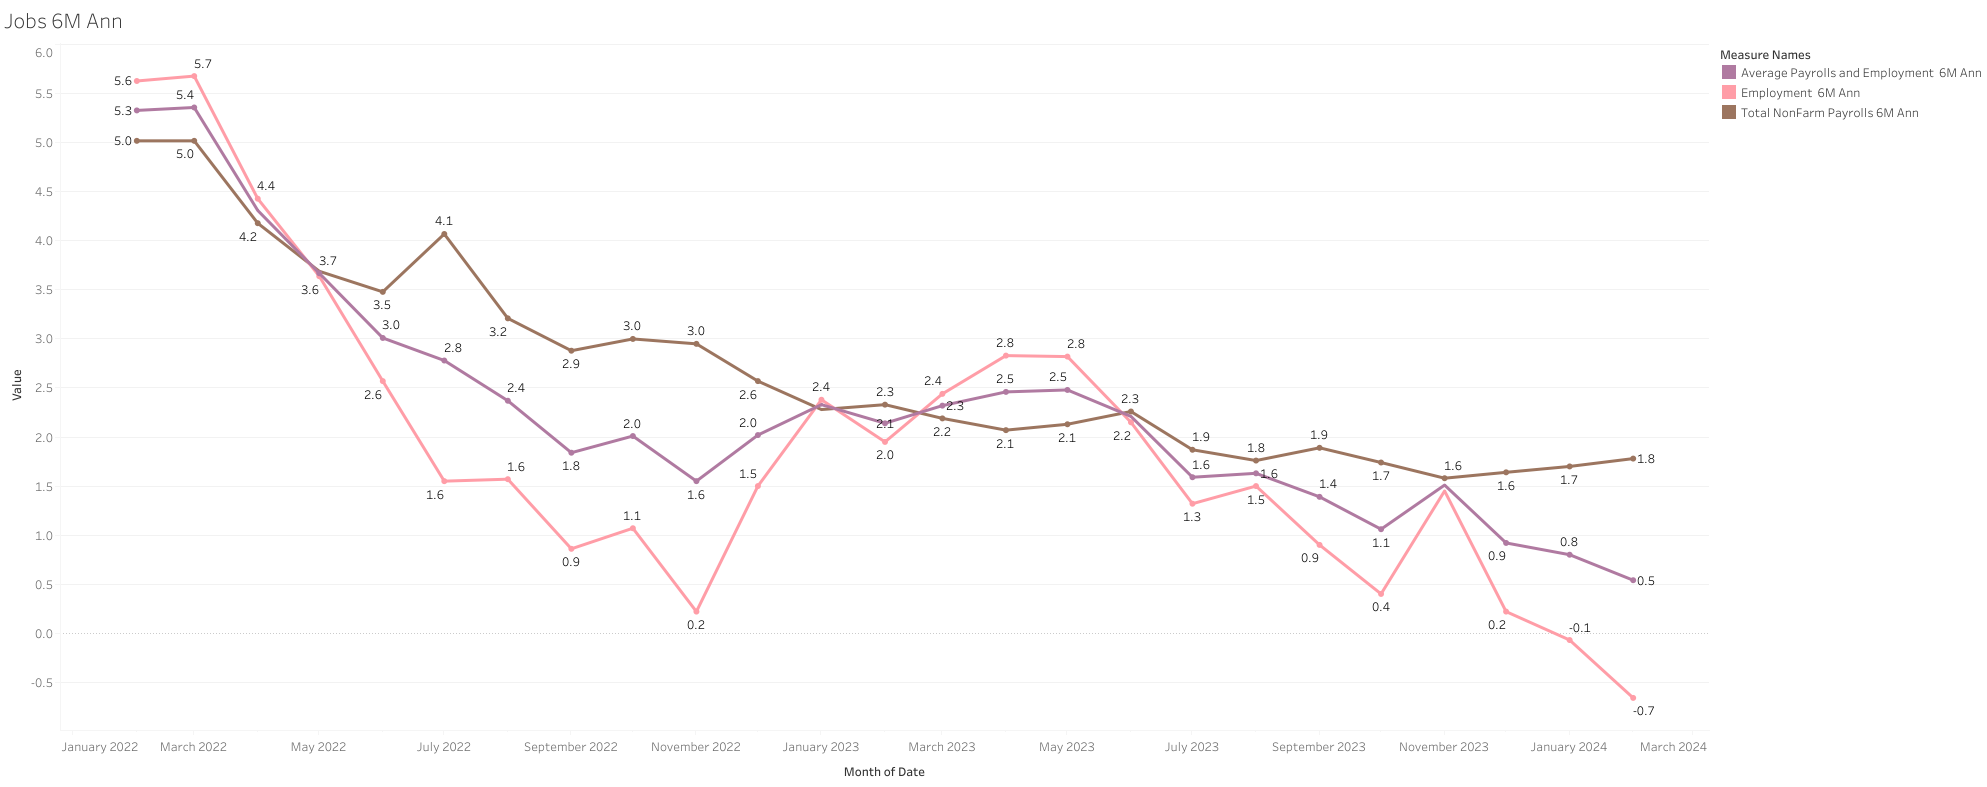
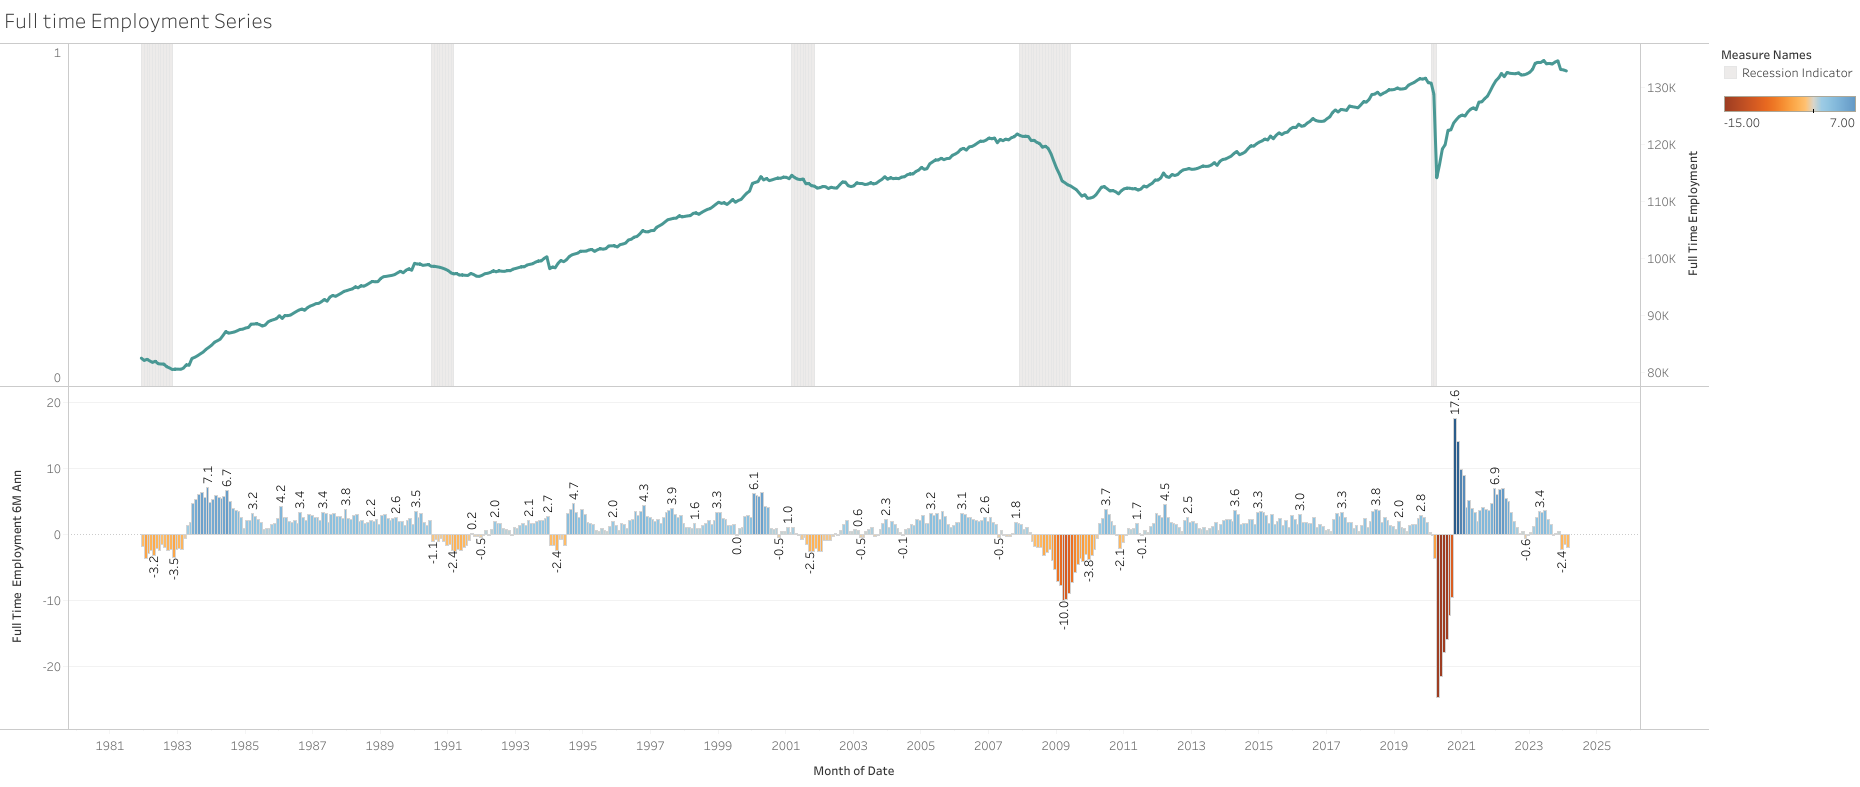
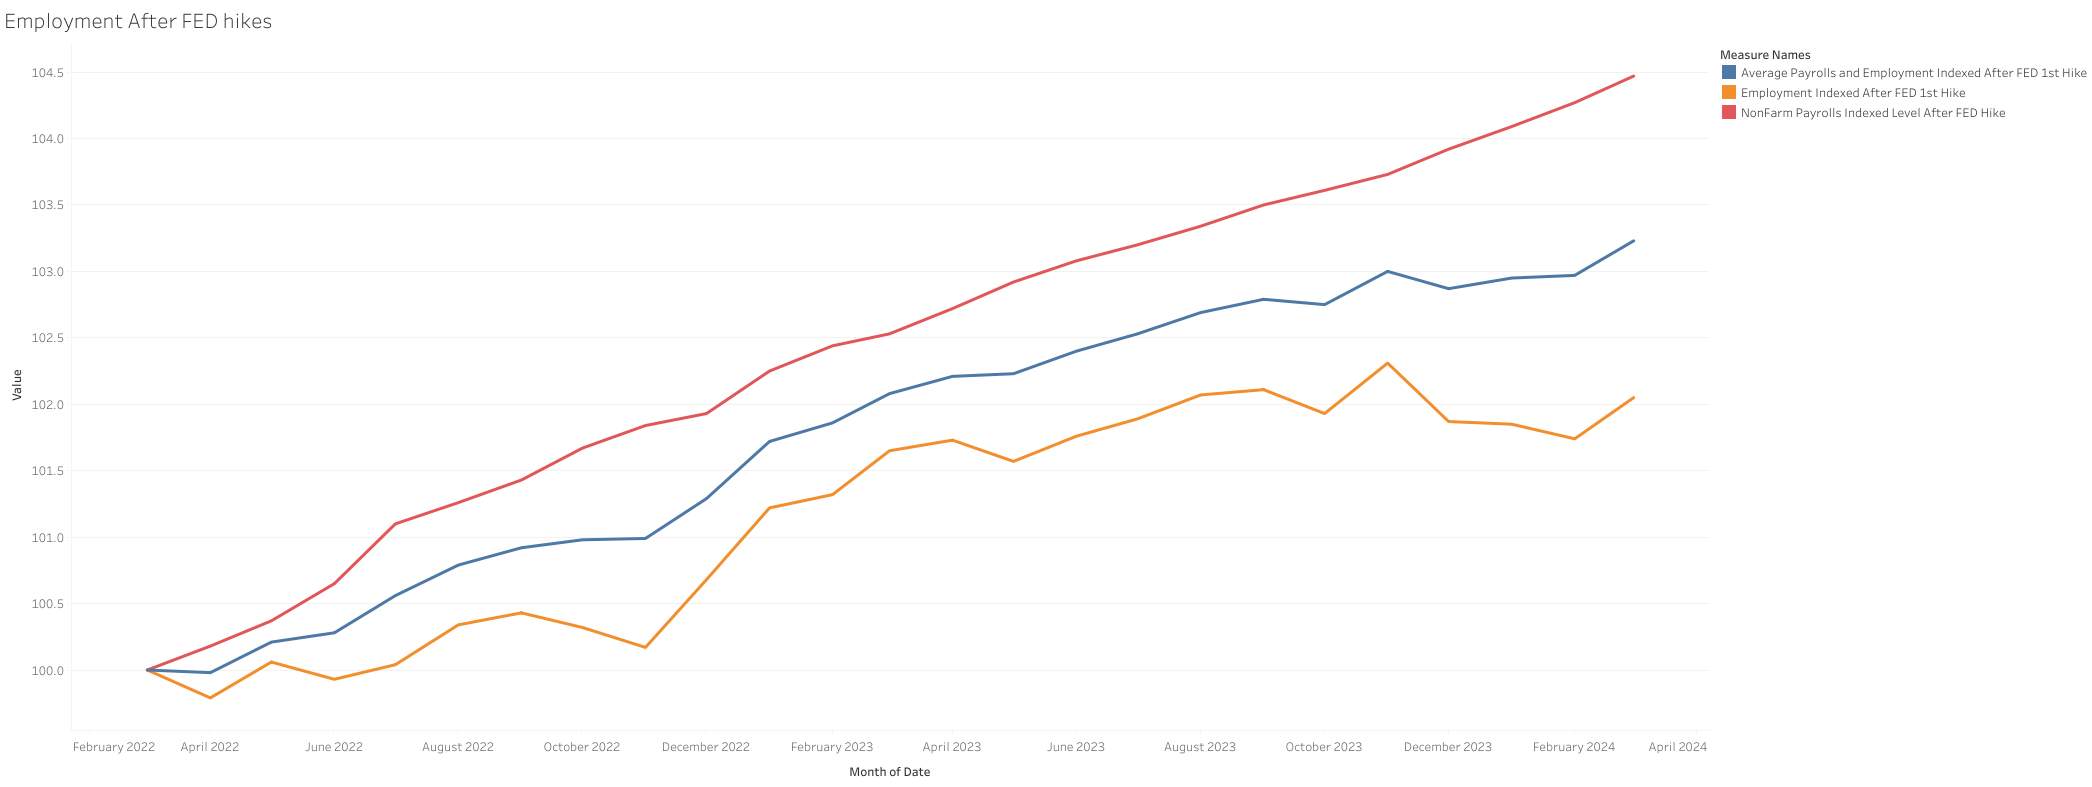
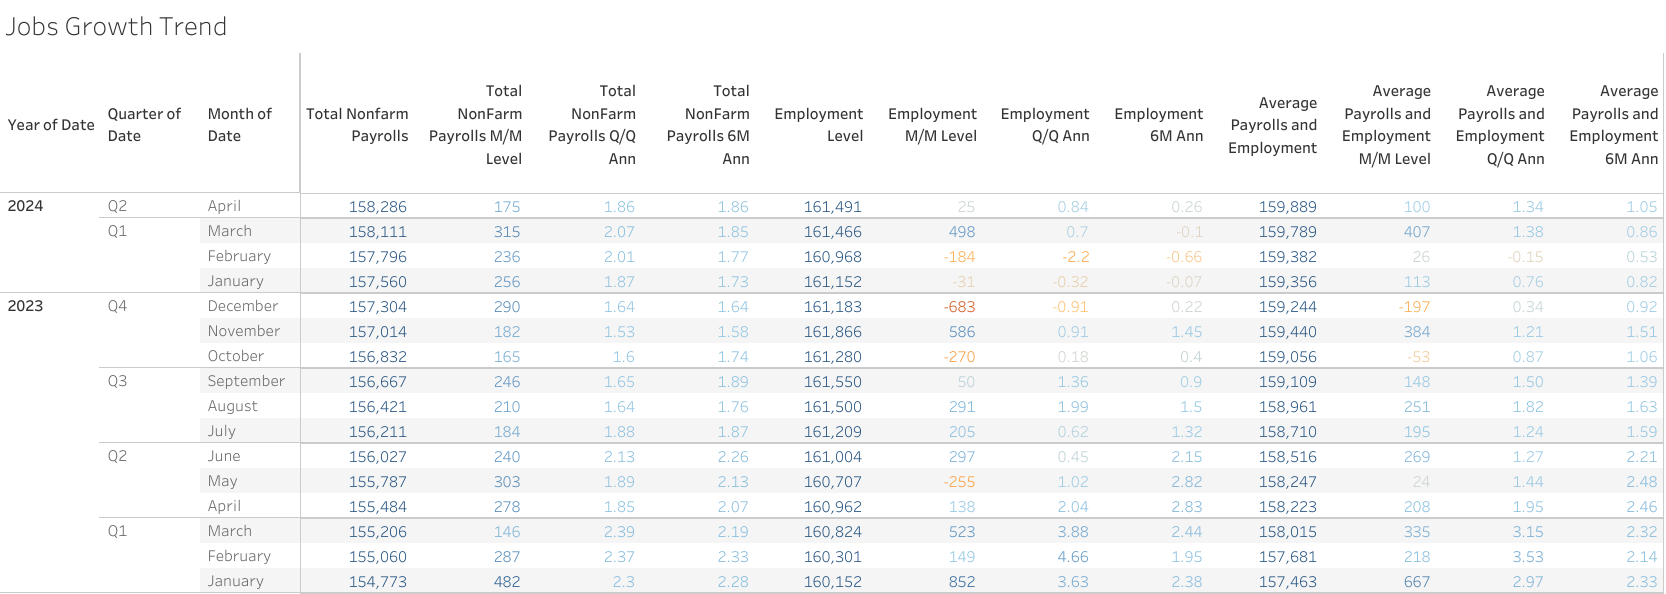
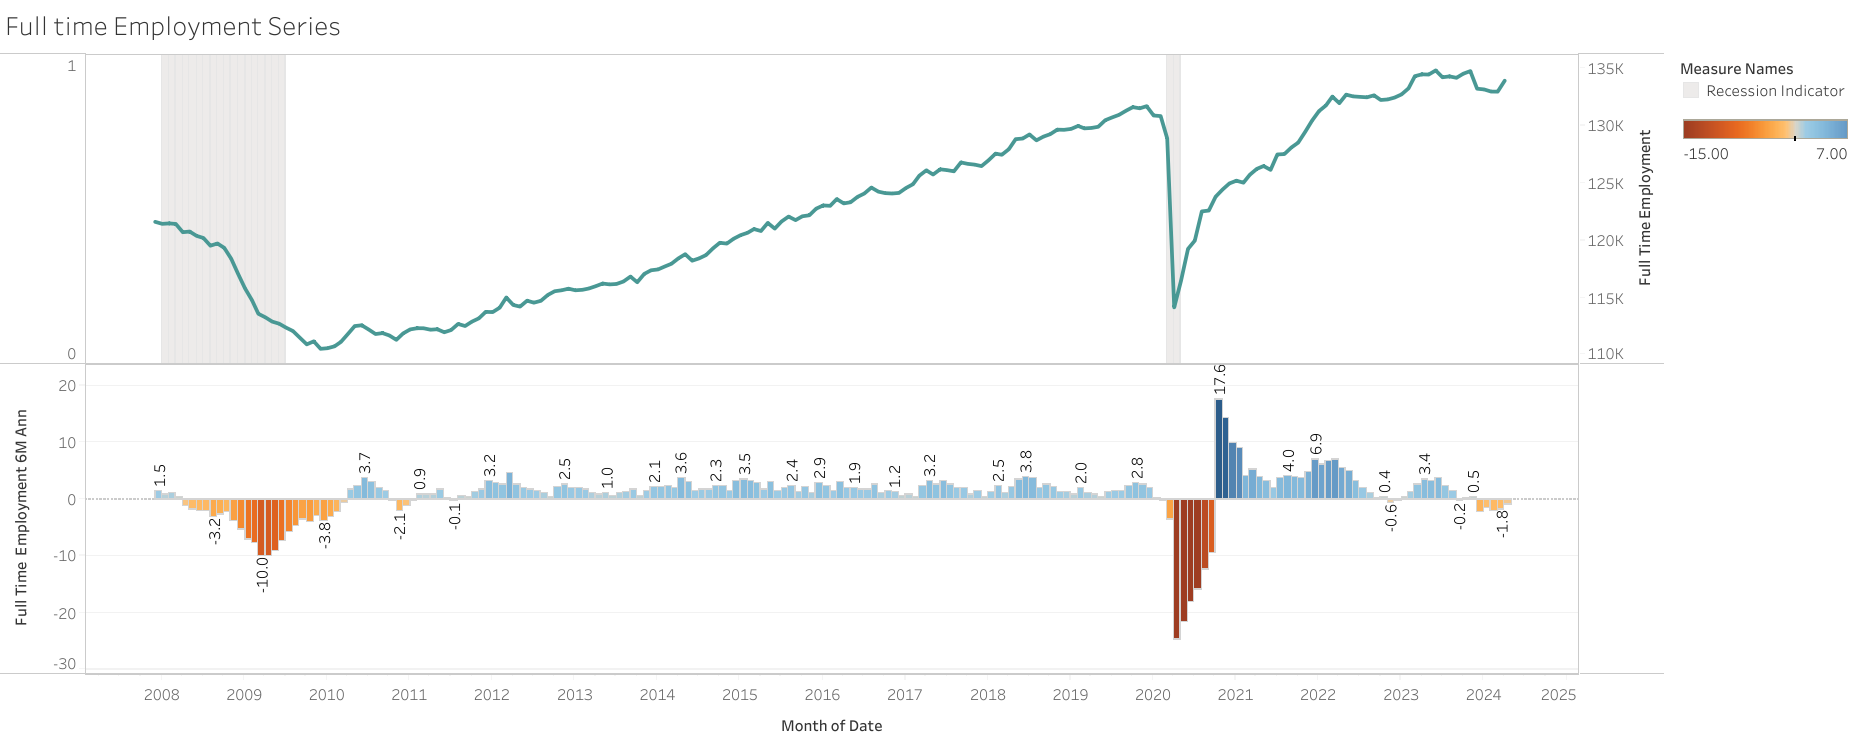
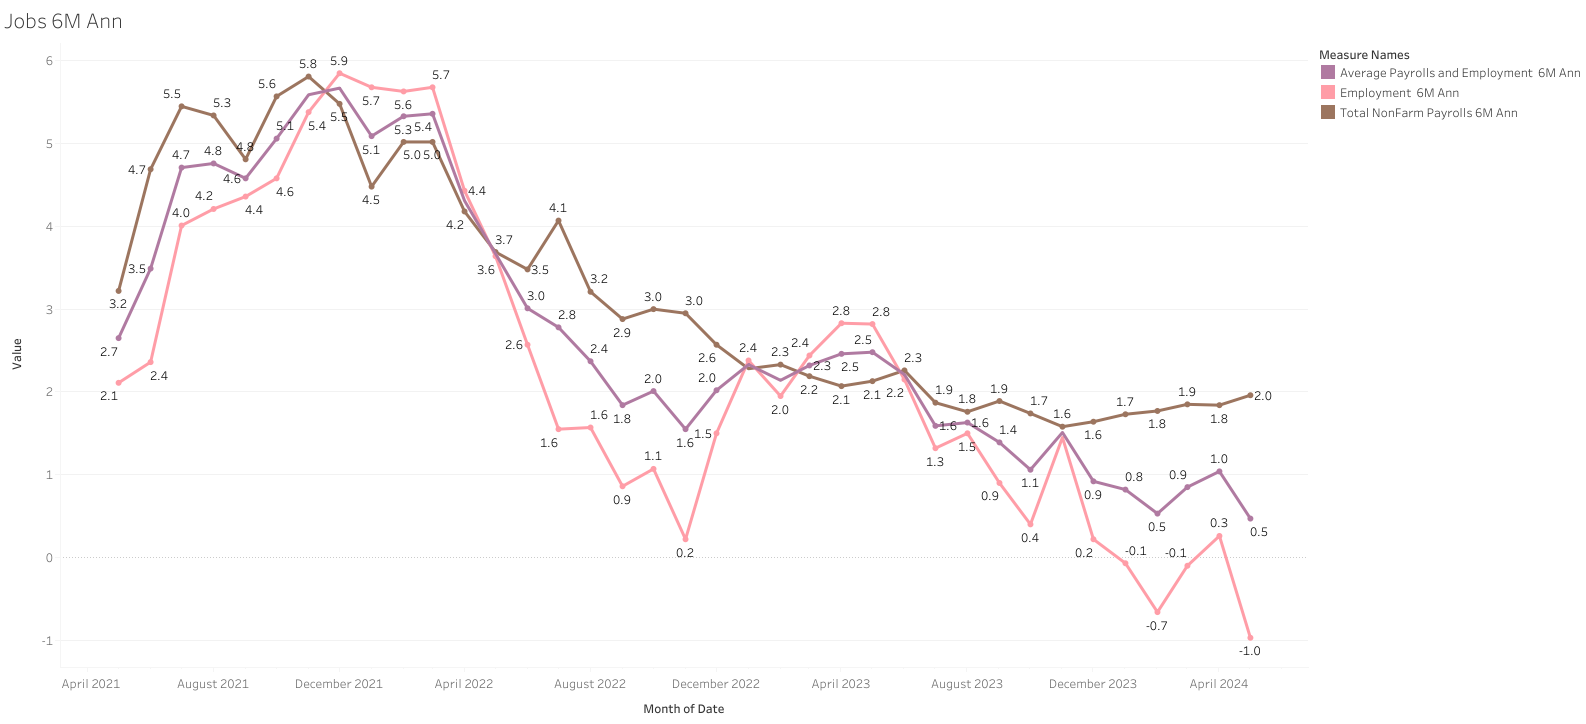
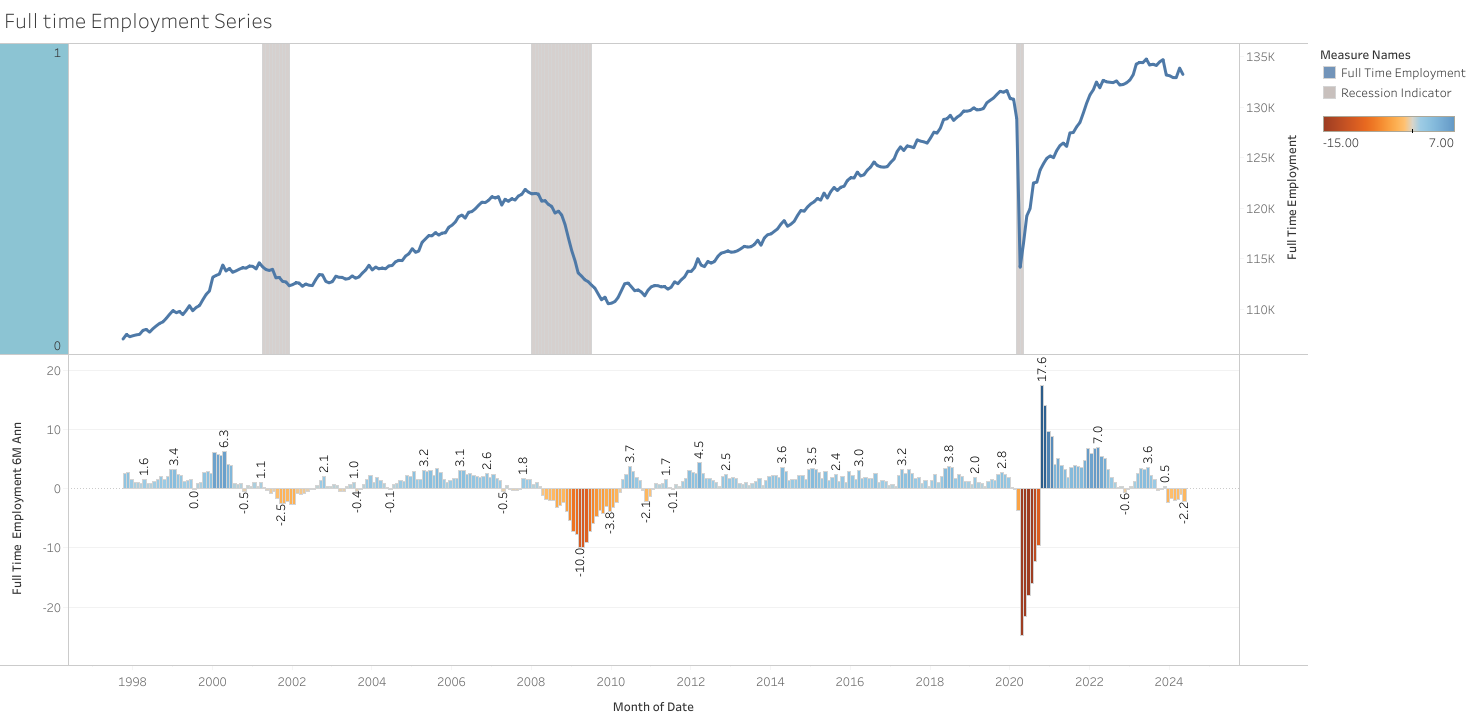
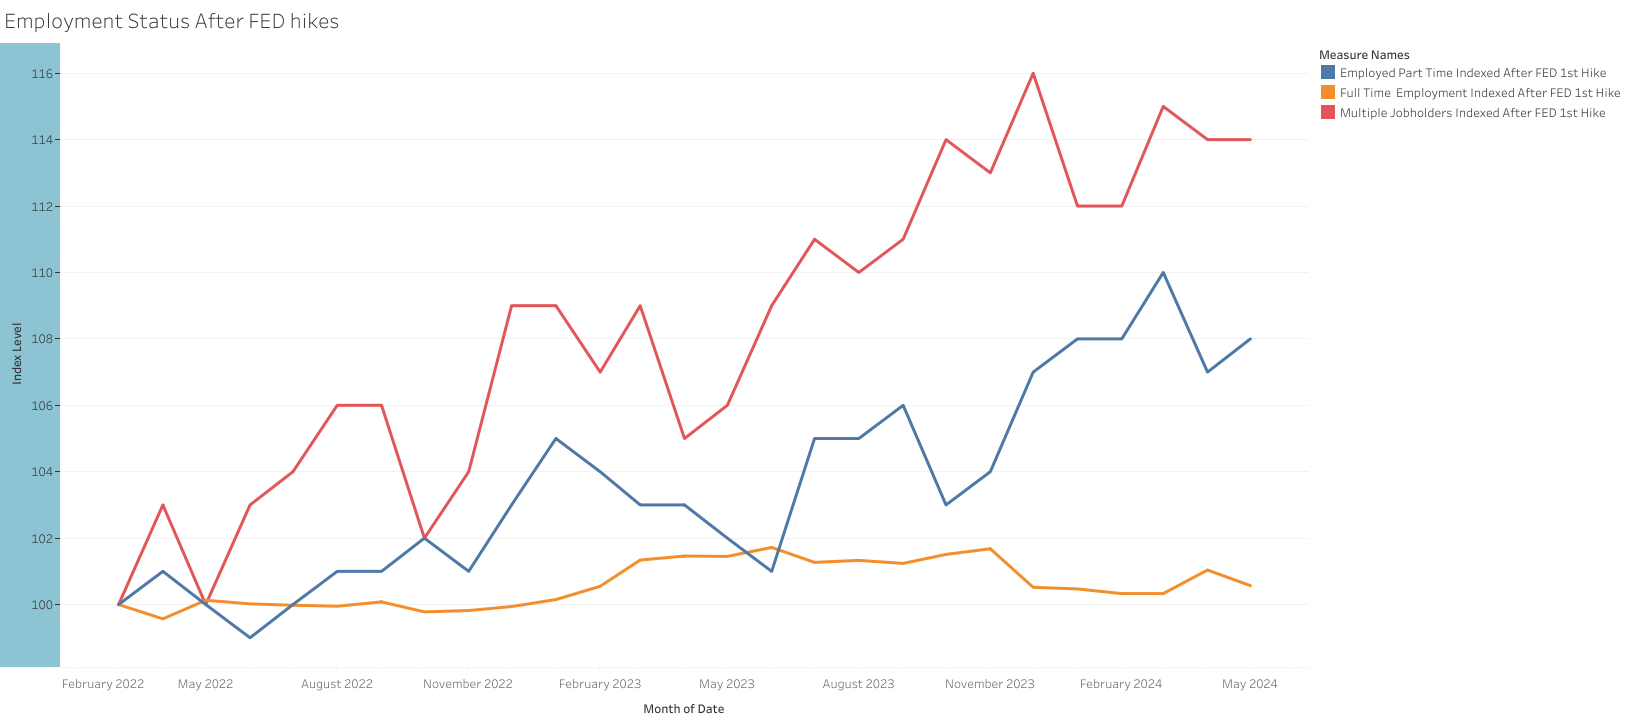
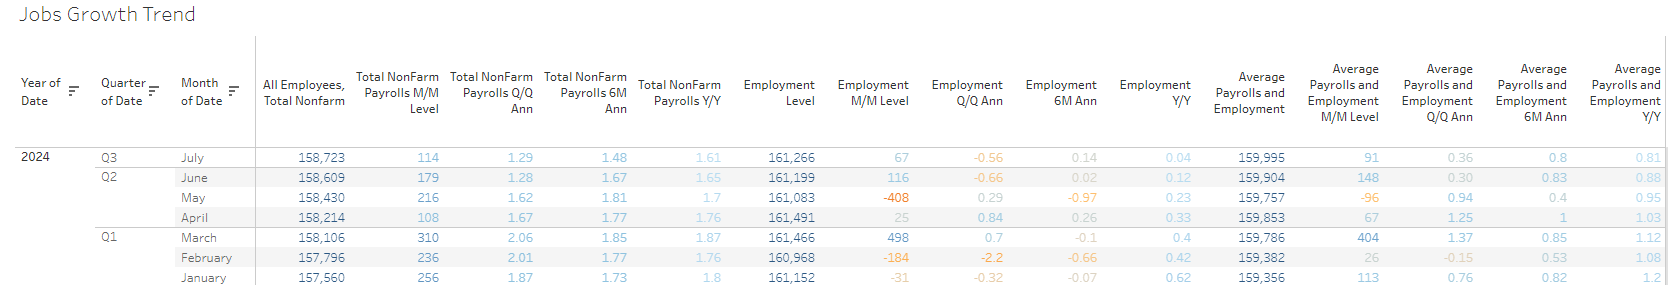
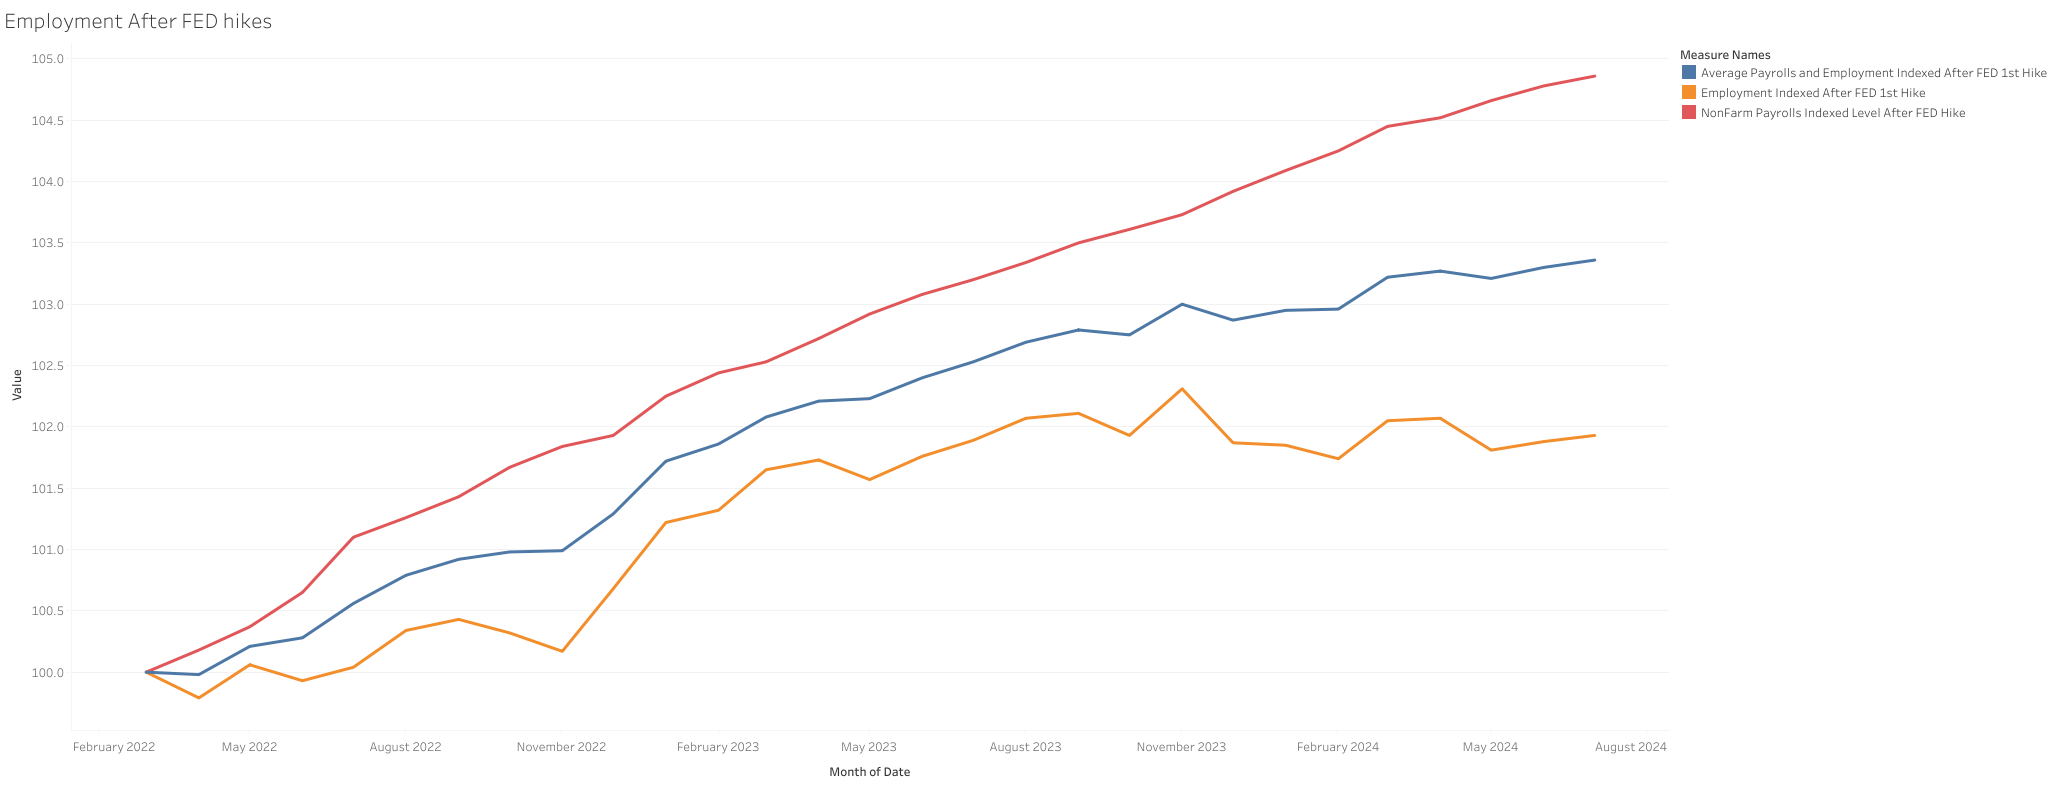
Job gains and employment continue to paint a very different picture. The main reason continues to be most likely a decline in full-time, for more part-time jobs for economic reasons.

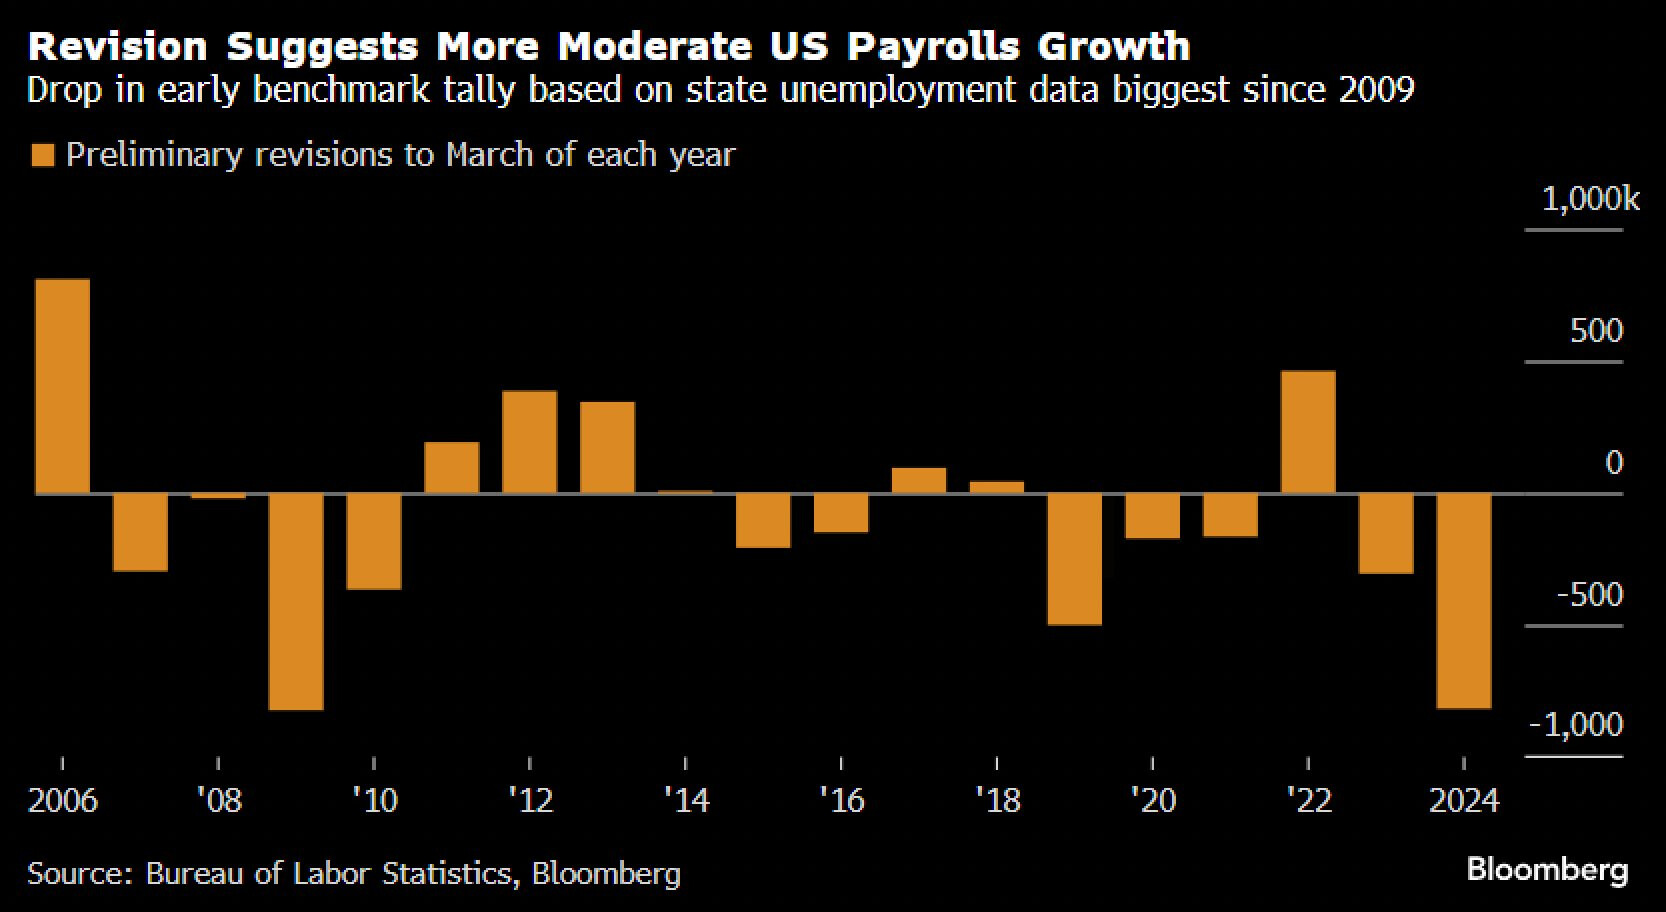
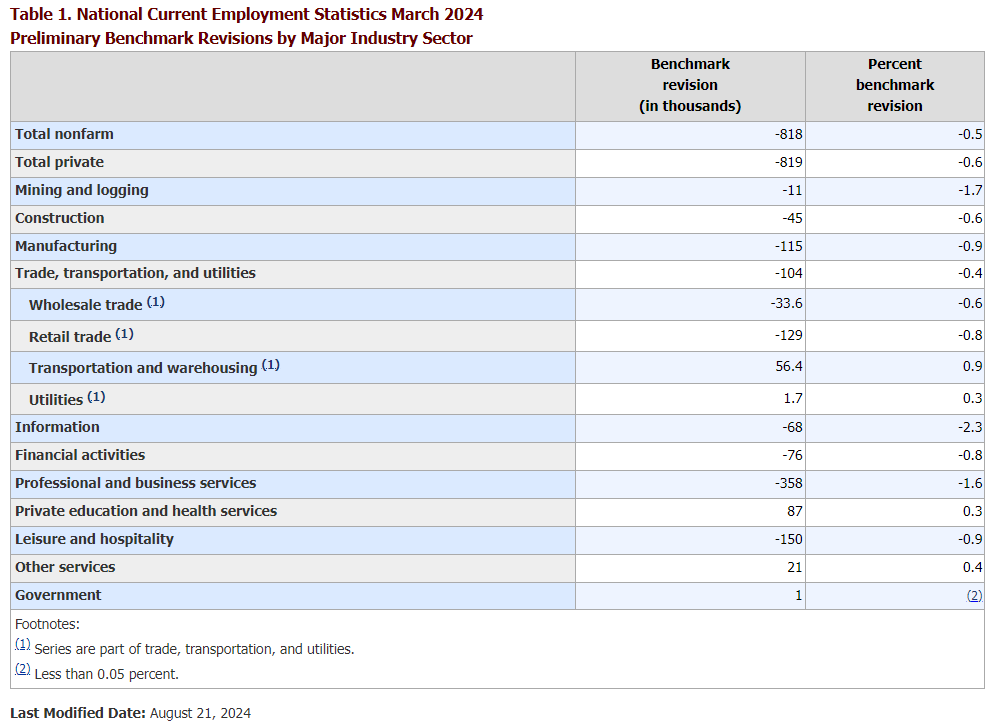
We will also get payrolls benchmark revision on August 21, 2024 to determine too if payrolls have overstated the numbers the past year or not.

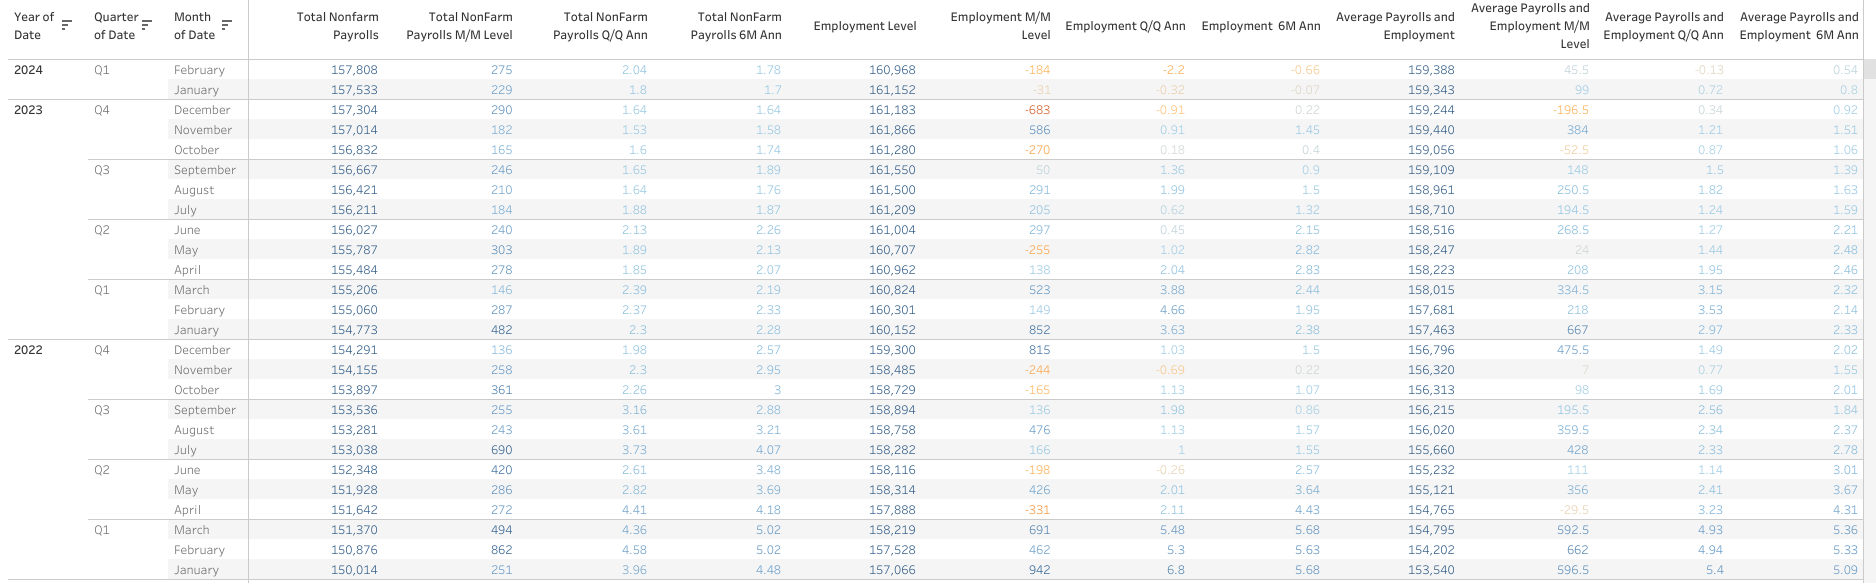
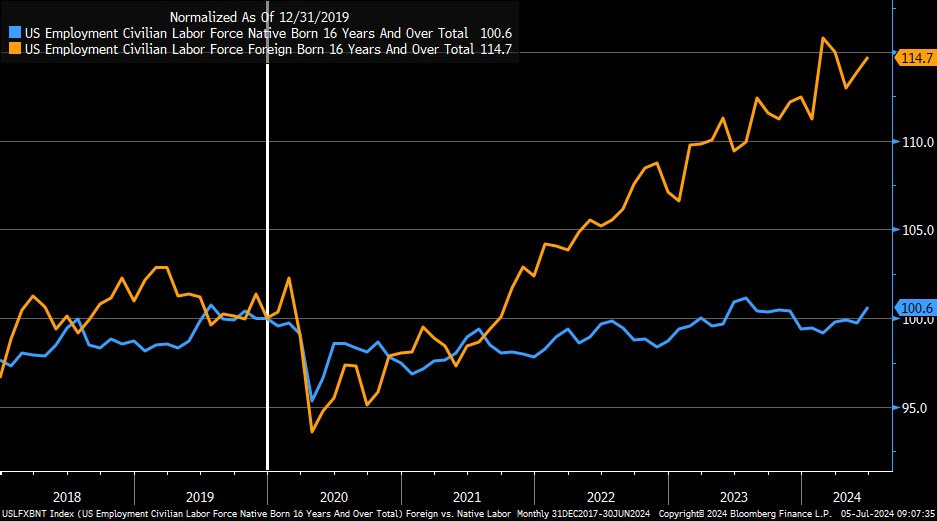
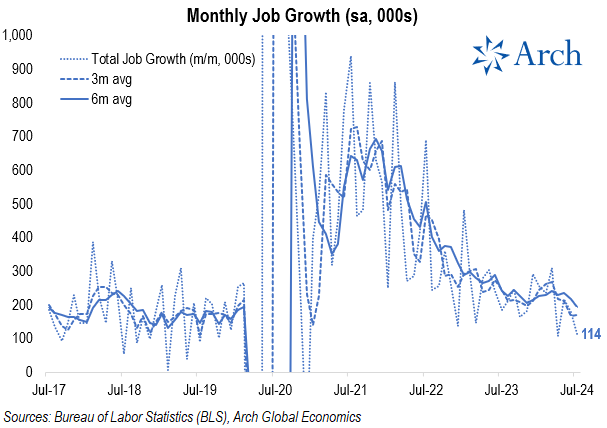
  • Payrolls have added ~2.5 million jobs in the last year, and employment has only increased by 57K, basically flat.
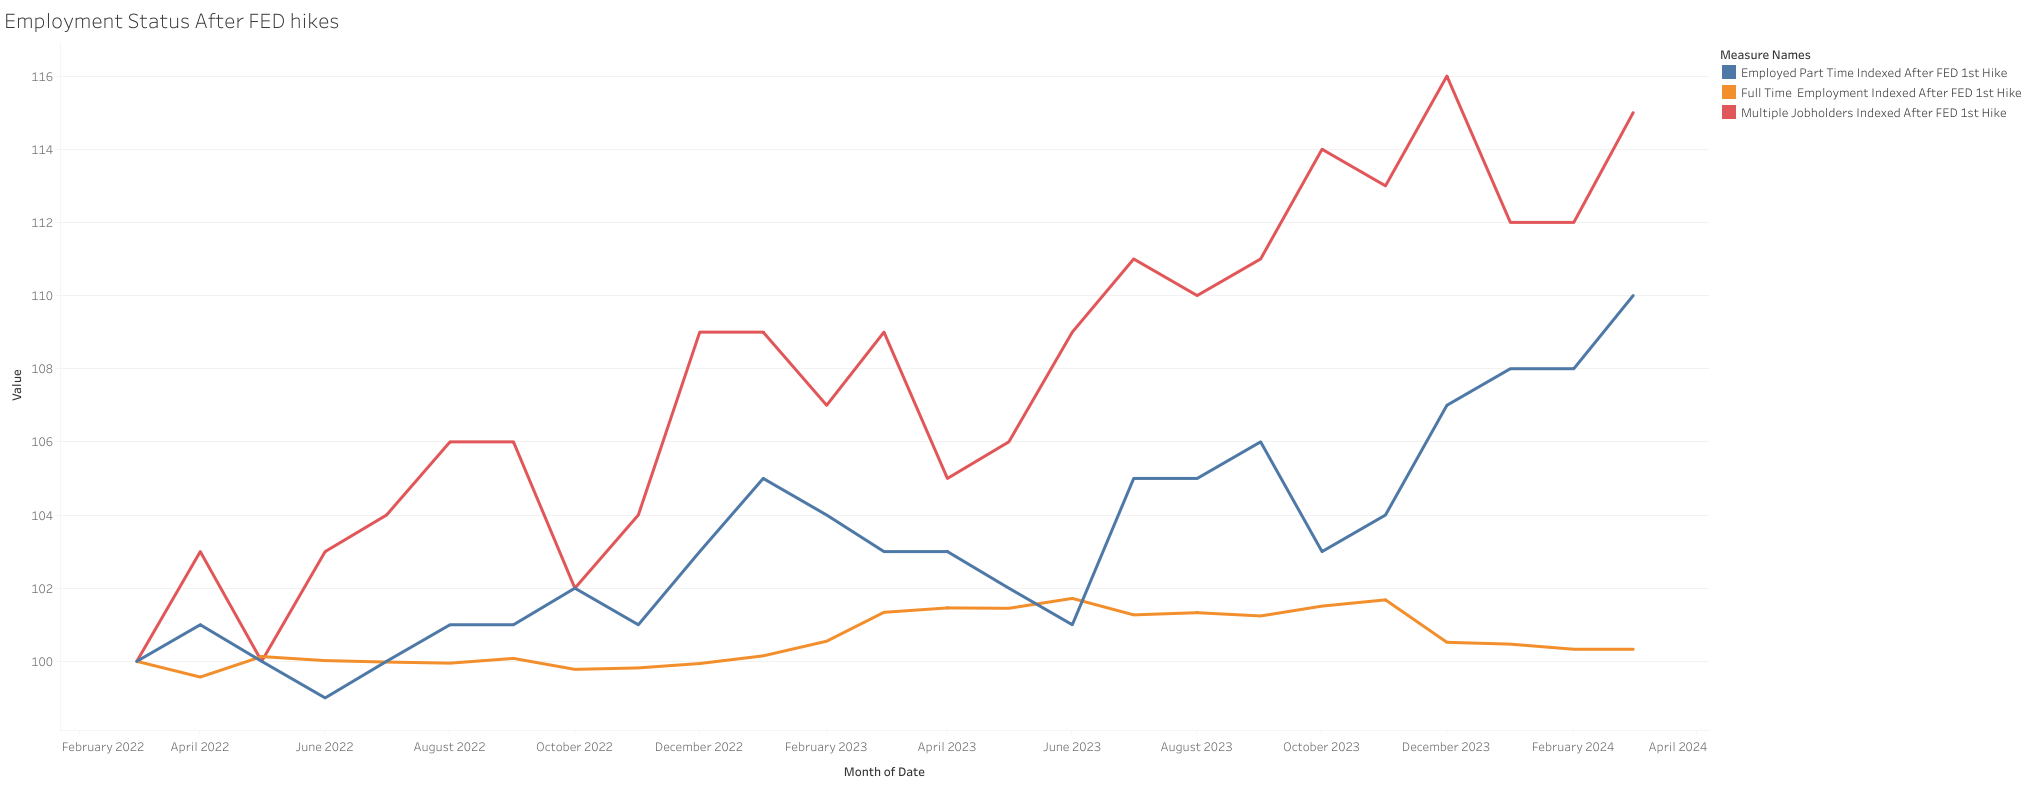
  • Full-time employment has declined by 500K in the last year. Part-time for economic reasons has increased by 558k.


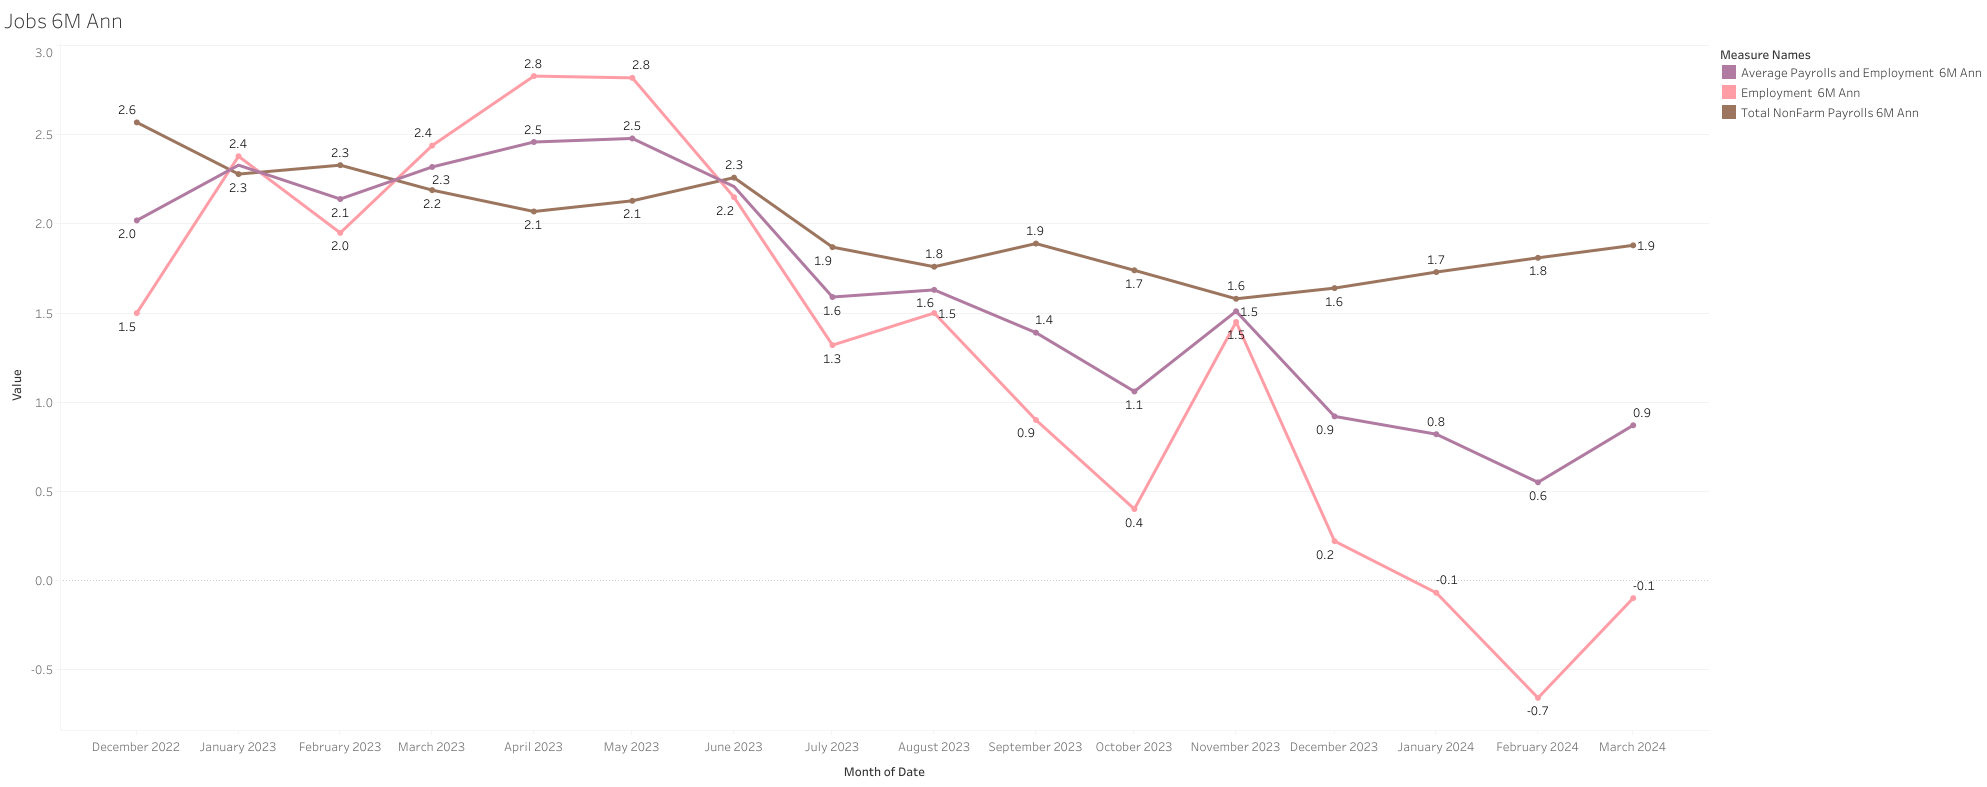
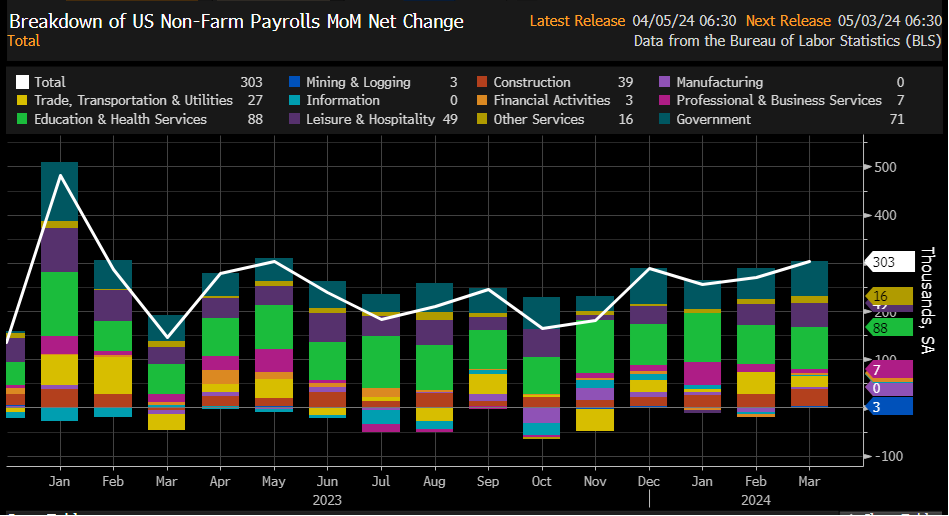
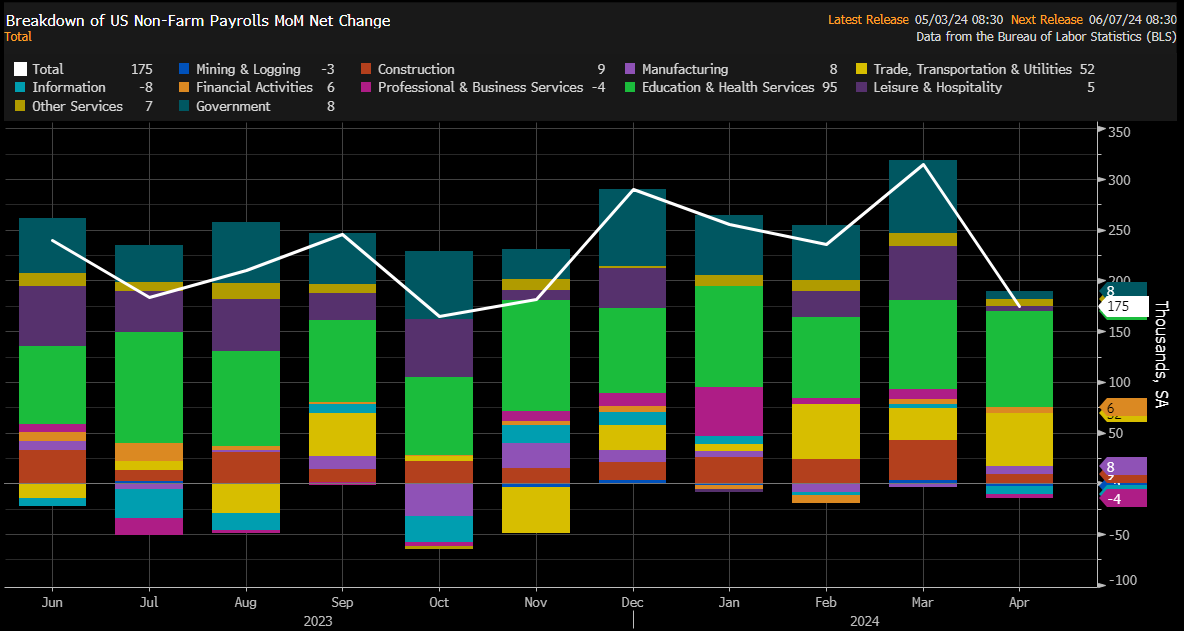
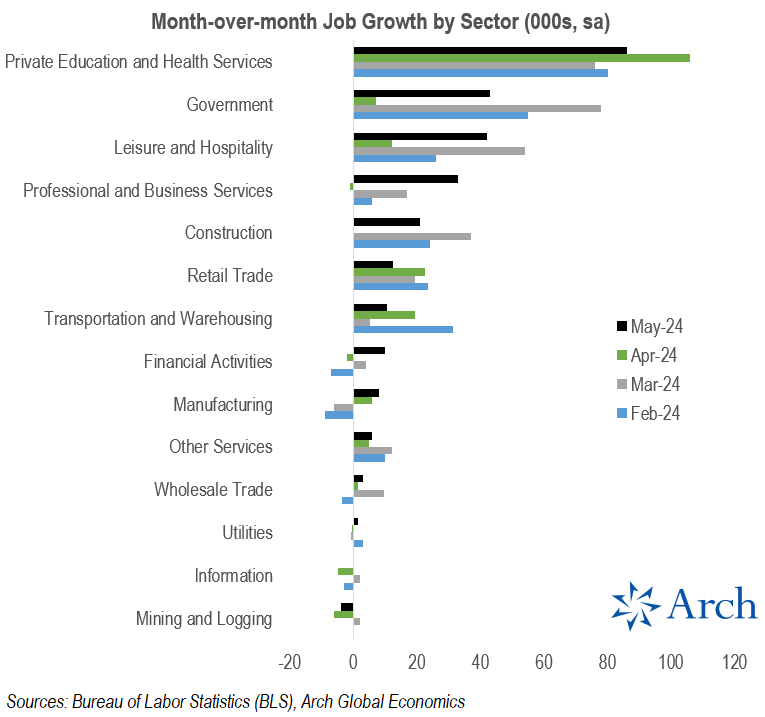
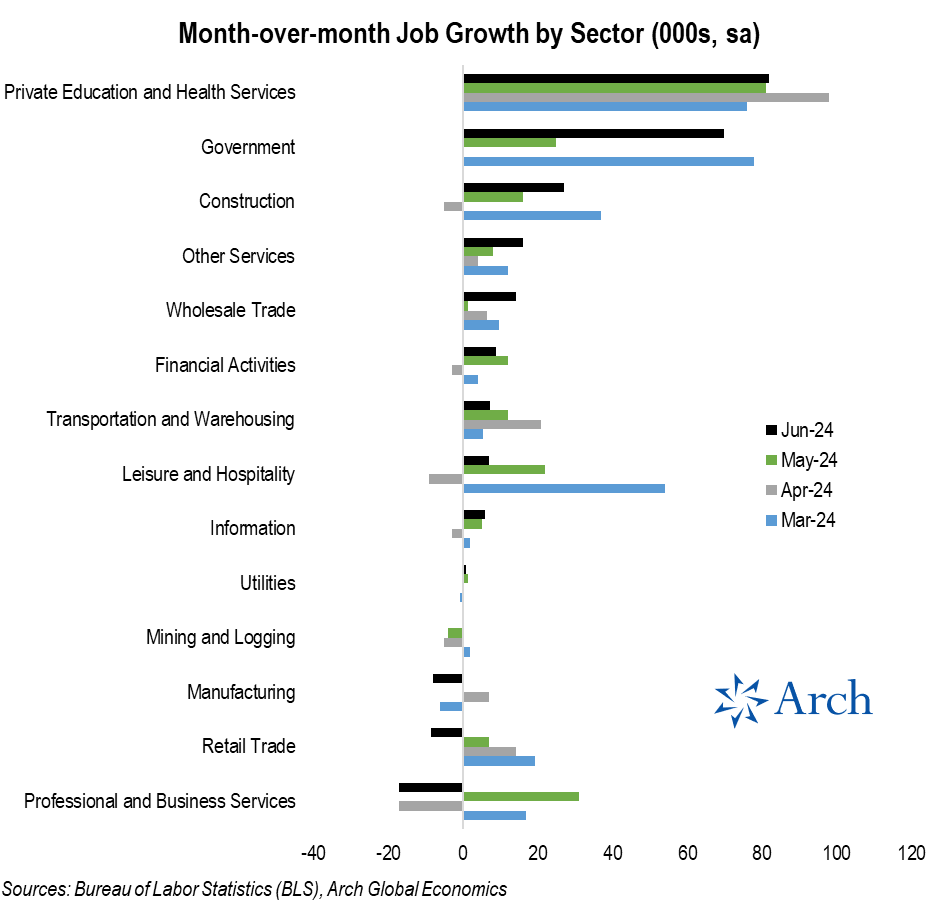
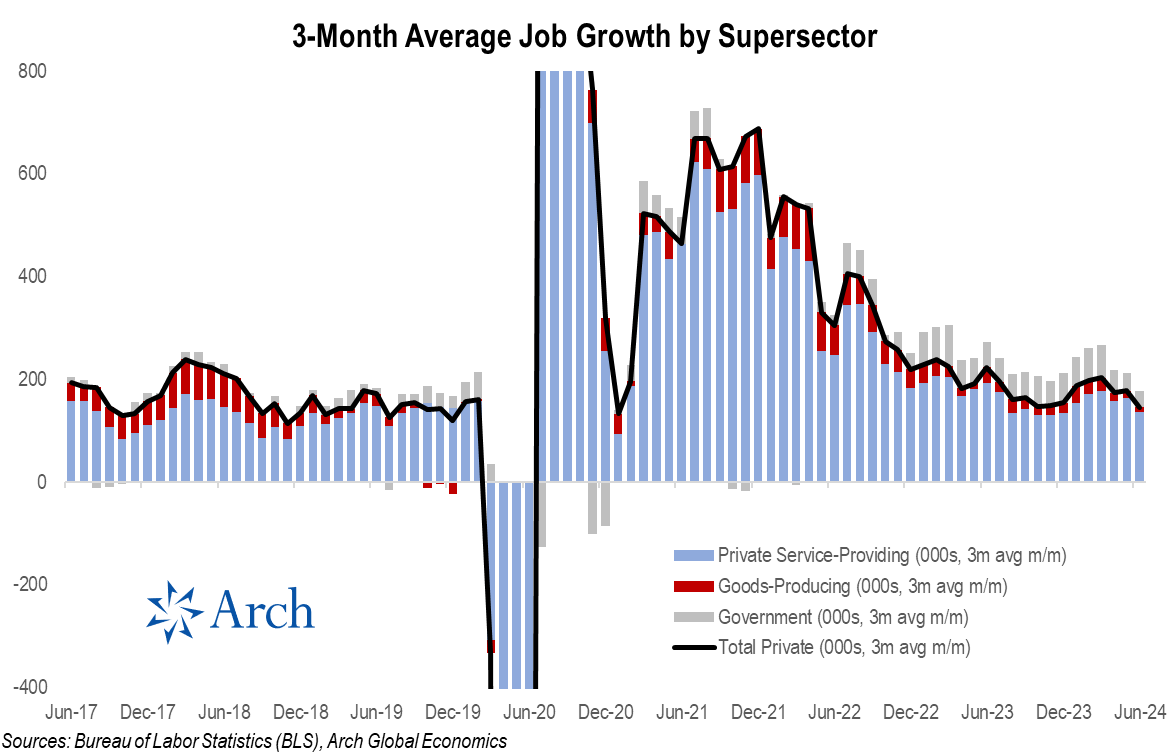
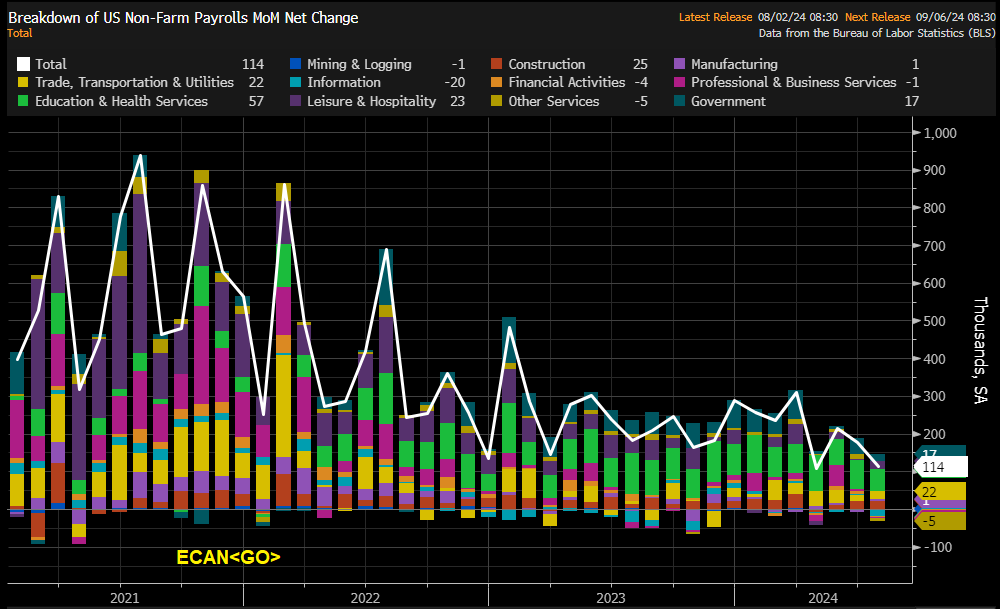
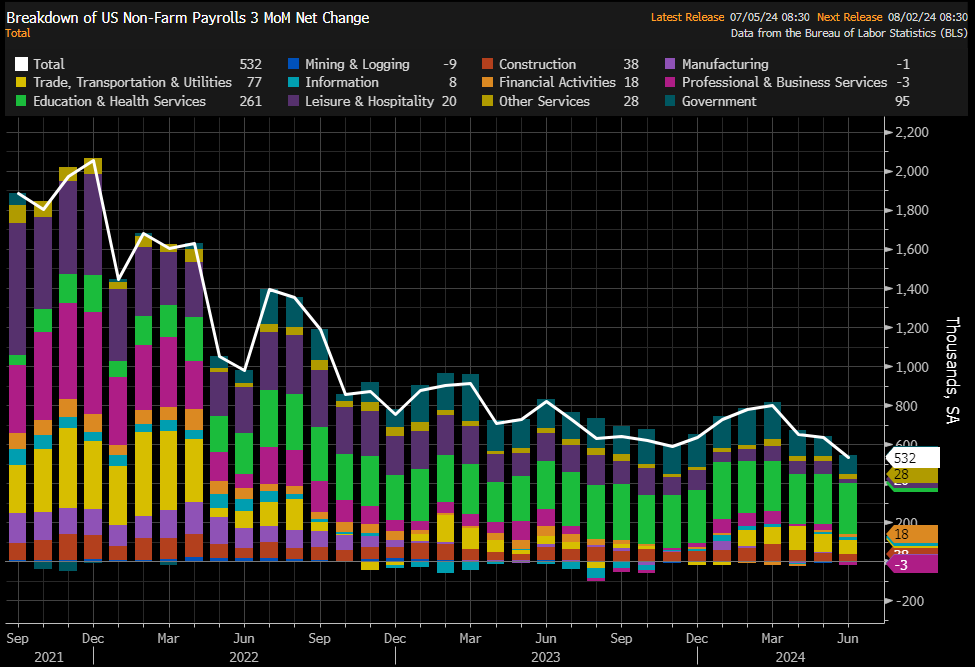
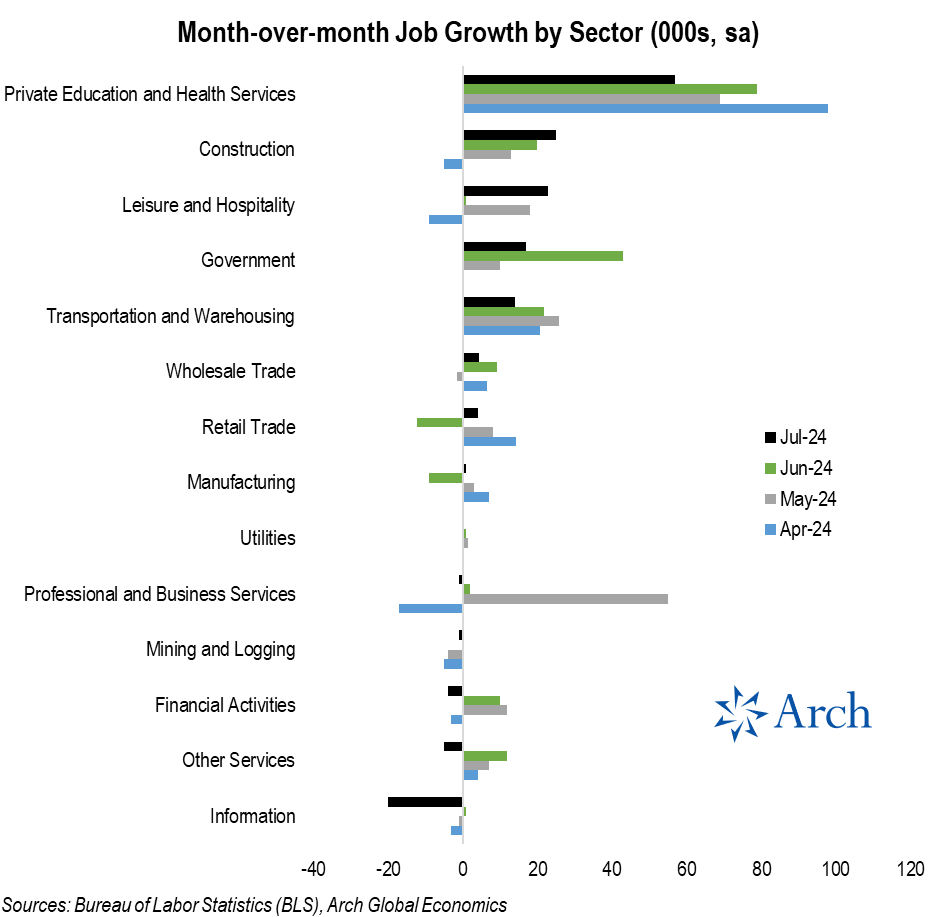
Despite this, the growth rate in the job gains has also declined significantly. And the role of government and noncyclical industries has been increasing.

image


Sources:
Data
Tableau

Payroll revisions show the US economy created 818,000 fewer jobs than reported for the year ending in March 2024

  • Around 68,000 less each month.
  • Initial payroll figures indicated employers added 2.9 million total jobs in the period, or an average of 242,000 per month. Now the monthly pace is more likely to be around 174,000. (28% less job gains)
  • Largest downward revision since 2009.
  • Revisions are on average +/-0.1%, this year they were 0.5%. These largest revisions are commonly experienced during cycle transitions (and mostly during recessions), where the BLS models fail to catch the turning points.

It is crazy to think this kind of revision could happen, is almost 1/3 of last year’s job gains (and would make a lot of the estimates beats, not applicable anymore,most April 2023 to march 2024 estimates were above 174K). This makes trusting the current data released very difficult.

This is only a preliminary revision, so it could be much worse, final estimates will be available in January 2025. The worst part is that the current free data will not be updated until then.
It seems the market was already expecting a large revision since the reaction today was muted.


https://www.bls.gov/web/empsit/cesprelbmk.htm#

2 Likes

Interesting. Many FOMC officials already thought that the payroll gains might be overstated.

1 Like

I=8
August payrolls come in at 142,000, less than expected while unemployment rate moved down to 4.2%

  • U.S payrolls increased by 142,000 in August, less than 164,000 estimate and more than 89,000 added in July (revised down from 114,000).
  • At 4.2%, unemployment rate was in line with the forecasts but lower than 4.3% in July.
  • Labor force participation rate was unchanged at 62.7%.
  • Average hourly earnings was flat in August, against expectations for a 0.3% increase and compared to -0.1% in July (revised down from 0.2%).
  • On a yearly basis, average hourly earnings was up 3.8% versus 3.7% estimate and higher than 3.6% growth in July.
  • Dow futures and S&P 500 shed 0.2% while Nasdaq 100 slipped 0.6%.

https://www.bls.gov/news.release/archives/empsit_09062024.pdf

1 Like