This topic is for discussing the nonfarm payrolls and unemployment rate in the United States. It shall be based on data from the U.S Bureau of Labor Statistics.
SI=0%, I=9
-
The U.S economy added 187,000 jobs in July, below Dow Jones estimate for 200,000 and above 185,000(downwardly revised) added in June.
-
Unemployment rate was 3.5%, below 3.6% estimate.
-
Average hourly earnings rose 0.4% m/m and 4.4% y/y, above estimate for a 0.3% m/m and 4.2% y/y increase.
-
Labor force participation rate held steady at 62.6%, for a fifth straight month.
-
The biggest job creators were health(63,000), social assistance(24,000) and financial activities(19,000).
https://www.bls.gov/news.release/pdf/empsit.pdf
US Nonfarm Payroll and Unemployment Rate - InvestmentWiki
2 Likes
Now that we were talking about being aware of revisions.
US payroll growth in the year through March may have been weaker than previously reported — to the tune of 500,000 jobs — resulting in less-robust numbers that could make the Fed think twice about further rate hikes, according to a report.
If Silver is correct, that would mean there are 40,000 fewer jobs per month over the 12-month period ended in March than the BLS originally reported.
Despite expectations that the QCEW will show weaker payroll growth figures, Silver said in his report that “the revised average monthly rate of job growth would still look strong over the year through March 2023, at around 300,000.”
The figure, Silver noted, “would be trimmed down from the 337,000 average pace currently shown in the BLS data.”
US payroll may lose 500,000 jobs in US government data revision
2 Likes
SI=2-3%, I=9
- Nonfarm payrolls increased by 187,000 in August, above 170,000 estimate and 157,000 in July(revised down from 187,000).
- Unemployment rate rose to 3.8% in August from 3.5% in July, exceeding 3.5% estimate.
- Labor force participation rate rose 0.2% to 62.8%, after being flat since March.
- Average hourly earnings rose 0.2% m/m and 4.3% y/y, below expectations for it to increase by 0.3% m/m and 4.4% y/y.
- Job growth was more pronounced in healthcare(+71,000), leisure and hospitality(+40,000), social assistance(+26,000) and construction(+22,000).
1 Like
Good numbers, esp. on labor force participation rate. Is this the reason unemployment is up? @Magaly
Yes, Is probably the biggest reason for this month. The labor market probably is not absorbing new entrants as before.
But we can’t say that all new entrants in the labor force did not find a job, and that there were no layoffs at all, because the data don’t really report this.
It would also be interesting to know why the labor force is increasing eg. immigration, demographics, people being forced to return for economic reasons, but unfortunately, data also don’t have these details.
The labor force added 736k persons, and unemployment rose by 514k persons.

I=8
- The U.S economy added 336,000 jobs in September, up from 227,000 in August (revised up from 187,000) and more than 170,000 estimate.
- Unemployment rate was unchanged from August at 3.8% and above 3.7% estimate.
- Average hourly earnings rose 0.2%, lower than 0.3% estimate.
- Labor force participation rate was steady at 62.8%.
- Job gains were led by leisure and hospitality (+96,000), government (+73,000), health care (41,000) and professional, scientific and technical services (29,000).
2 Likes
I=9
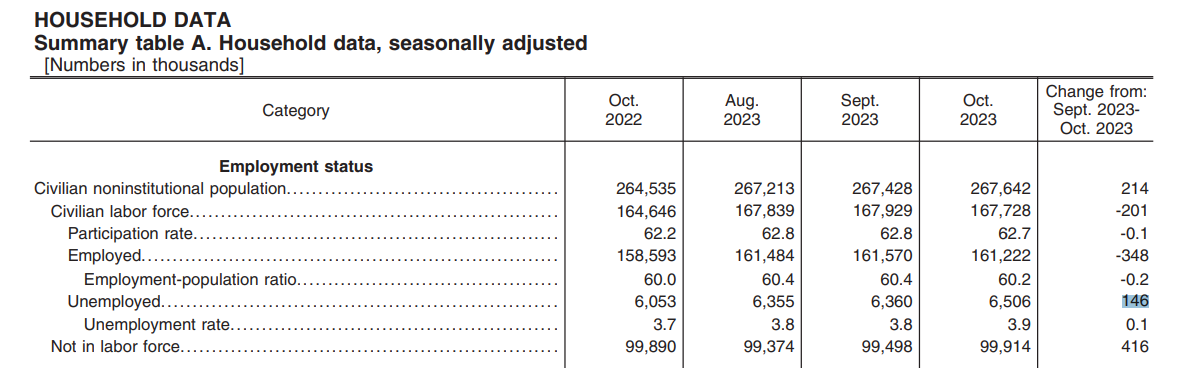
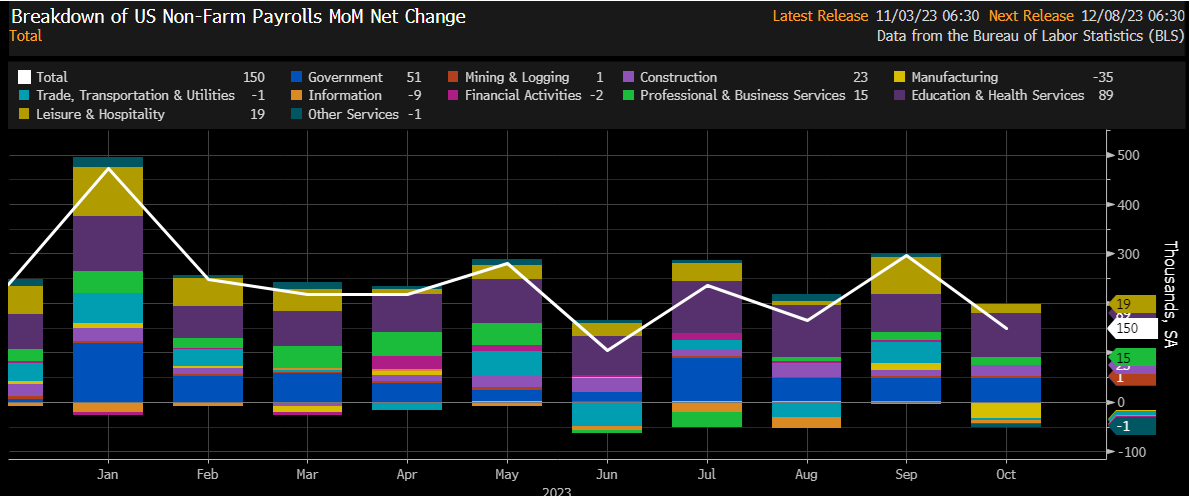
- U.S economy added 150,000 jobs in October, up from 297,000 in August (revised down from 336,000) and lower than 180,000 estimate.
- Unemployment rate was 3.9%, highest level since January 2022 and above 3.8% estimate.
- Average hourly earnings rose 0.2%, lower than 0.3% estimate.
- Labor force participation rate was at 62.7%, lower than 62.8% estimate.
- Job gains were led by healthcare (+58,000), government (+51,000), construction(23,000) and social assistance (19,000).
1 Like
Not only weakness in payrolls missing, and down revisions to the prior month. But the Household survey employment decreasing by -348k, is an indication that a lot of jobs added could be just part-time or multiple job holders, which is not exactly a good economic sign.
And since labor force participation was down, the unemployment increase was layoffs this time, different from the previous increase.
Leading sectors like manufacturing, had 1 of the highest declines in jobs since 2020.
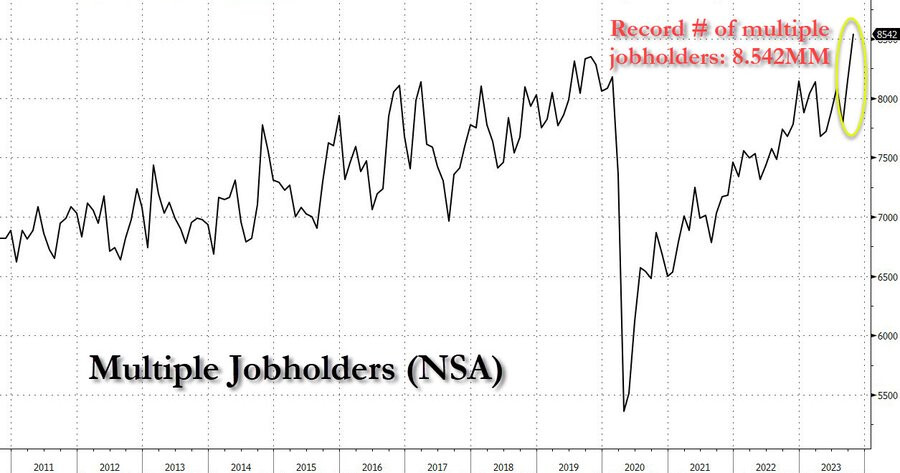
https://twitter.com/zerohedge/status/1720436514348318997/photo/1
2 Likes
I=8
- U.S nonfarm payrolls rose 199,000 in November, below 185,000 Bloomberg estimate and above 150,000 gain in October.
- Unemployment fell to 3.7% versus 3.9% estimate.
- Average hourly earnings rose 0.4% on the month, lower than the 0.3% estimate.
- Yearly, average hourly earnings rose 4%, in-line with the estimate.
- Labor force participation rate rose to 62.8% from 62.7% in October.
- The return of striking workers boosted the non-farm payrolls by 30,000, according to Bloomberg.
- Job gains were led by healthcare (+77,000), government (+49,000), manufacturing (28,000) leisure and hospitality (40,000).
2 Likes
October and November reports were distorted a lot for those striking workers, probably next month report will be more clean. But overall labor market continues to cool, but at a stable pace.
Interesting that the majority of jobs are now coming from noncyclical industries.
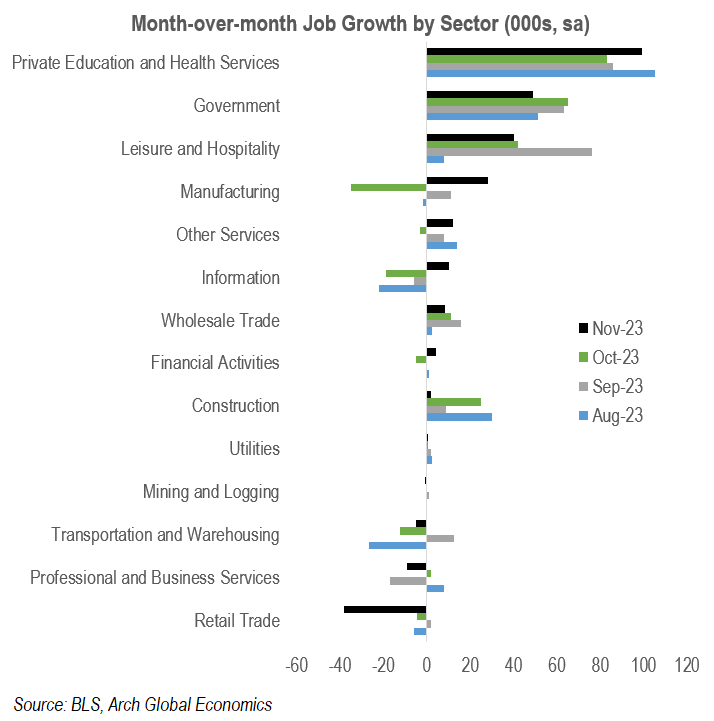
https://twitter.com/Econ_Parker/status/1733125319698051497/photo/1
2 Likes
I=8
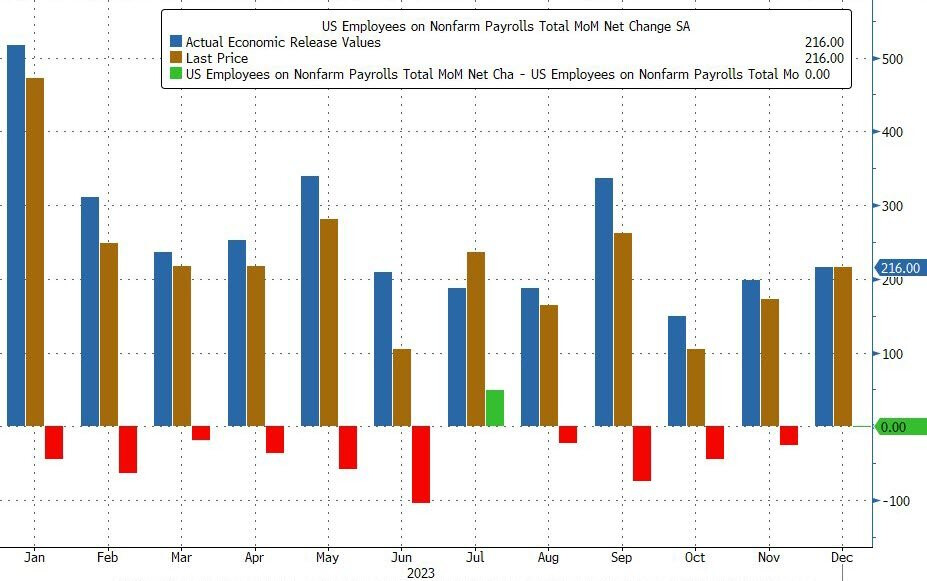
- Nonfarm payrolls increased by 216,000 in December, exceeding November’s 173,000 (revised down from 199,000) and 170,000 estimate.
- Unemployment rate held steady at 3.7%, lower than 3.8% estimate.
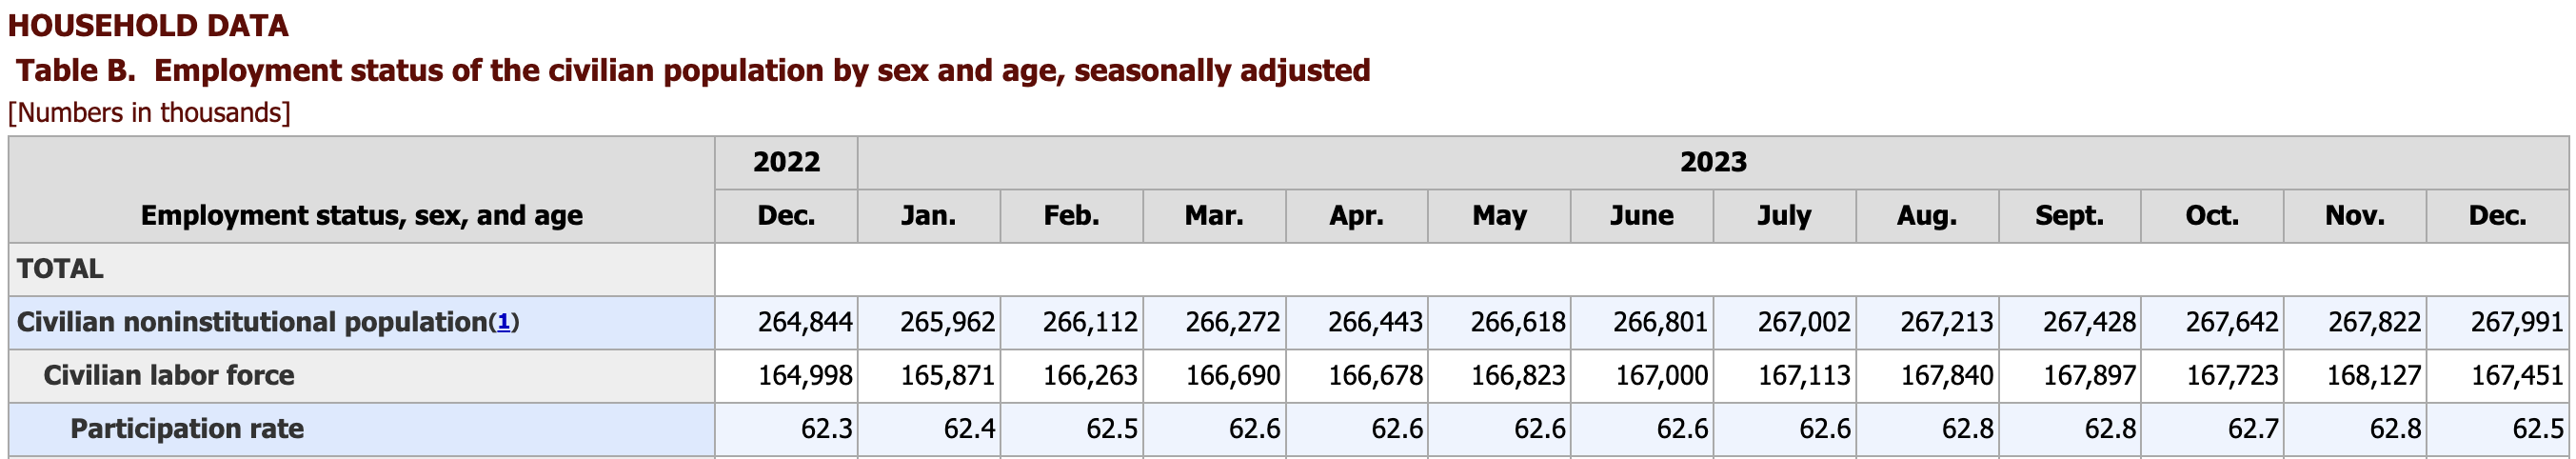
- Labor force participation rate fell to 62.5% from 62.8% in November, below expectations to be flat.
- Average hourly earnings rose 0.4% on the month, higher than the 0.3% estimate (+0.4% previously).
- Yearly, average hourly earnings rose 4.1%, higher than 3.9% estimate (+4.0% previously).
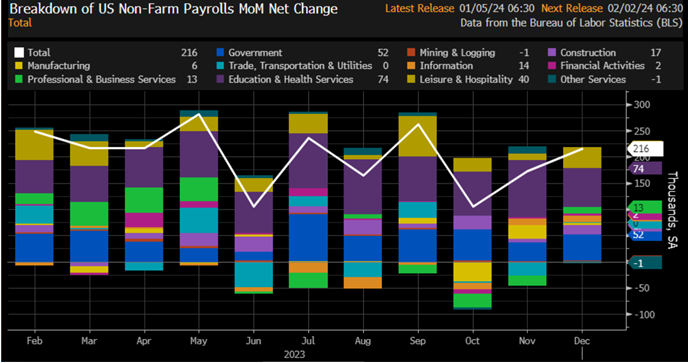
- Job gains were led by government (+52,000), healthcare (+38,000), leisure and hospitality (+40,000), social assistance (+21,000) and construction (+17,000).
2 Likes
With the amount of revisions lately one cant really trust the 1st official numbers. Messy.
10 of the last 11 months have seen downward revisions in their jobs number, according to Zerohedge.
-
The November 2023 jobs number was revised lower, from 199,000 to 173,000. This means that the November jobs report actually missed expectations of 180,000.
-
The October jobs report was also revised lower from 150,000 to 105,000. This means that the October jobs report was an even bigger miss than expected.
-
For September, the jobs number was revised lower by 74,000 jobs.
https://twitter.com/KobeissiLetter/status/1743268608157876613/photo/1
2 Likes
@Magaly Do you have any idea why the labor force participation rate dropped so much?
1 Like
The latest numbers in labor markets combined show that it is still holding ok, but the growth rate is slowing.
We always have to take into account that employment is more of a lagging indicator.
Some warning signs underneath the numbers:
- The participation rate declined unexpectedly.
- Wages are surprising to the upside still.
- Full-time jobs declined 1.5m, and instead part-time increased 762k, and multiple job holders increased by 222k to record highs.
- Temporary workers which is 1 of the first to be let go, declined 33k in December, and 206k in the last year.


https://www.bls.gov/news.release/empsit.t09.htm
https://twitter.com/EPBResearch/status/1743280537597333647/photo/1
Most jobs came from education and health care, and governments. Sectors that are not cyclical. But increase is broad base.
https://twitter.com/KathyJones/status/1743266248908046549/photo/1
2 Likes
Not reason was given for this. We can only speculate that it could be due to a combination of retirements and discouraged workers who are finding it more difficult to find a job.
1 Like
I also wondered what caused the steep decline in the participation rate. Looking at our table in the Wiki we see that it is the only significant retreat since we started tracking it more than 1.5 years ago.
The corresponding reduction in the total civilian labor force equals 676,000 from November to December while the Civilian population continues to grow.
Looking at Full vs. Part-Time Jobs at table A-9 in the release we see a shocking reduction of 1.5m full-time jobs m/m on a seasonally adjusted basis.
One year ago seasonally adjusted full-time jobs have been stable m/m from November to December.
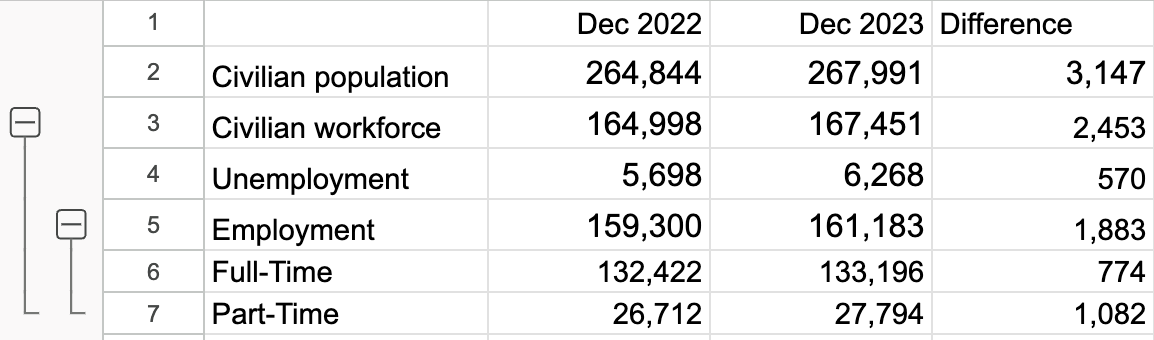
This drop in longterm full-time employees is dramatically changing the equation. Compared to December 2022 the Civilian population grew 3.147m and the civilian workforce 2.453m. The increase in the civilian workforce is composed of 570k unemployments and 1.883m new employments. Breaking down the 1.883m employments further we see only 774k new full-time and 1.082m part-time jobs added.
@Magaly what is your take on this? Do you understand the difference between “Employed” (161.183m) and Non-Farm Payrolls (157.232m) and why one is dropping drastically m/m -683k while the other one is raising 216k?
This is because the 2 surveys count jobs differently. According to their website:
Employment estimates from the payroll survey are a count of jobs, while the household survey provides an estimate of the number of employed people. If a person changes jobs and is on the payrolls of two employers during the same reference period, both jobs would be counted in the payroll survey estimates. The household survey, on the other hand, will simply reflect one employed person in its measure.
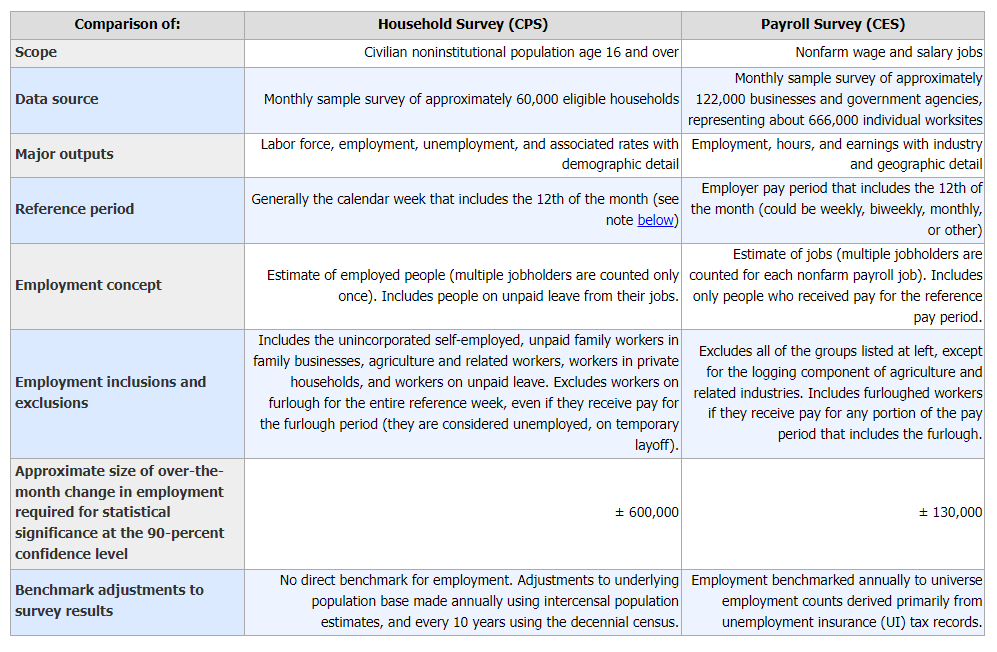
So, as an example, if 1 person has 5 different jobs, the payroll survey will count 5, while the household survey will only count 1.
This is why is important to understand the details in the numbers, if we are adding 200k+ jobs over a month, but most of them are part-time jobs for multiple jobholders the labor market will seem less robust than what the headline number would suggest.
Article about te difference in their methodologies: https://www.bls.gov/web/empsit/ces_cps_trends.htm
There is also a better measure of unemployment named U6 to understand the underlying strength of the labor market. This measurement includes:
- Total unemployed
- Persons marginally attached to the labor force: those who currently are neither working nor looking for work but indicate that they want and are available for a job and have looked for work sometime in the past 12 months but not in the past 4 weeks. Discouraged workers, are a subset of the marginally attached, have given a job-market related reason for not currently looking for work.
- Persons employed part time for economic reasons: those who want and are available for full-time work but have had to settle for a part-time schedule.
Currently, U6 unemployment is at 7.1%, and it has had a bigger increase in the last year from 6.5% to 7.1% than the official unemployment number (U3), but not big spike yet either.
Article about different unemployment measures: https://www.bls.gov/news.release/empsit.t15.htm
We also have to remain skeptical in trusting just 1 month of data because it could be an outlier, due to the revisions happening and to the fact that these surveys have low response rates ( CPS: 71% and CES:41%), and a lot of jobs are estimated using only a model.
However, the decline in full-time jobs (1 of the biggest in History) and the labor force is significant if sustained, along with the big drop in services PMI employment (also have to be skeptical since last year dec 2022 was also a bit weak) we have to be mindful that a turning point in the economy could maybe be closer than expected.
1 Like
Thank you for the explanation and the link. That’s very useful to understand the differences better.
If we use traffic light colors would you say the latest report is flashing red? How likely is it that two data points “employment” and “full-time employment” are single month outliers at this magnitude? What are the most knowledgable experts on the topic that we are following thinking?
1 Like
Mmm I think the decline in full-time employment is what could have caused the decline in employment so they could be correlated, and a part of the same data outlier, if that would be the case.
I would say that this report is flashing red, but with no confirmation yet that a turn in the economy is imminent, but definitely signals caution from here and adds to the probability of the recession.
But If next months confirm this is a new trend, I think we could be looking at a significant deceleration.
I just quickly created this chart (I am not posting here because you have to scroll to see all the years. 2020 cycle is filtered out because of the huge decline is not comparable, but can be added back): https://public.tableau.com/views/USLaborMarket/FulltimeEMMLevel?:language=en-US&:display_count=n&:origin=viz_share_link
It shows that a decline of this magnitude in a single month is not normal, not even during most recessions. But we also see 1 instance in 1994, where a 2m decline happened in January, without a recession, it was just 1 month.
We also see that during the recessions, declines in full time employment last for months, and is what we probably need to start seeing. Currently, we have been kinda weak since July 2023.
I have seen from the people that I follow that the change in full-time employment did not go unnoticed comparing it to the biggest decline since 2020 and other recessions, and that underlying strength does not look good. But I would have to search for more detailed opinions if they are available because unfortunately short commentary in YT is only focused on the headline numbers.
1 Like