Great overview.
1 Like
April 2024:
New Cars
Prices
Waiting for final release
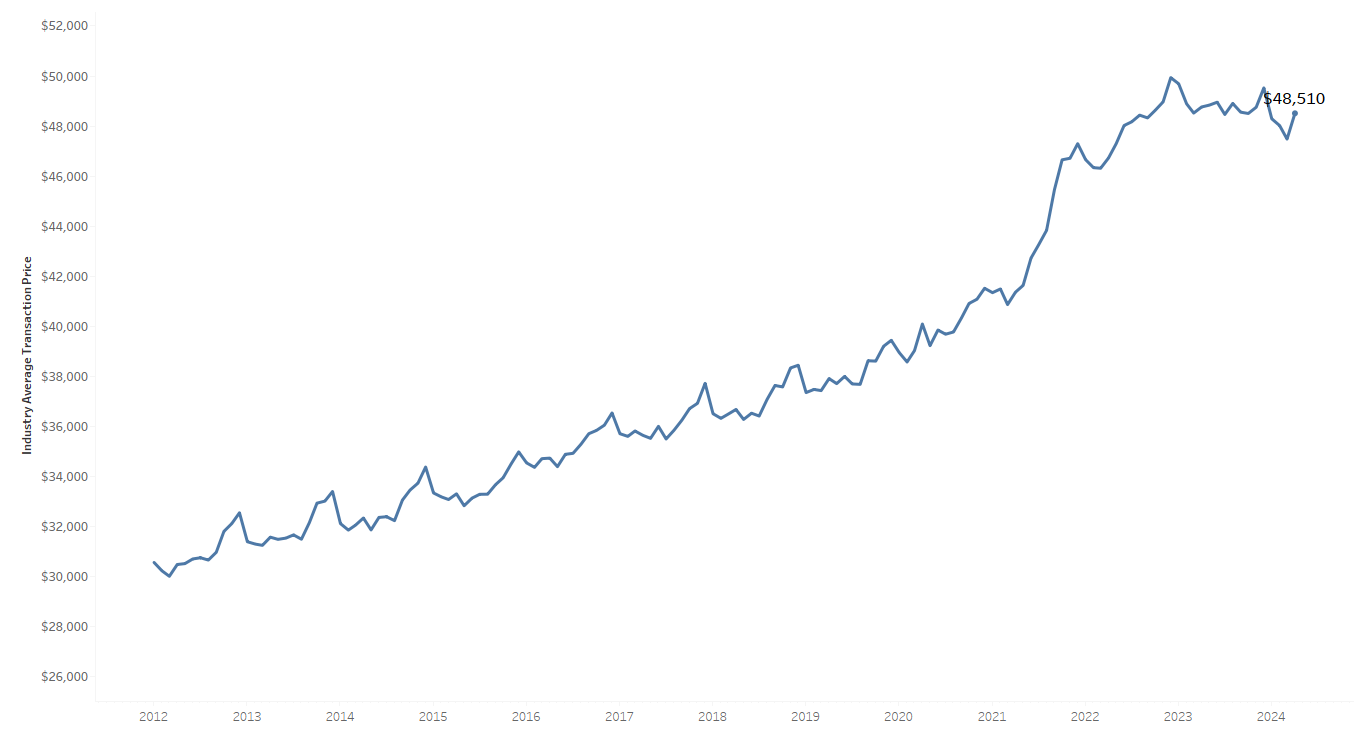
- Initial estimated average transaction price rising to $48,510 – the highest mark since December but down 0.5% year over year
- The average price relative to the average manufacturer’s suggested retail price (MSRP) moved up to 97.6% as the level of discounting declined modestly. The average MSRP increased 2.2% in April and was up 1.3% year over year.
- Volume was lower, as expected, at 1.31 million units, down 3.3% year over year and down 9.1% compared to March.
- The selling pace last month, estimated at 15.7 million, was up 0.4% year over year and up 1.1% month over month. Though lower than our 15.9 million forecast, the April SAAR was equal to the SAAR in April 2023 and an improvement from March.
Used Cars
- Wholesale used-vehicle prices were down 2.3% in April compared to March, and are down 14% Y/Y. (-23% from the peak).
- Compared to last month, the pickup segment fell by just 1.3%, less than the market’s decline of 2.3% for the month. Compact cars fell the most against March, declining by 3.9%, luxury was down 3.2%, SUVs decreased by 3.1%, and midsize cars were down 3.0%.
- Seasonally adjusted EV values for April 2024 were down 17.5%, while non-EVs were down 13.1% year over year. Regarding values against last month, seasonally adjusted EV values declined in line with the market, falling by 2.6% from March 2024, while non-EVs declined 3.0% over the same period.
- The average retail listing price for a used vehicle was instead up 2% over the last four weeks.
Sales
- Initially estimated that retail used-vehicle sales in April were down 4% compared to March but higher year over year by 9%
- An initial assessment indicates April ended at 45 days’ supply, up two days from 43 days at the end of March but down one day from April 2023 at 46 days.
2 Likes
@Magaly I wonder why there is such a large discrepancy between the +2.2% new vehicle car price increase according to Cox and the the -0.4% CPI number. Do you have a take on that?
Which data point is more reliable?
Which data should we factor into our understanding how new car prices are developing?
1 Like
Could be because there are lags in the CPI data. CPI is well known for having a lot of lags between its components and real-time data.
It could also be differences on methodology, CPI index use transaction data from JD Power they buy, but it makes a lot of modifications to it to reflect “true” changes in the cost of living.
Unfortunately, BLS changed completely its methodology recently, and can’t compare now long-term trends to know how correlated they have been. But the recent chart seems kind of similar, COX just seems more volatile month by month, and CPI smoother. As I always mention is better to analyze trends in data, more than just 1 month print. And their trends seem similar.
Cox seems to have peaked at the beginning of 2023, and CPI until September 2023.
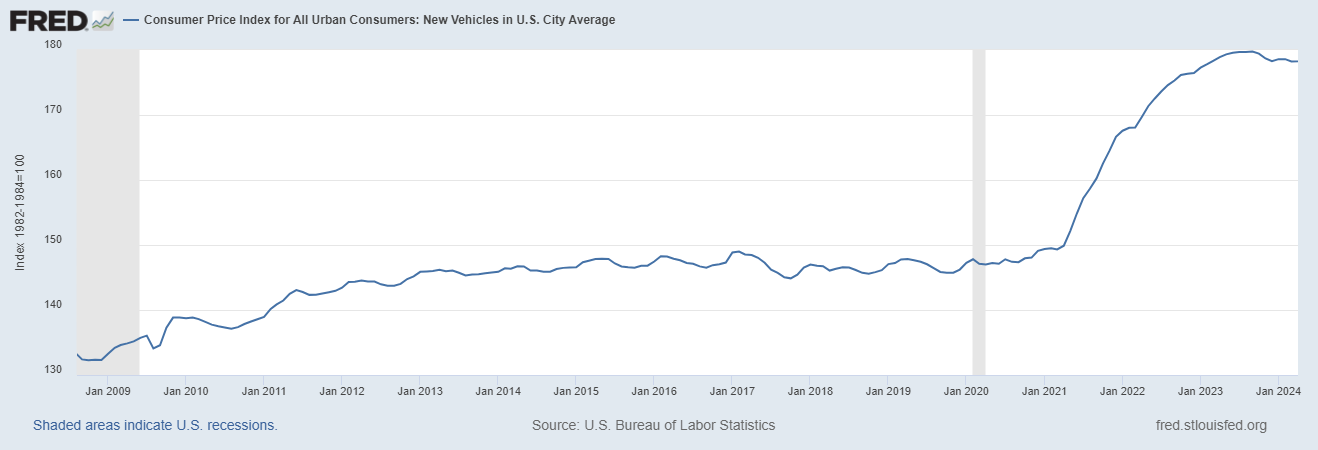
At this point, I would trust COX data more that focus more on actual price changes, and not cost of living. It is also more detailed in the amount of information it gives.
The government also always has a lot of criticism because of flawed measures due to its statistical models and tweaks. Another very good example is shelter CPI.
2 Likes
Thanks for the explanation, that helps.
Also great idea to put the charts side by side.
What stands out to me is that Cox shows strong price increases of avg. prices from 2012 until end of 2020 while the CPI component is pretty flat during the same period.
Do you have any idea why that is?
Maybe it is indicating that cars did not get more expense in general but people started to buy more expensive & high end cars?
1 Like
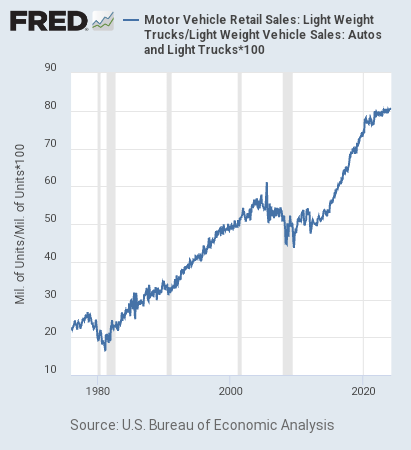
Yes, that could be one of the reasons. As an example the share of light trucks in light weight vehicle sales volumes have definitely increased a lot since 2010 in the US. But it has since data is available.
However, when analyzing a company, I think not only the price matters, but also the sales mix between cheaper/expensier vehicles?
So maybe avg transaction prices could be more useful to us?
It could also happen in the current environment that prices don’t necessarily come down a lot, but consumers start to prefer cheaper options due to affordability.
Also, as a mention in the post, the BLS changed methodology in 2022, they could also have realized the old methodology was not reflecting very well the true changes in cost of living for new cars.
Before they used surveys to dealers, not transaction data, so the data is probably less reliable before 2022. But I think sales mix could still be one of the primary reasons.
Oh, that is certainly not good for the environment.
Yes exactly. The reason why I am interested to know if people started to buy more expensive cars is that is could help us answer questions like:
Has there been a shift in the economy from economic to premium brands? Or did people buy more trucks and more expensive configurations or something else?
Has there been a margin expansion in the automotive industry or have more expensive cars been more expensive to manufacture and margins stayed mainly the same?
Did prices of the same car not change at all between 2012 and 2020? (As indicated by CPI)
Does that imply that major macro input factors like inflation, cost of labor, materials, shipping etc. and the intensity of competition stayed very stable during this period?
Depending on our findings we could also initiative research on other questions like:
Have higher average prices been financed by available budgets and a richer middle class or did people reduce their saving rate to do so?
If higher car prices do not correlate with larger budgets and are financed on credit, do we expect that people will go back to cheaper options?
Trying to get a grip on those questions will help us to understand the overall health of the automotive industry in the U.S. better and potentially get a feeling which brands are positioned better or worse for the years to come.
It also gives us insights into the purchasing power and psychology of people and the amount of money they can and are willing to allocate towards car purchases.
Most cars are financed with credit, cash transactions are not the most common, so I don’t understand the question or the point.
And is also not one or the other. Affordability indexes are a function of both income and credit conditions, among other things. Cox/Moodys methodology is an example.
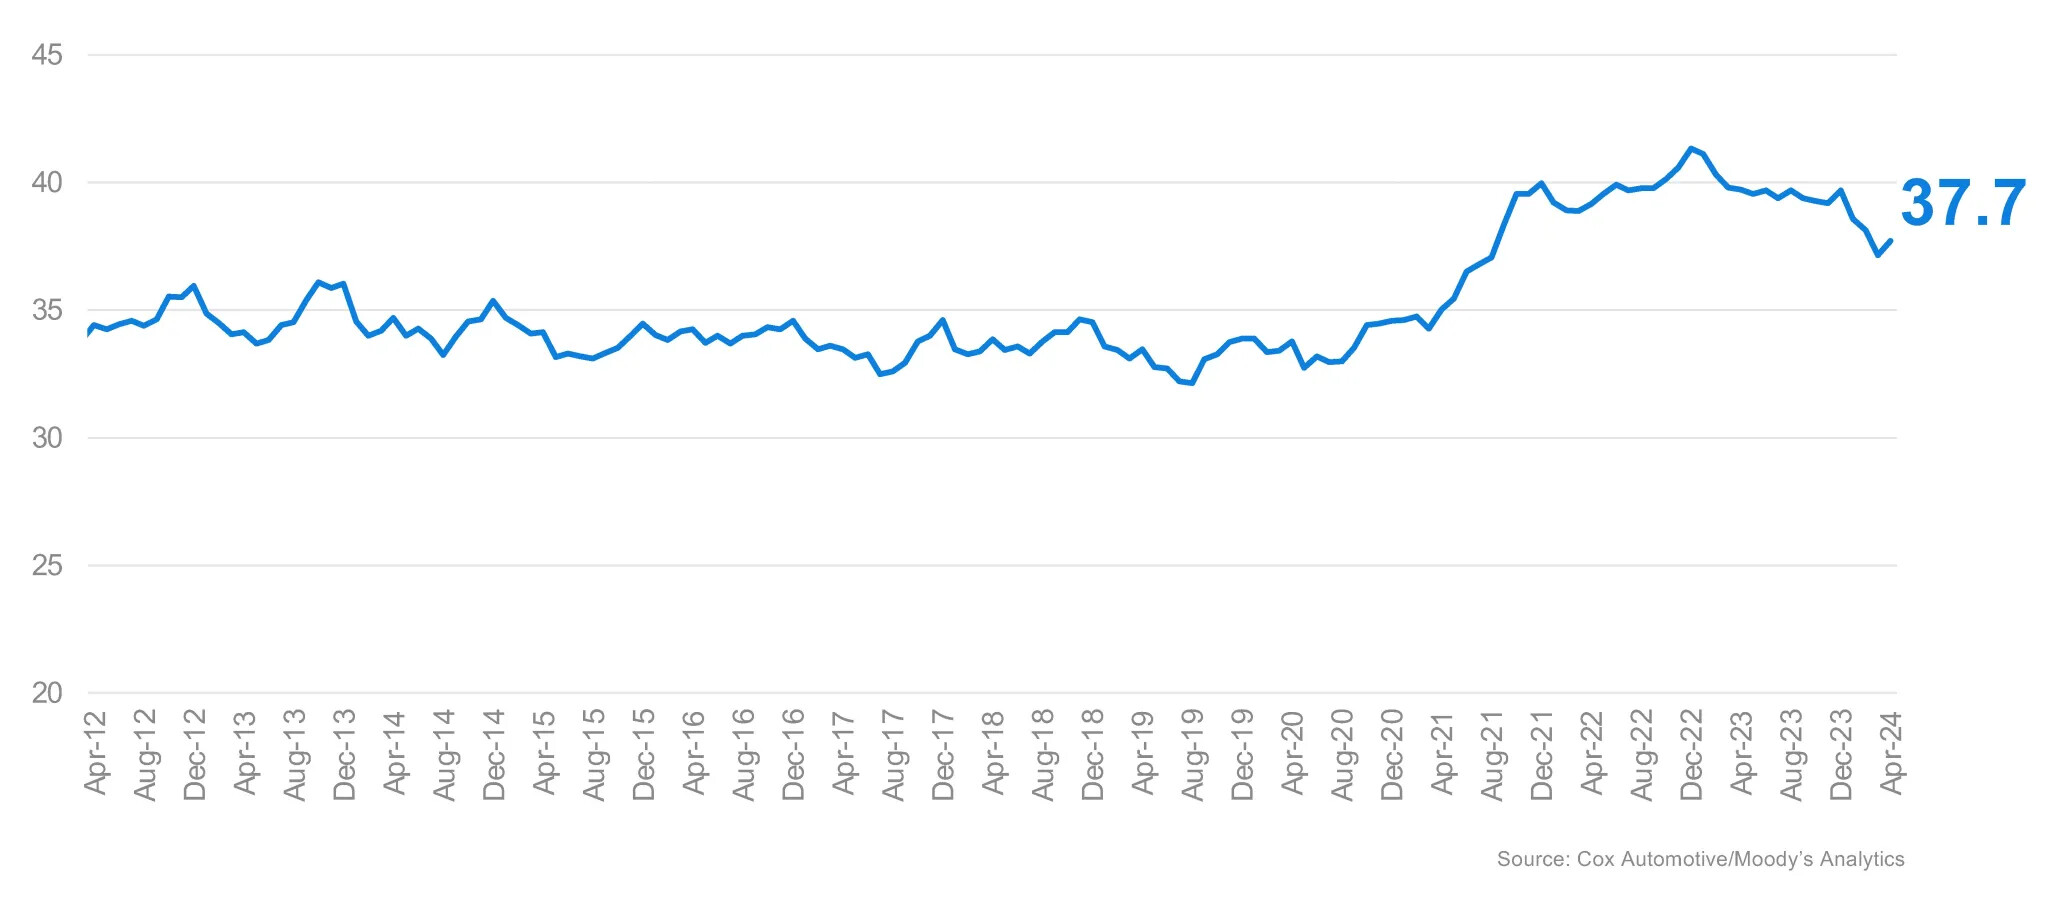
The Cox Automotive/Moody’s Analytics Vehicle Affordability Index is driven by the consumer’s vehicle transaction prices, the income of the consumer, amount financed by the consumer, and the interest rate provided by the lender
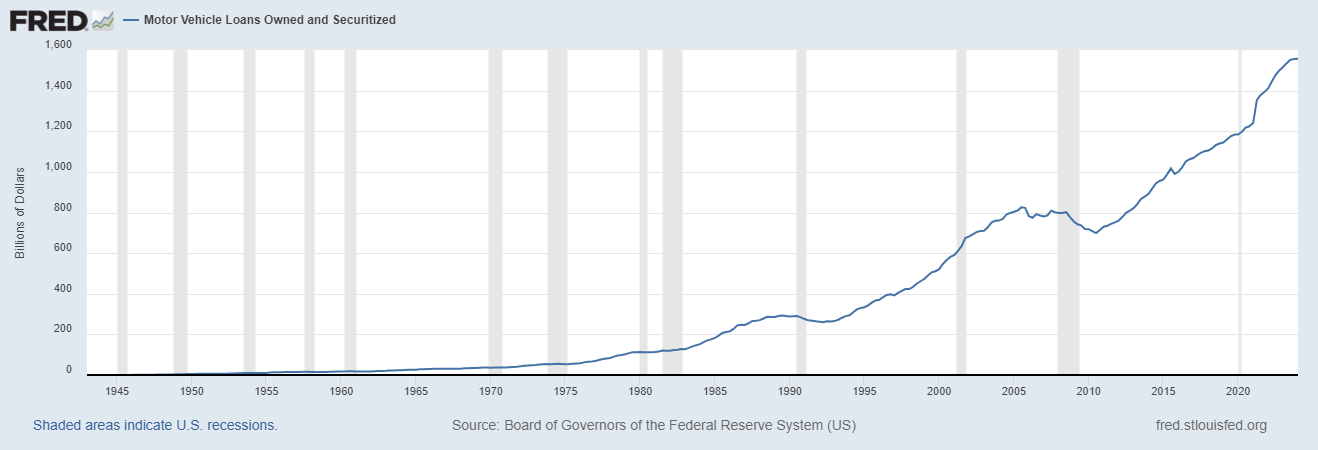
Median household income (+46% since 2012, as of 2022) and real median household income (+17.7% since 2012, as of 2022) have been growing, but also has auto loans, even more so, but flat since 2H2023 (+92% since 2012). I am sure both income and low rates played a significant role, not one or the other.
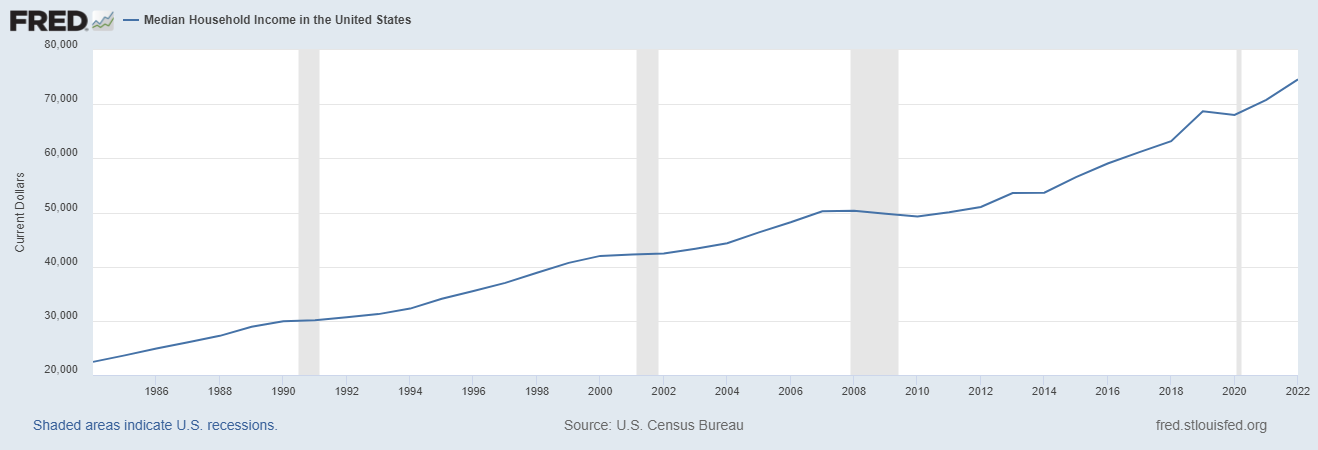
And according to COX/Moodys, affordability was indeed pretty flat, even declining since 2012 until 2020.
But, is also a function of the economic cycle. Credit and income are not isolated, higher credit costs will usually lead to a slowdown in income growth in the economy.
All those questions will take time to search for available info. But will have them in mind.
Yes sure, the idea is to provide some possible research questions that we could add to our roadmap on Smartsheets which would help us to strengthen the picture on automotive that we are seeing and further deepen our research.
Getting answers to those questions would not be a particular high priority but just something to keep in mind and one possible path to dig deeper.
To the question itself: I basically was interested if there has been an unusually high increase of automotive credit during the last years, which would burden households that much that we could assume that consumers would need to take less credit going forward because so much credit was already taken.
Looking at your charts though of household income and autoloans the situation appears to be healthy in my opinion. The Cox/Moody Index you provided is also interesting. It probably rose a bit in 2021 because of higher car prices but stayed remarkably stable afterwards and appears to be not influenced at all by interest rate hikes in 2022.
What do you consider or define as healthy?
Consumers have been growing their debt above their income growth.On top of that delinquencies for consumer credit are already increasing above 2019 levels in some cases (autos and credit cards), in a still-growing economy, so how could they look in a recession?. Not particularly healthy trends imo.
Nothing catastrophic that I could see happening yet if that’s what you mean, but is not a completely healthy consumer currently.
Auto loan growth has also been low or stalling already since Q3 last year.
This is all US. I don’t have a lot of knowledge about these trends in other regions.
The affordability index continued to rise until the end of 2022, what makes you think credit cost did not have any influence at all?
It was probably a combination of everything, prices just had the biggest contribution in 2021.
Recent improvement is also probably a combination of income still growing, rates stable, and average transaction prices starting to decrease.
My definition of healthy is stable situations that would not cause us to believe that larger problems are forming. That said I judged that only based on three charts that you just posted and have limited knowledge.
Do you think that higher delinquencies or flat auto loan growth would cause problems in the U.S. car industry? What is your base case how things are going to develop in 2024, 2025 and beyond? How much does the starting situation change consumer behavior during a recession?
1 Like
Is just that it also depends on the timeframe you are thinking, the consumer still has run away to take more credit long term, their debt is still below 100% of their income. (85% as of Q1 2024)
But short/medium term, they are starting to struggle a bit, and I see the potential for larger problems forming, but temporarily.
That is probably up to their income currently, credit growth has slowed and they are not much direct stimulus anymore going around, so income growth seems to be what is holding them currently (meaning the labor market mainly). But consumers are already starting to spend above their income growth, so there is an unhealthy trend forming there too.
If their real income falthers, because of a recession or another wave of inflation, their spending habits are forced to change temporarily, not much about preferences. In 2008, that pattern happened they started to prefer/buy cheaper options at least temporarily, also because government stimulus aimed for more full efficient options, and you can see it in the chart above the share of light weigh truck declining during this period.
The severity of it and potential problems arising for the consumer are up to the development of a potential recession, and how much the FED and government can intervene because of inflation.
I have to think and research those questions you just asked better, but my base case has been and continues to be that we will end up in a recession eventually.
The timing and severity are just guesses. Right now I don’t see a very severe recession, especially because I don’t see the government allowing it.
Automotive seems to be experiencing their own cycle too, the industry could struggle while the economy is still growing. But in that case is probably even less severe the problems.
That’s interesting. Do we have long-term graphs of consumer debt to income levels in the Wiki that help us to understand how healthy debt levels are in comparison to income? I think to continue this discussion on the consumer, the topic below is probably the correct one?
When it comes to automotive but also in general, it would be interesting if we could increasingly connect sub-questions like delinquencies or auto loan growth to larger questions about how the industry will develop. Having a clear focus on the highest-level questions of portfolio impacts and one level below that industry developments will help us to focus on the right components/indicators as we always try to put them into context with those higher level questions and try to weigh and factor them in correctly.
Questions I would have in mind include:
- How correlated are sub-components like e.g. delinquencies or auto loan growth with the development of the automotive industry?
- Can those sub-components or others serve as reliable leading indicators?
- Which sub-components are the most important ones and how can we model insights from them into our model of the automotive industry?
- Are there irrelevant components that might only affect a very small population subsection or even skew the picture?
etc. etc.
Our goal would be to continuously improve the larger picture that we are seeing until it becomes very clear and a good example for other research areas and help build our reputation and guide our investment decisions.
1 Like
We don’t have it, but I can create the graph, one against income, and the other against GDP. Will post it on the channel you just mentioned.
Is not that I think US debt to income levels is particularly healthy, for that it needs to be below 40 or 50%, something like that. But to be completely overburdened by debt and greater risks of deleveraging, it needs to close or above 100%. But will make a post about it there.
And about those questions, I will add them to the roadmap for the industry and the companies. I agree with you that should be the goal eventually from all the data we have and analyze.
1 Like
May 2024
New Cars
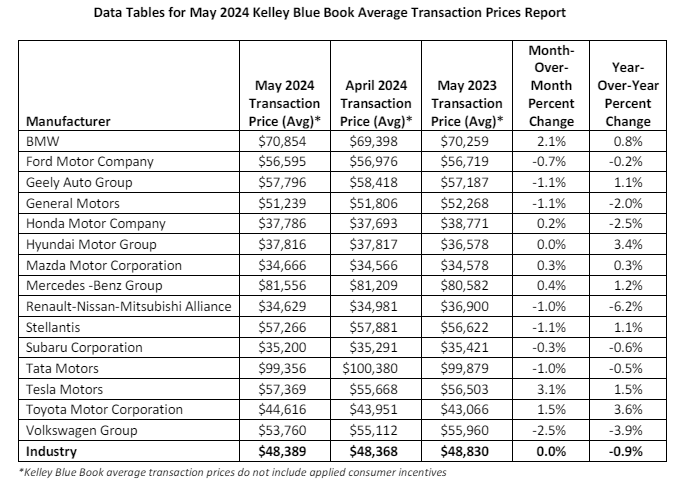
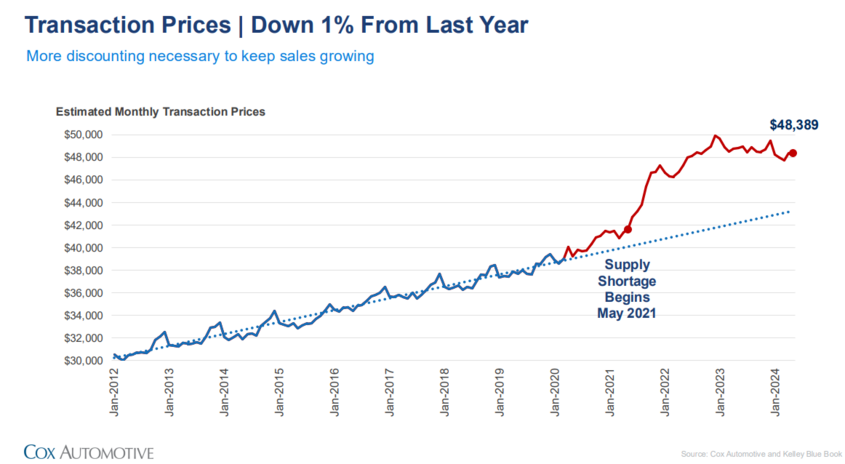
- The average transaction price (ATP) was $48,389, statistically unchanged from the downwardly revised price of $48,368 in April. Lower Y/Y by 0.9%, approximately $442.
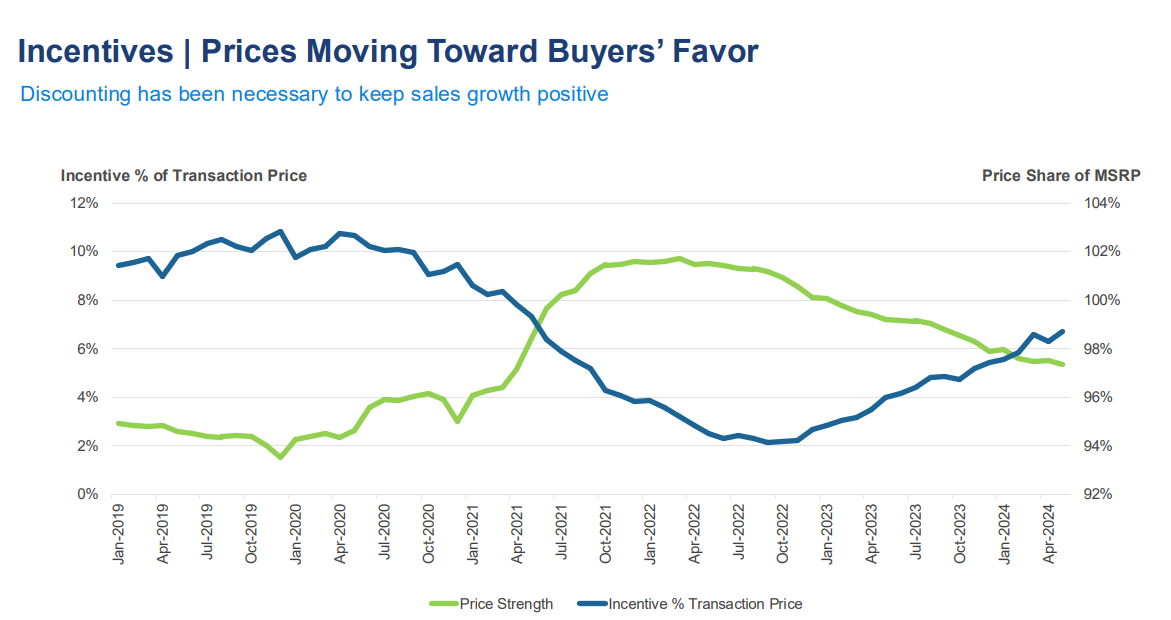
- The average new-vehicle incentive package – discounts and rebates included – last month was 6.7% of the average transaction price, an increase from April and the highest level since May 2021.
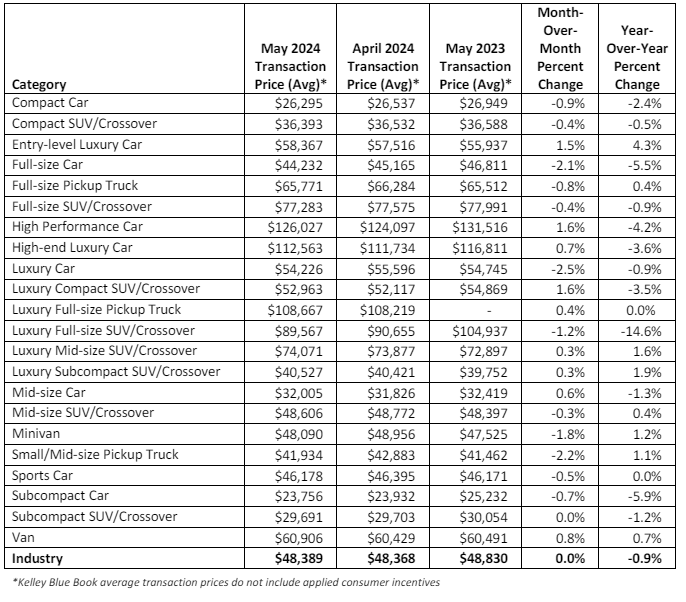
- Vehicles transacting below $40,000 accounted for 41.2% of new-vehicle sales in May, up from 36.8% one year ago.
- ATPs over $60,000 in May, accounting for 26.4% of total sales, an increase from 20.4% in May 2023.
- The middle of the market, vehicles with ATPs ranging from $40,000 to $60,000, lost share in May, falling from 37.9% in May 2023 to 32.5% last month.
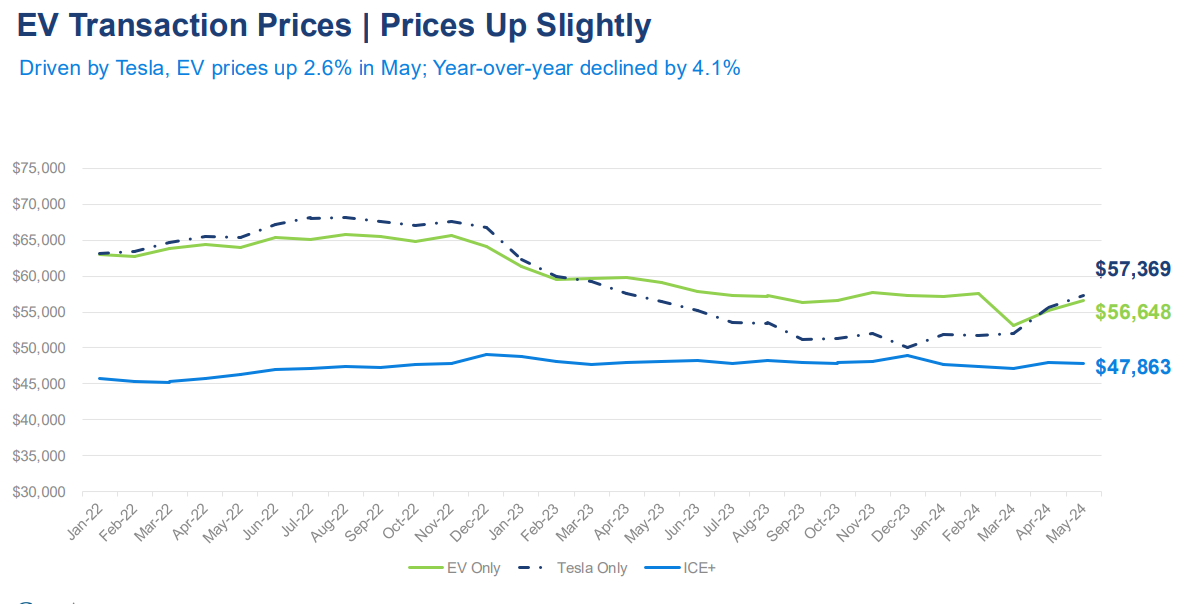
- The average price paid for an electric vehicle in May was $56,648, which is 2.6% higher than in April. Industry-wide EV prices in May were lower year over year by 4.1%.

- New light-vehicle sales were up 4.8% year over year.
- The May seasonally adjusted annual rate (SAAR) for new vehicles was 15.9 million, marking an increase of 2.5% from last year.
- Sales into large rental, commercial, and government fleets were up 5.7% year over year.
Used Cars
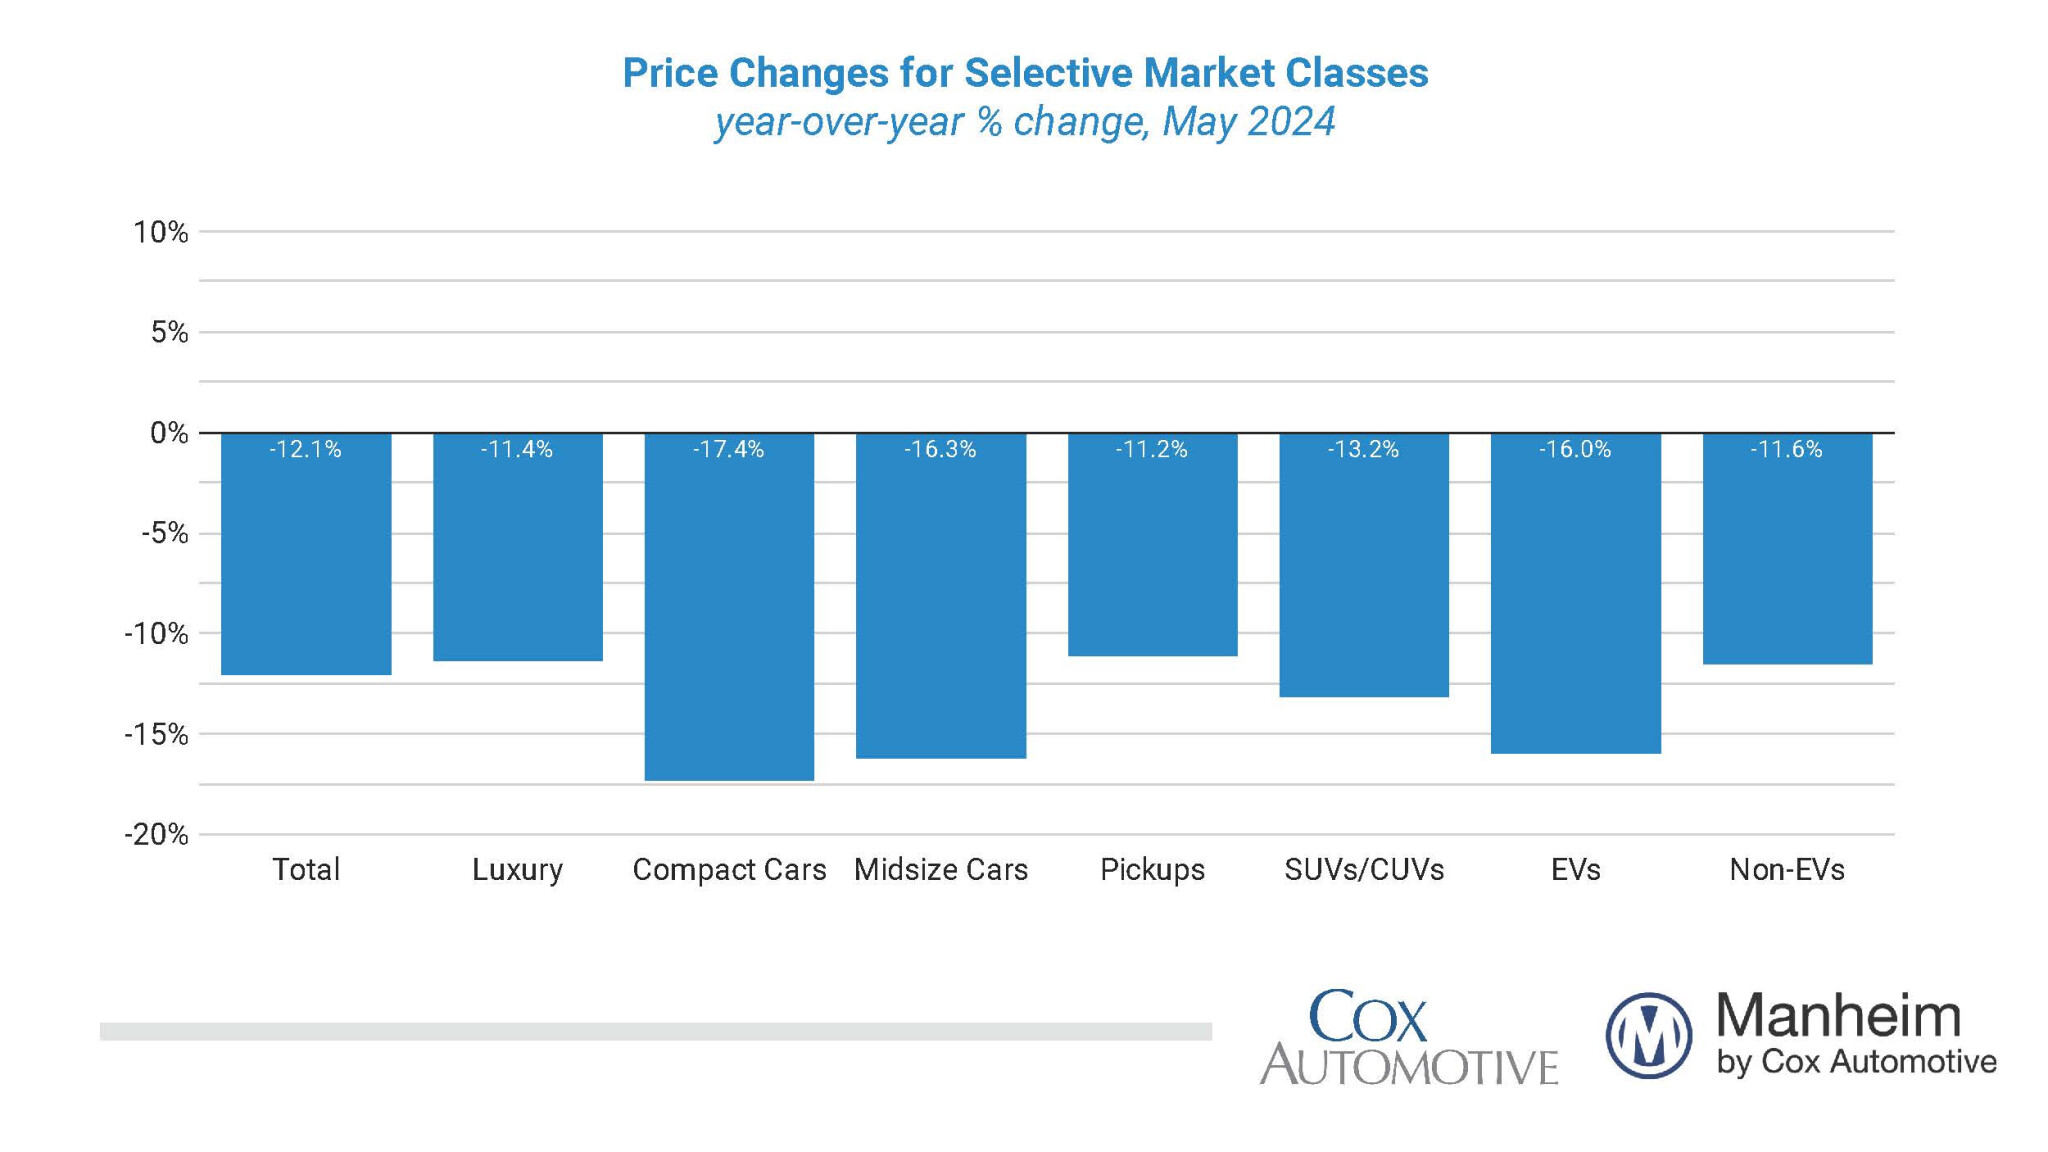
- According to the Manheim Used Vehicle Value Index, wholesale vehicle values declined 0.6% in May on a seasonally adjusted basis. The Manheim index ended May lower by 12.1% year over year.
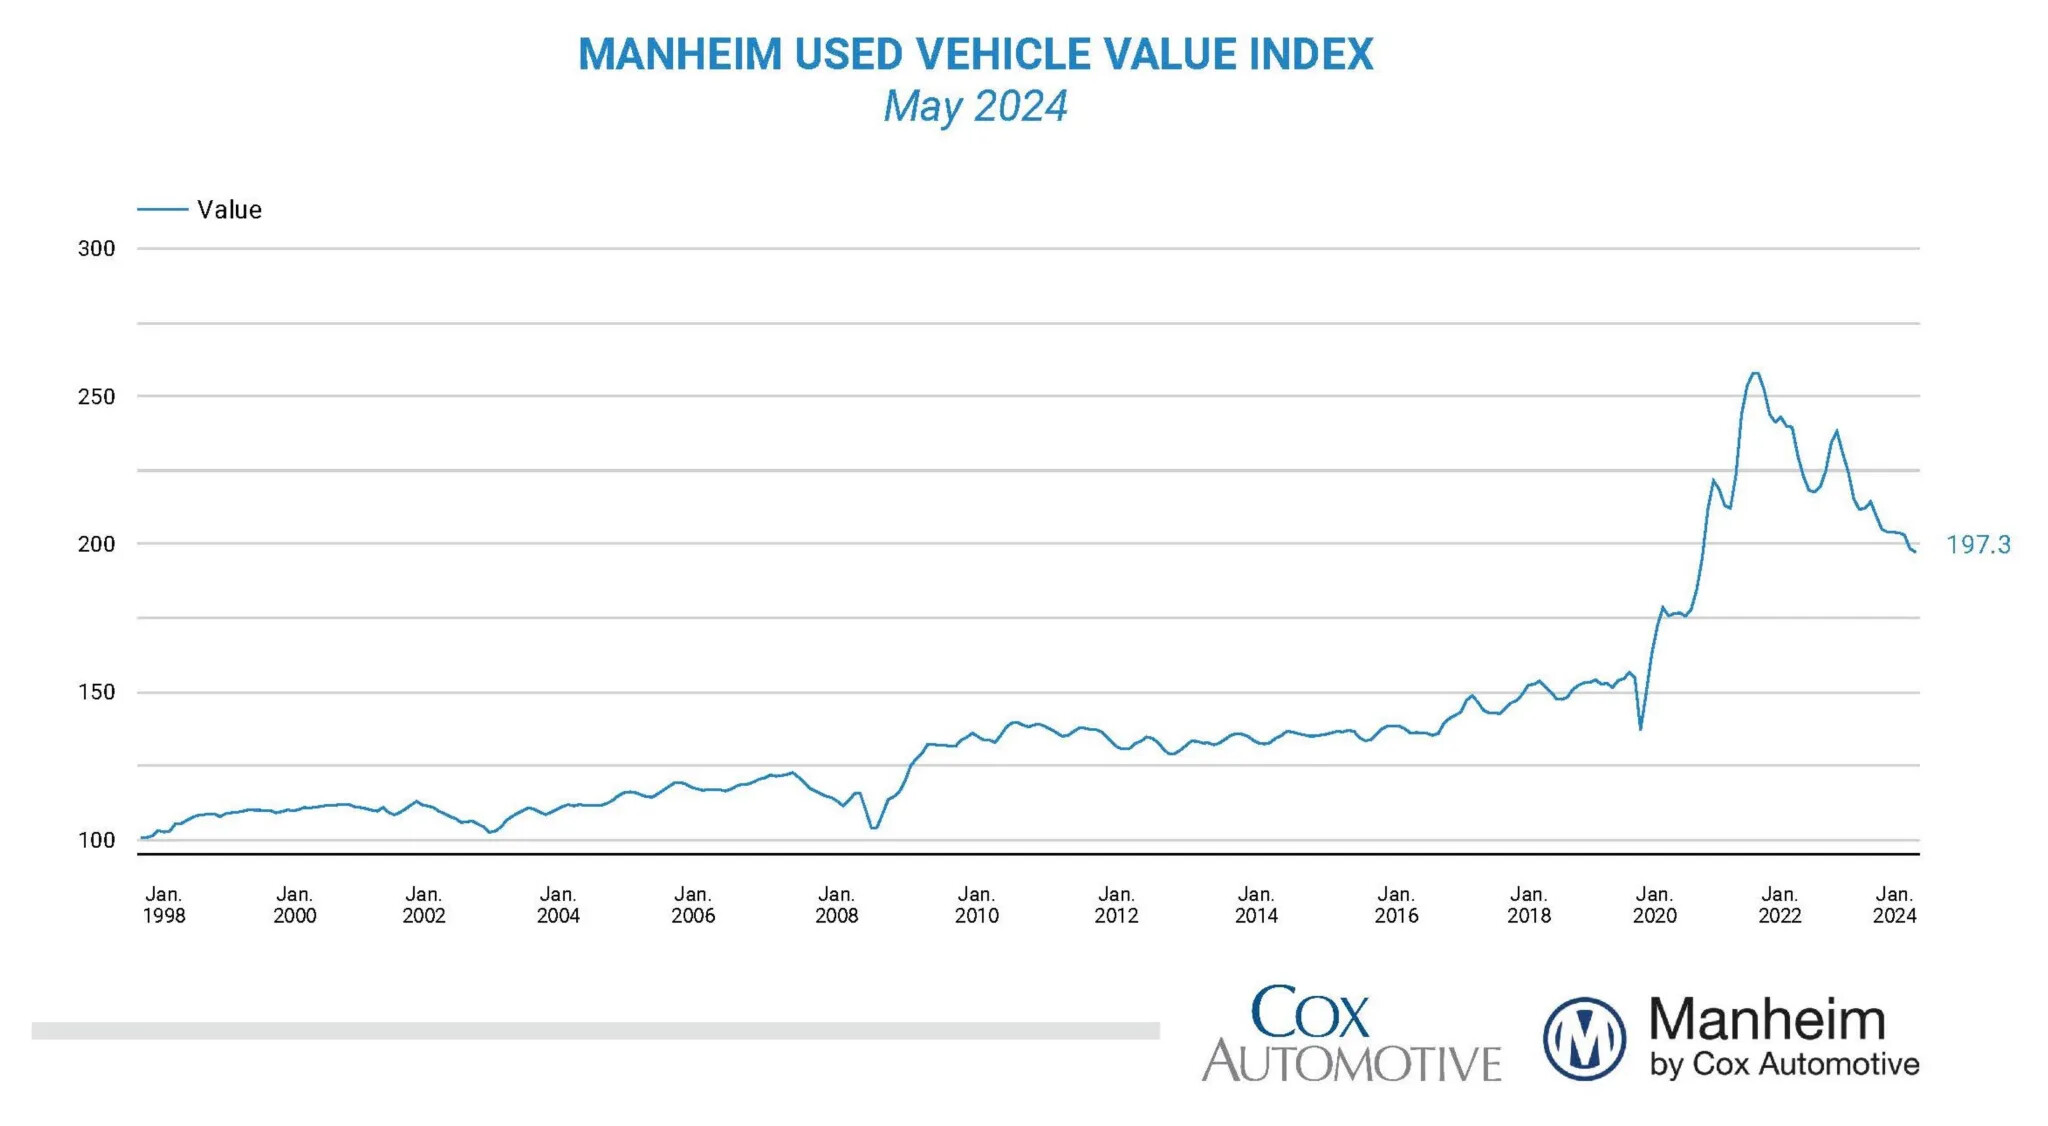
- Retail used-vehicle sales in May were up 6% compared to April and higher year over year by 12%. The average retail listing price for a used vehicle was unchanged over the last four weeks.
2 Likes
@Magaly Do you think the June drop in sales which was caused by a cyber attack that affected dealer software will have any longer lasting impact or be compensated immediately by higher sales in the next months? (Stifel, min 4:23)
What are the reasons why Cox is predicting a shortage of new vehicles and lower sales of new vehicles?
No, I do not expect any long-term impacts, as this was not a demand problem but only the dealer’s systems were temporarily out of service.
According to Cox Automotive, it simply created temporary noise in the data, and the sales lost in June are likely to be recovered in July.
They also indicated that initial numbers could appear worse than reality, as reporting delays due to the attack could have impacted reporting more than actual sales.
I think there was a misunderstanding. The shortage of new vehicles and consequently lower sales in 2021/2022 will impact the supply of used cars in coming years.
However, Cox Automotive still forecasts only a 1.3% increase of new car sales for 2024.
1 Like
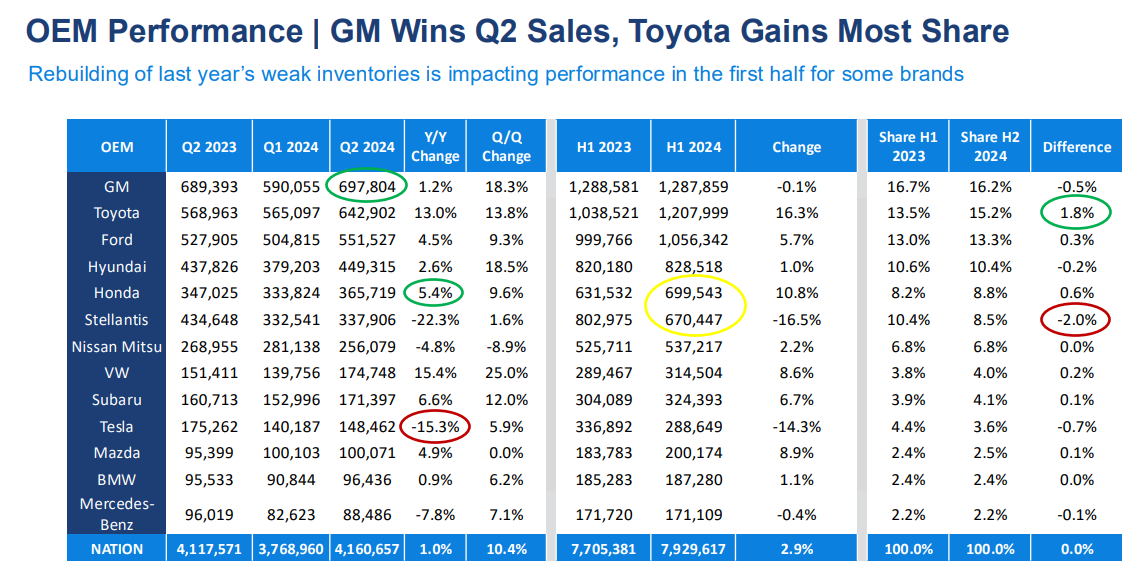
Q2 2024 Industry Update
Cox maintains a cautious outlook for the industry, their 2 main concerns currently revolve around:
- Uncertainty among dealers and consumers is high, leading to a wait-and-see behavior among buyers who anticipate lower rates, reduced prices, and potential impacts from the presidential election on the auto industry. Despite higher incentives and lower prices, this uncertainty is why sales have not picked up significantly.
- The Federal Reserve is taking too long to cut interest rates, and another mistake by the Fed could damage the industry more than expected
Sales
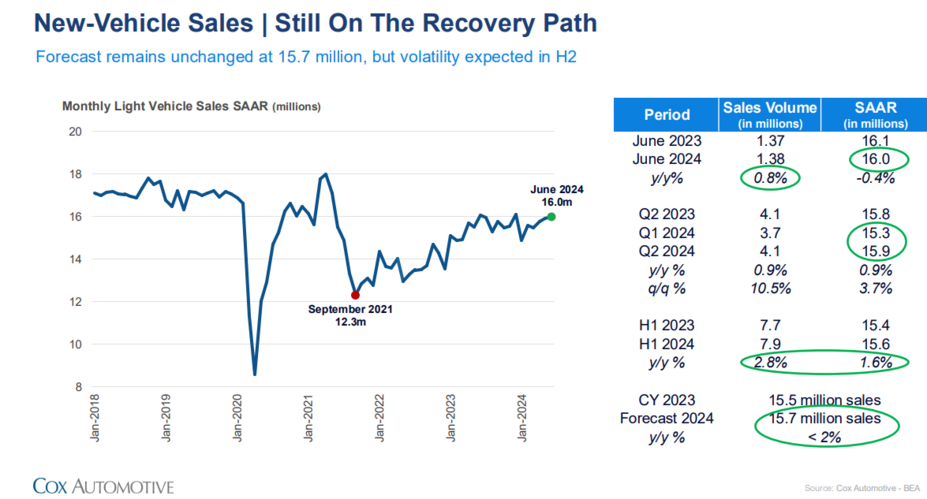
- Sales grew 10.5% q/q in Q2 2024 vs -3.5% in Q1 2024. They grew 0.9% y/y in Q2 vs 5.5% in Q1.
- 1H2024 grew 2.8% Y/Y. Annual forecasts are for a 1.3% growth.
- There are concerns that sales will not maintain the same growth in the second half of 2024 due to ongoing uncertainty.
- Despite this, 2024 is expected to finish slightly better than 2023, bolstered by discounting and better pricing, although uncertainty remains a significant challenge.
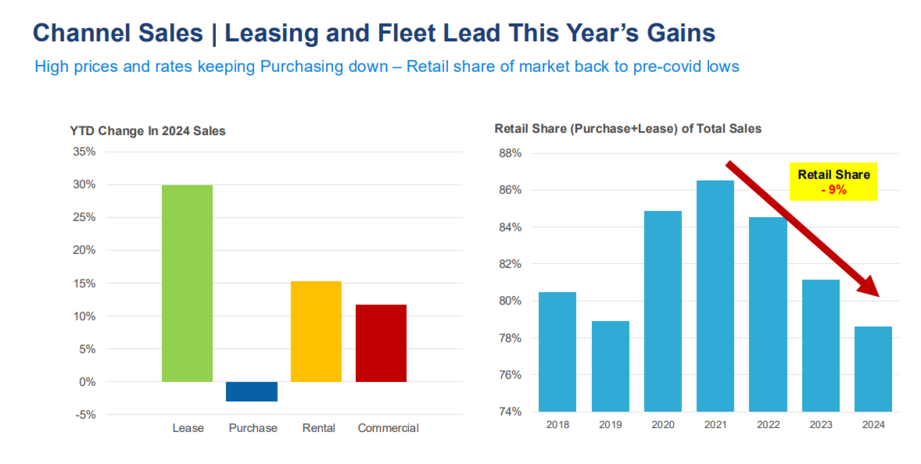
- The year 2024 has seen benefits from lease, commercial, and rental fleet sales. However, individual vehicle buyers have decreased throughout the year. The share of retail sales has been declining, as high prices and interest rates impact consumers’ ability to purchase vehicles. This decline in retail sales could pose a headwind since the pent-up demand for fleet sales is likely exhausted.
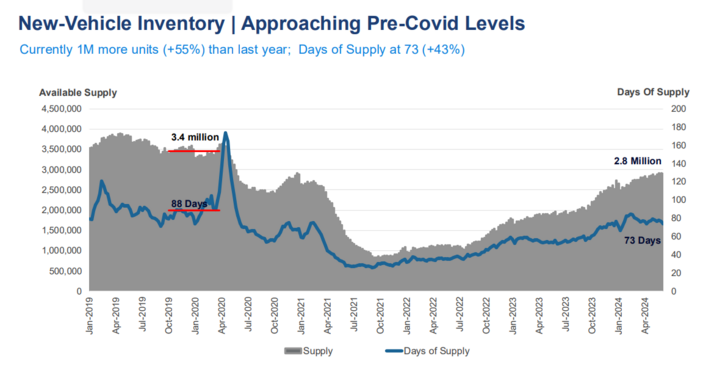
Inventory
- Inventory is still about 12% lower than pre-levels.
- Days of supply stabilizing in recent months in the 70-80 range, suggesting a new balance, below pre covid levels.
Prices
- Vehicle average prices have decreased by 1% year-over-year and 3% from their peak, but they remain 20% higher than in Q1 2020.
- Increased incentives due to higher inventory levels, although still lower than pre-COVID levels, might create expectations among potential buyers that prices will drop further.
- Consumers may still be unwilling or unable to purchase more unless prices decrease further. The pre-COVID trend could suggest a current price of around $43,000, which is $5,000 lower than today’s levels.
- The forecast for 2024 remains consistent: more inventory and increased discounting.
- While affordability has been improving, consumer price sensitivity for autos has also increased, offsetting this benefit. This is why, despite lower prices and higher incentives, sales have not significantly picked up.
Credit
- In June, 1.81% of auto loans were severely delinquent, an increase from 1.80% in May, but not back to the higher levels we saw in March and February.
- Defaults increased 3.6% in total in June and were up 12.6% year over year.
- The June annualized default rate was 2.92%, 10 basis points (BPs) higher than May and higher than the 2.49% annualized default rate in 2019.
- The year-to-date default rate is 3.07%, which is 17 BPs higher than the default rate in 2019.
- The typical monthly payment increased by 0.6% to $756, and the number of median weeks of income needed to purchase the average new vehicle rose to 37.2 weeks from 37.1 weeks in May. The average monthly payment had previously peaked at $795 in December 2022. The estimated number of weeks of median income needed to purchase the average new vehicle in June was down 6.3% from the same time last year.
Forecasts
Not much has changed other than the used car price index.
- 1.3% Y/Y growth for new sales, 0.8% for retail.
- The pent-up demand is most likely exhausted.
- Larger economic risk over the next six months is the possibility that the Federal Reserve may wait too long to cut interest rates.
- Some weakness in sales is expected in the second half of 2024 due to consumer uncertainty (waiting for lower rates and prices, and political expectations), but a collapse is not anticipated either.
- If Trump wins the election, there could be a pull forward in demand for EVs as tax credits may come under scrutiny.

2 Likes
Apparently, Donald Trump would want Chinese cars to be built in the US and not Mexico.
He does not seem to care they are from Chinese manufacturers, he just cares that the cars are manufactured in the US, and this way US labor is used.
If coming from Mexico, he will increase tariffs on them over ~100%
He is also against all the initiatives in favor of EVs.
2 Likes
July 2024 Market Update
New Vehicle
July saw new-vehicle sales decrease 2.0% year over year and decrease 3.0% month over month despite having the same number of selling days as July 2023.
- The July seasonally adjusted annual rate (SAAR) was 15.8 million, down 0.8% from the previous year.
- The July SAAR was up 4.2% from June’s downwardly revised 15.2 million, which was impacted by the CDK software disruption. At this point it appears that July did not see a full recovery of the disrupted/lost sales in June.
- The SAAR year to date remains 15.5 million, which was the total for last year, but YTD last year as of July was 15.4 million.
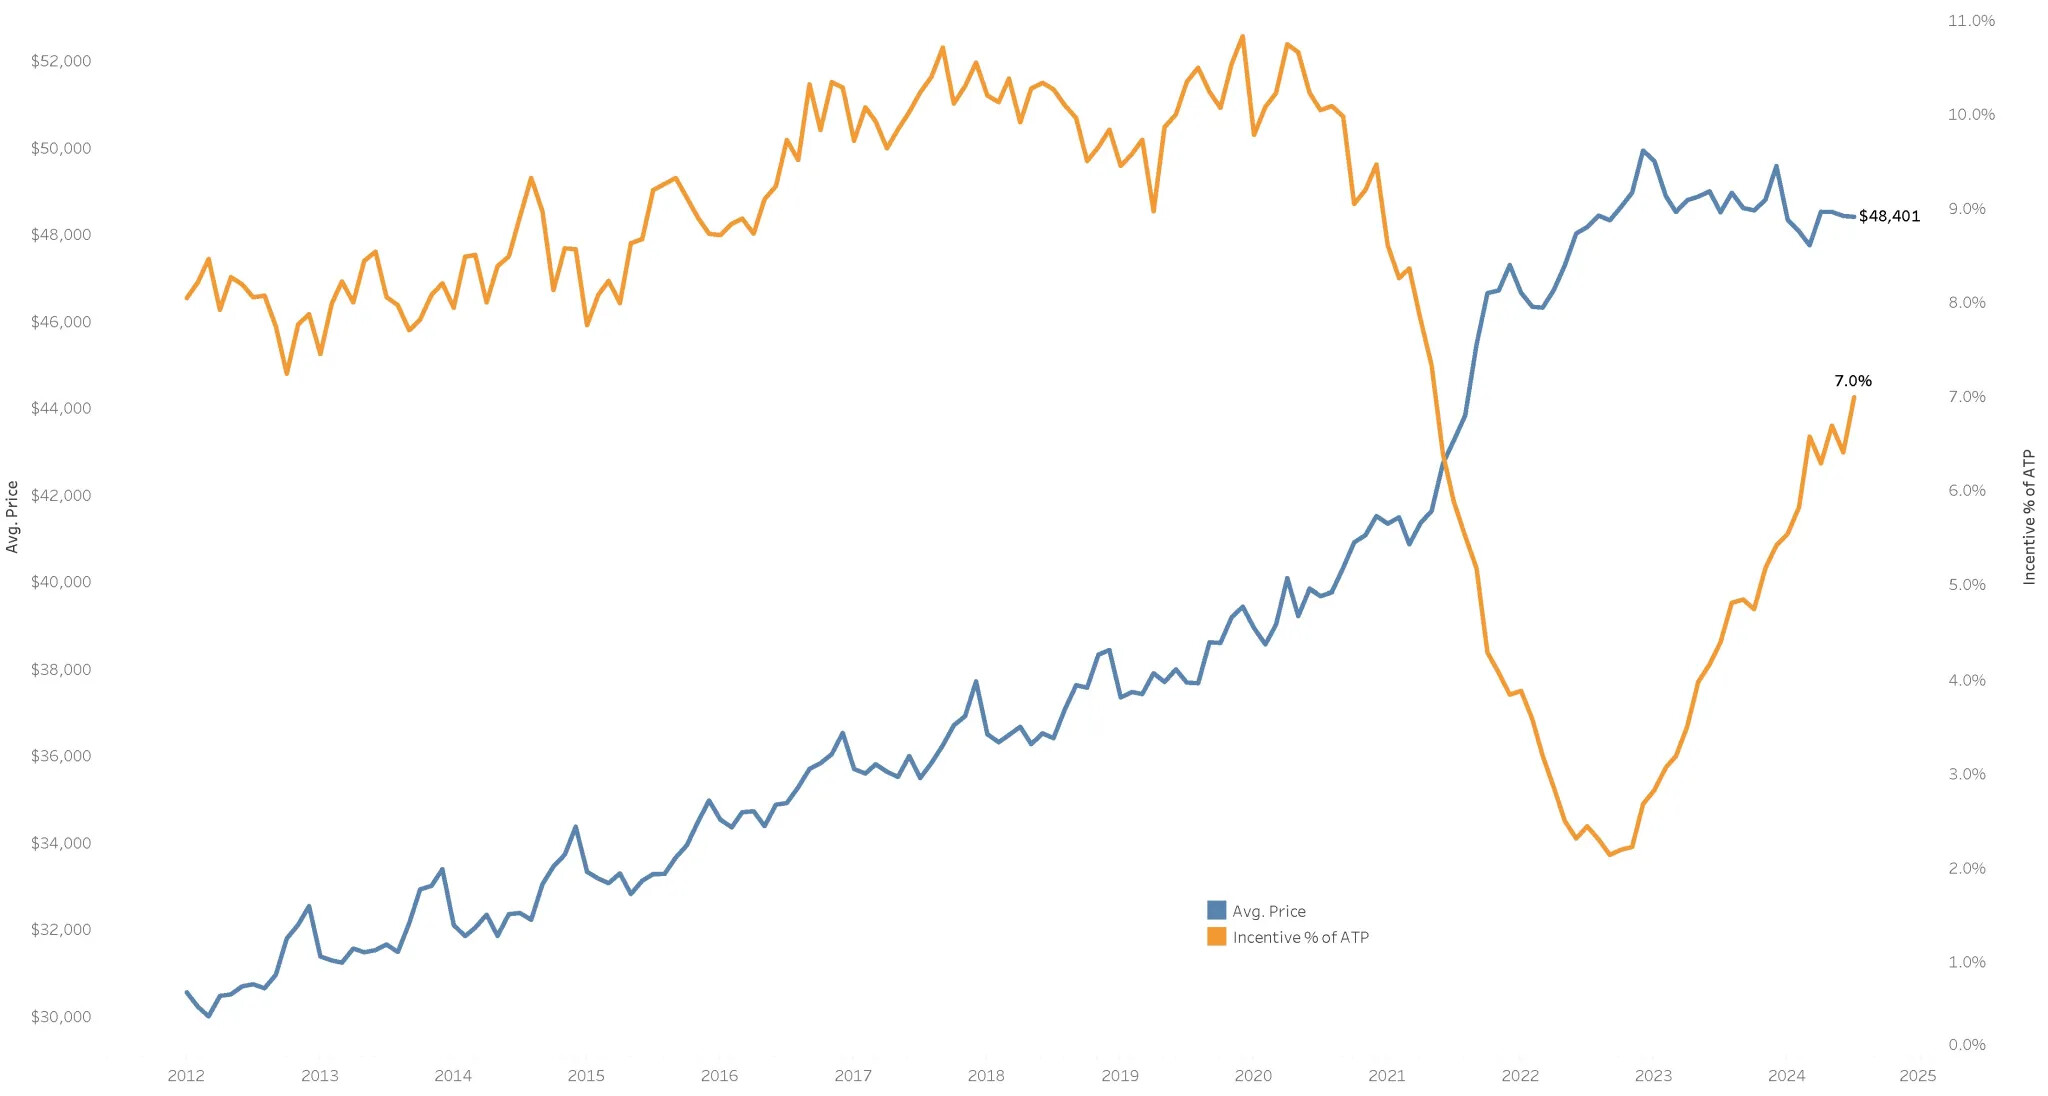
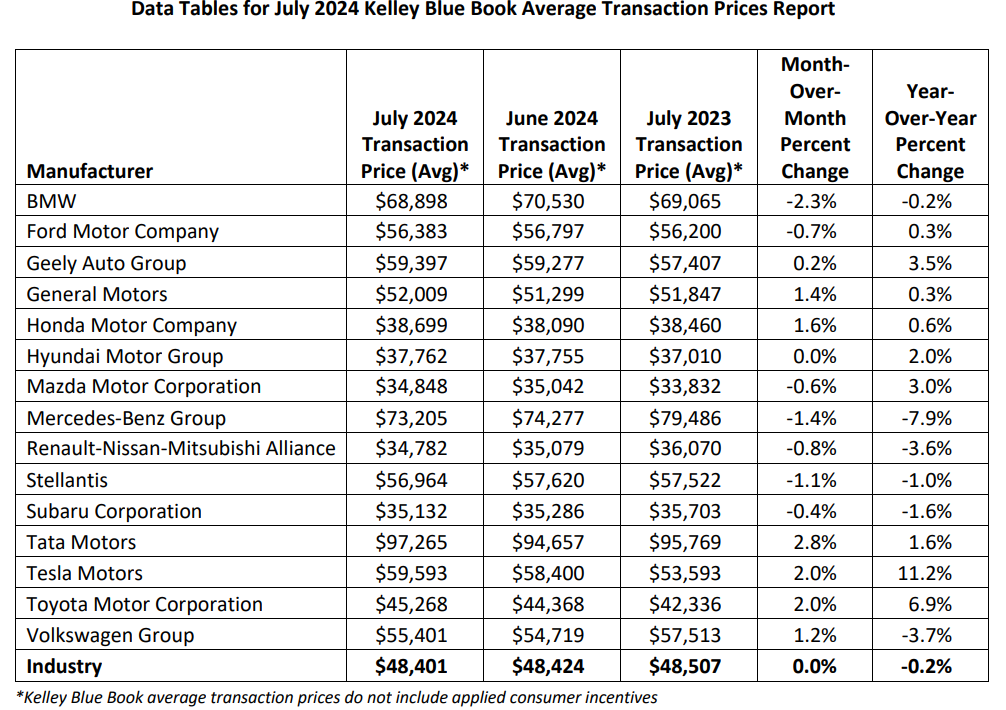
The average transaction price (ATP) for a new vehicle in the U.S. was $48,401.
- New-vehicle prices in July were mostly unchanged from the revised-lower June ATP of $48,424 (lower by $23) and last year ($106).
- New-vehicle ATPs were lower in July by 3.1% from the peak in December 2022 at $49,929
- Average incentives in July rose to 7.0% of the average transaction price – $3,383 – up from 6.4% in June and the most generous level seen in 2024
- The average transaction price for an EV in July, at $56,520, was higher than in June but lower year over year by 1.5%.
Used Vehicle
- Retail used-vehicle sales in July increased from June, rising by 27.6% month over month. A total of 1.6 million used vehicles were sold at retail – from both franchised and independent dealers – during July, up 16.5% year over year.
- Days’ supply for July was 41, down from a revised 53 days in June.
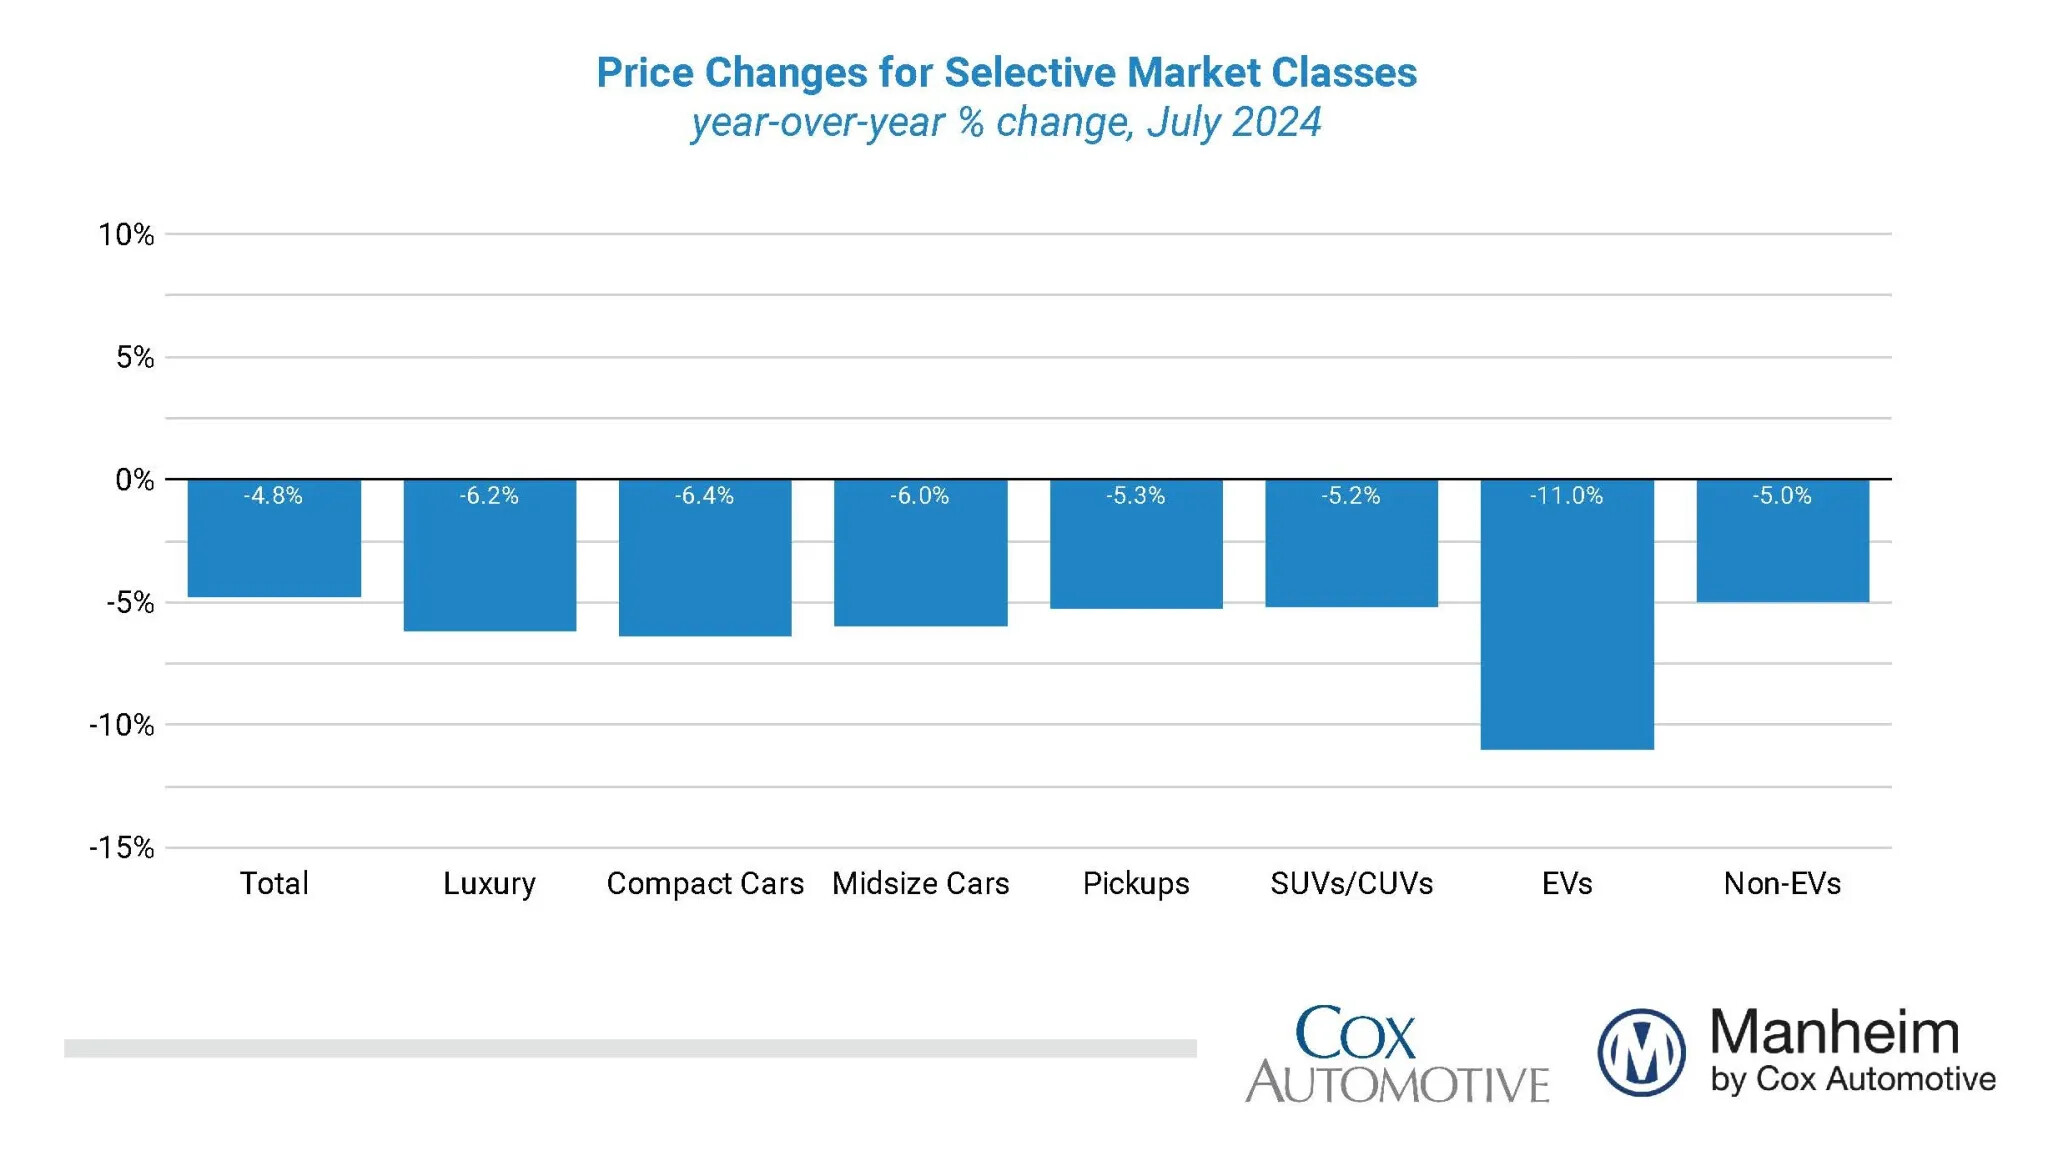
Prices
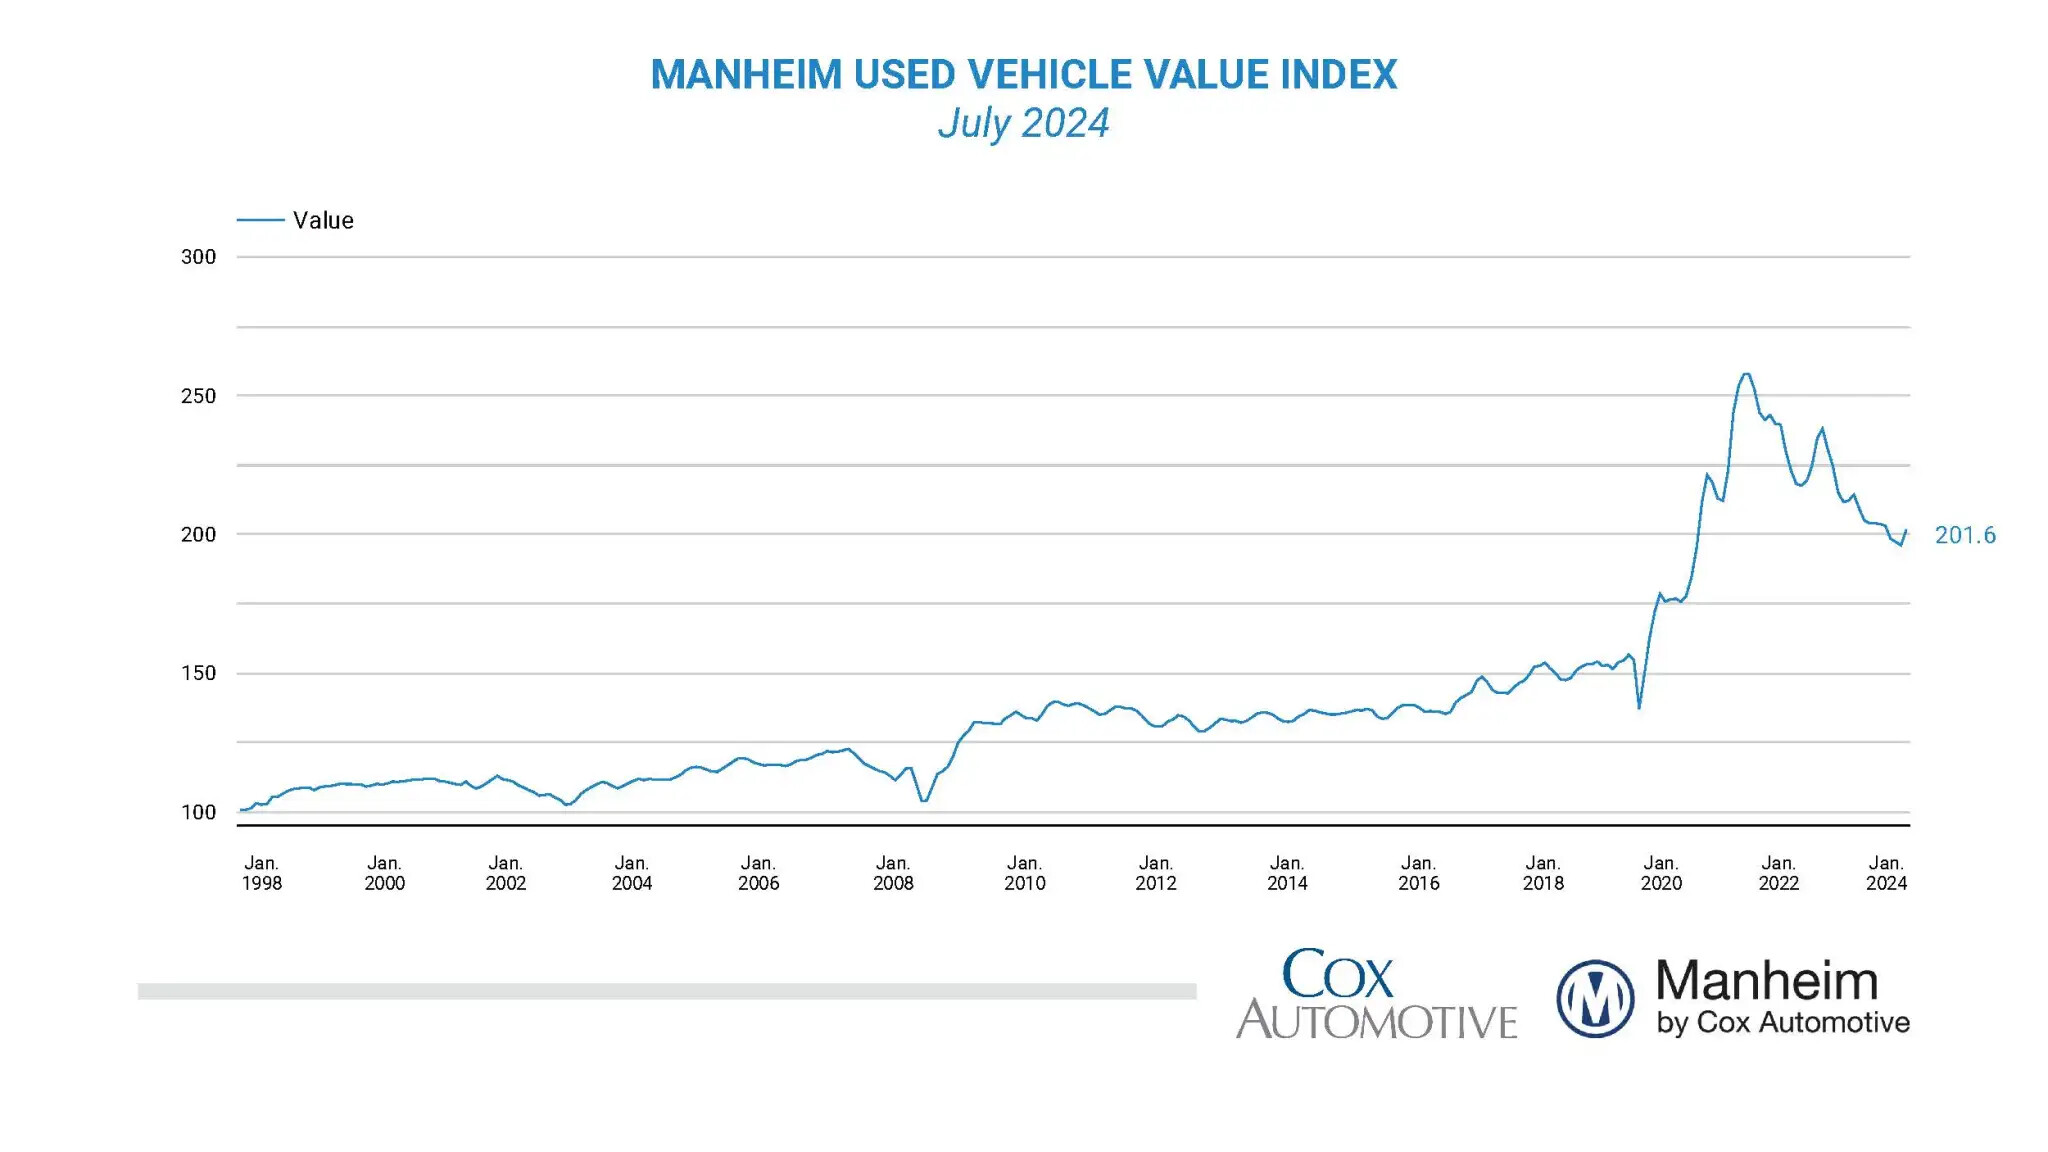
The Manheim Used Vehicle Value Index (MUVVI) rose to 201.6, a decline of 4.8% from a year ago.
- Values that rose 2.8% month over month.
- Over the last four weeks, the Three-Year-Old Index increased an aggregate of 1.1%, including a rise of 0.5% in the last week of the month.
1 Like