Main Article: Household Debt and Credit: US - InvestmentWiki
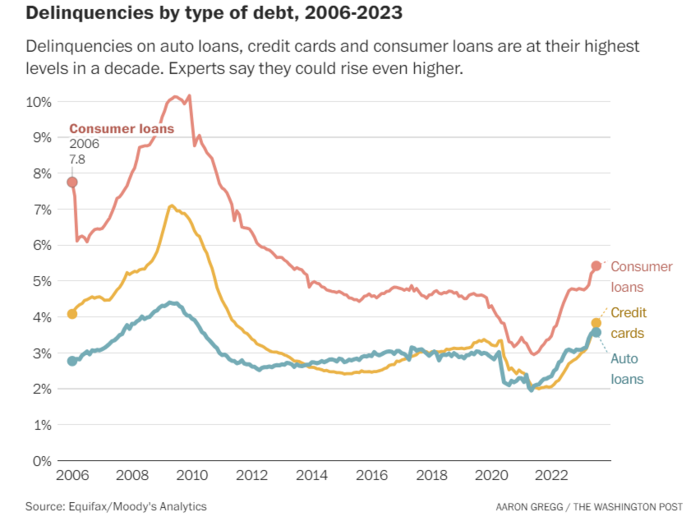
Delinquencies are rising already, even before major layoffs or unemployment rises.
“We’ve sped way past normal,” Mike Brisson, a senior economist at Moody’s Analytics, said in a recent webcast, calling the elevated delinquencies “very concerning.”
- Credit card delinquencies will continue to rise in the second half of the year. On top of rising interest rates and student loan repayments, higher energy and electricity bills in the fall and winter will add to some consumers’ debt loads.
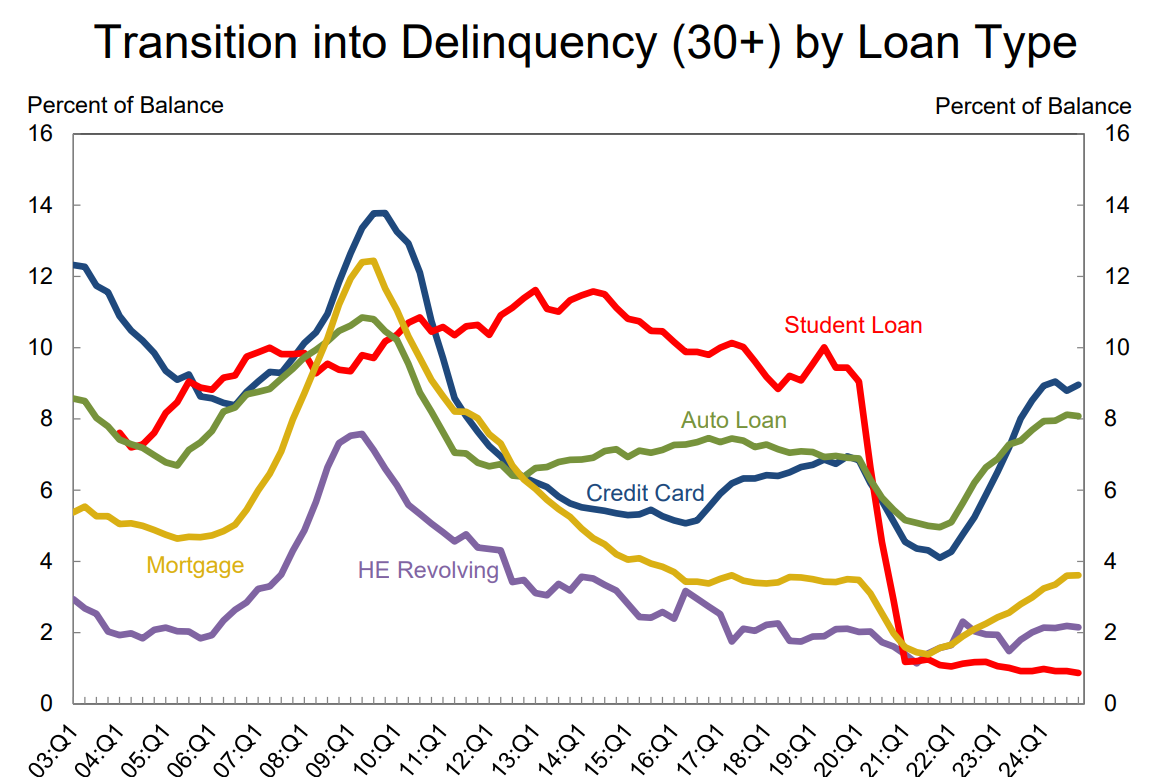
- Delinquencies on auto loan payments, which have already hit rates last seen during the financial crisis of the late 2000s, are also likely to keep climbing, credit experts said.
- During the financial crisis, 5 percent of subprime borrowers were 60 days or more past due on their loans; that number today stands at close to 7 percent, according to data from Equifax.
2 Likes
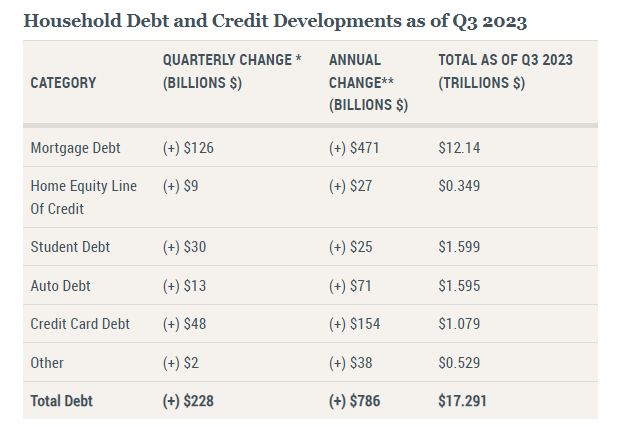
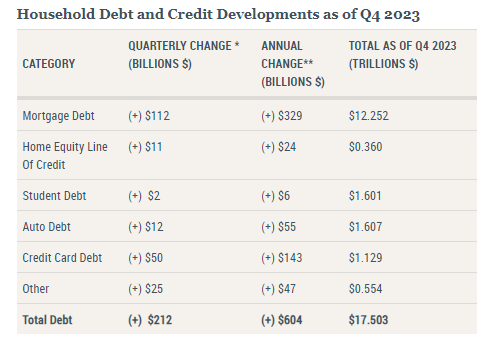
Significant increase in consumer debt during Q3, being led by mortgage debt.
“Credit card balances experienced a large jump in the third quarter, consistent with strong consumer spending and real GDP growth,” said Donghoon Lee, Economic Research Advisor at the New York Fed. “The continued rise in credit card delinquency rates is broad based across area income and region, but particularly pronounced among millennials and those with auto loans or student loans.”
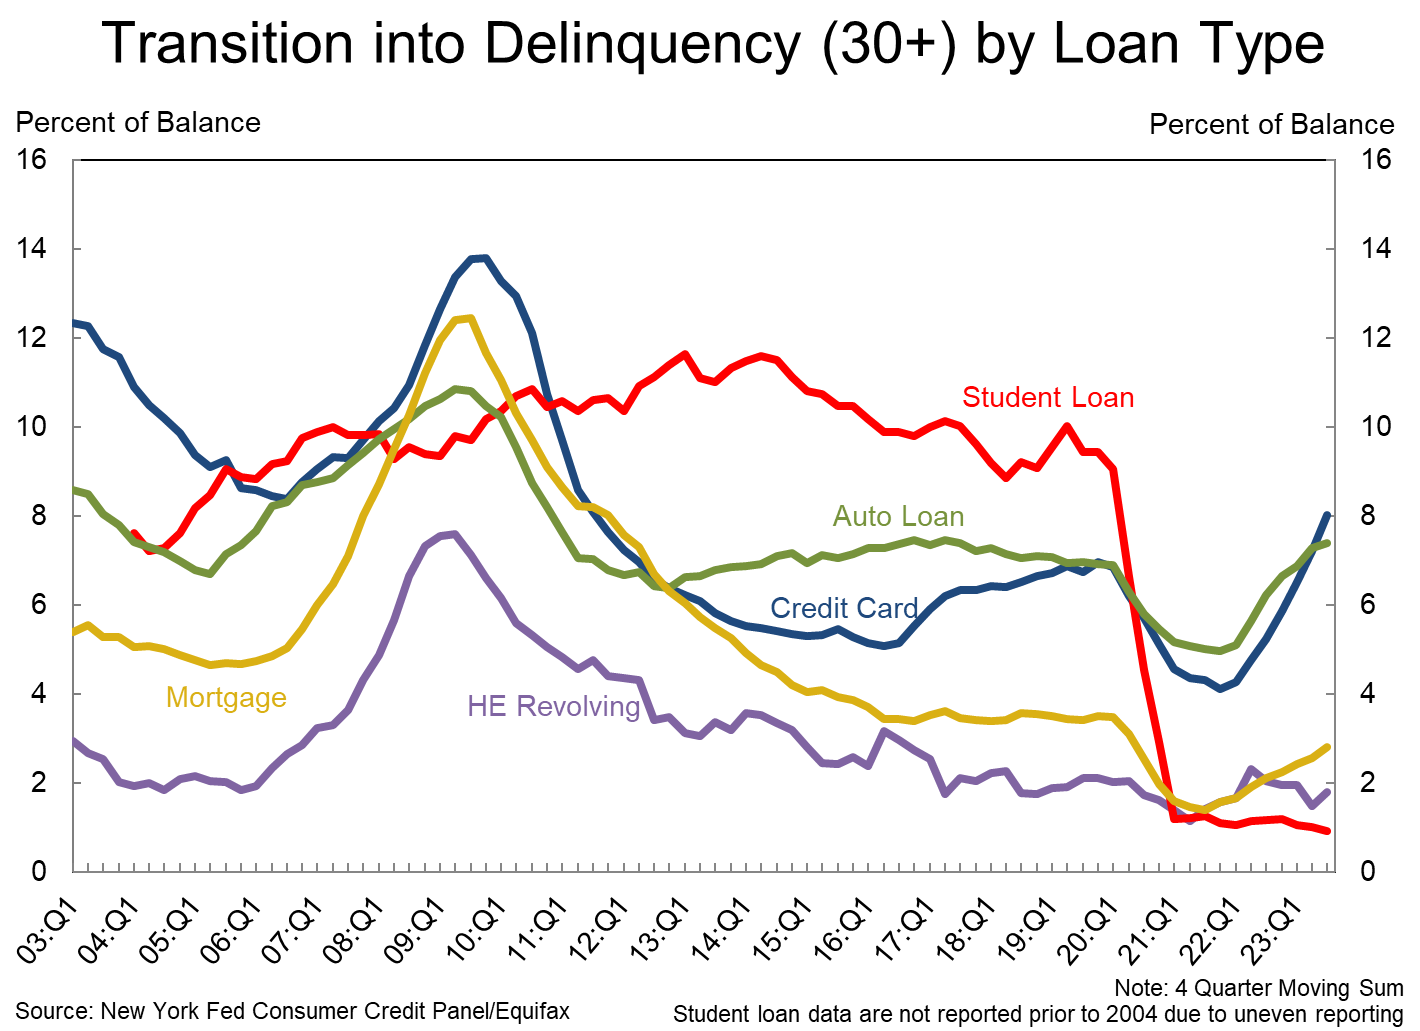
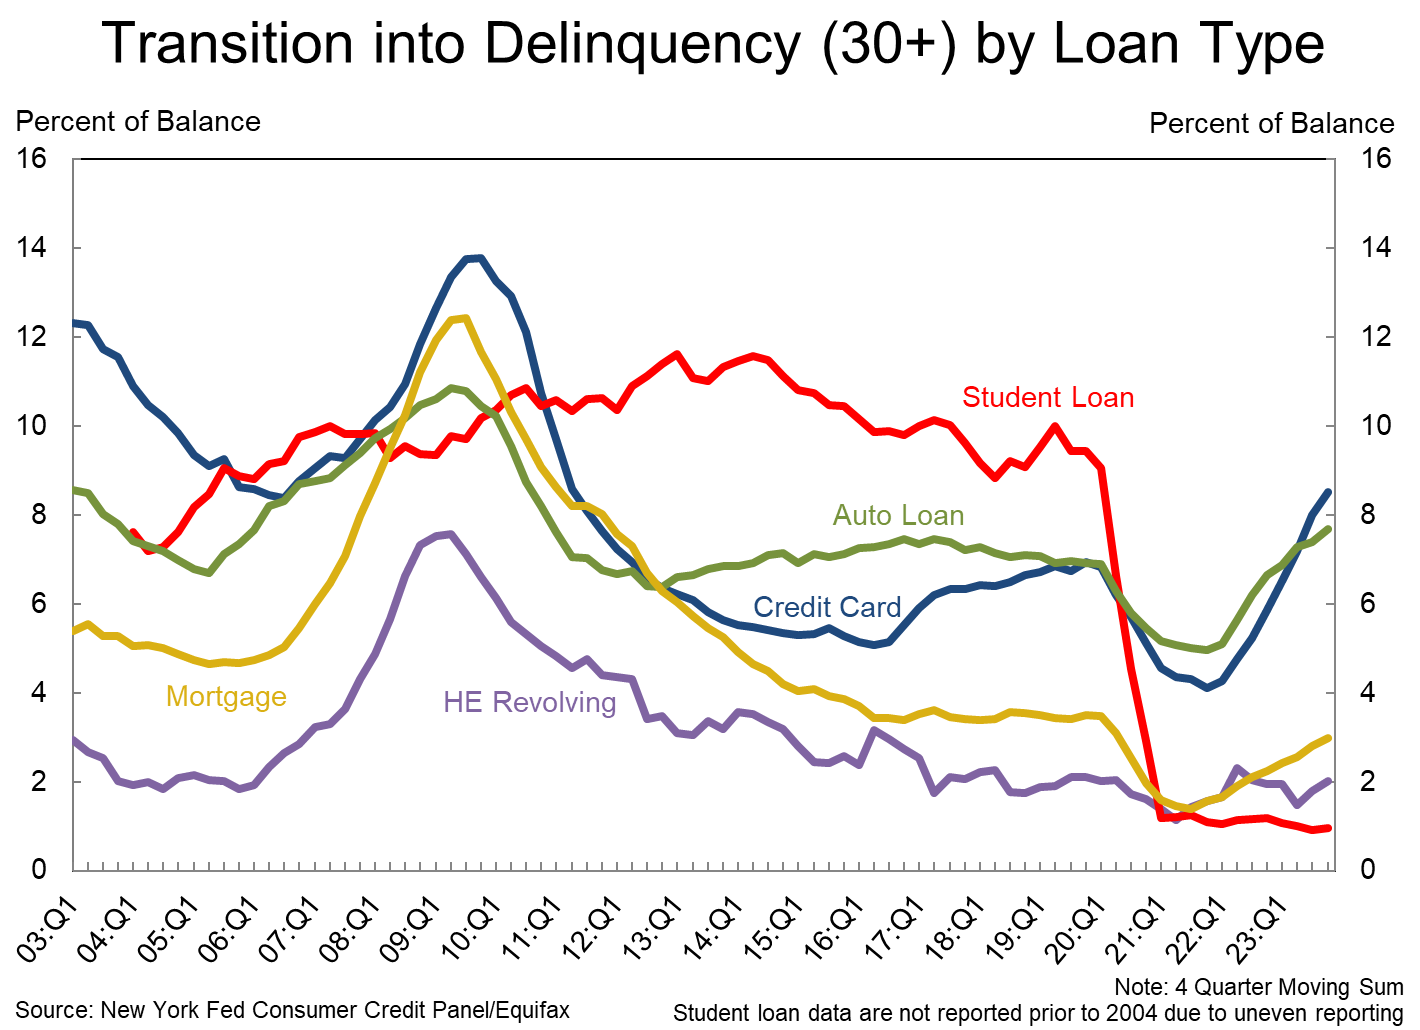
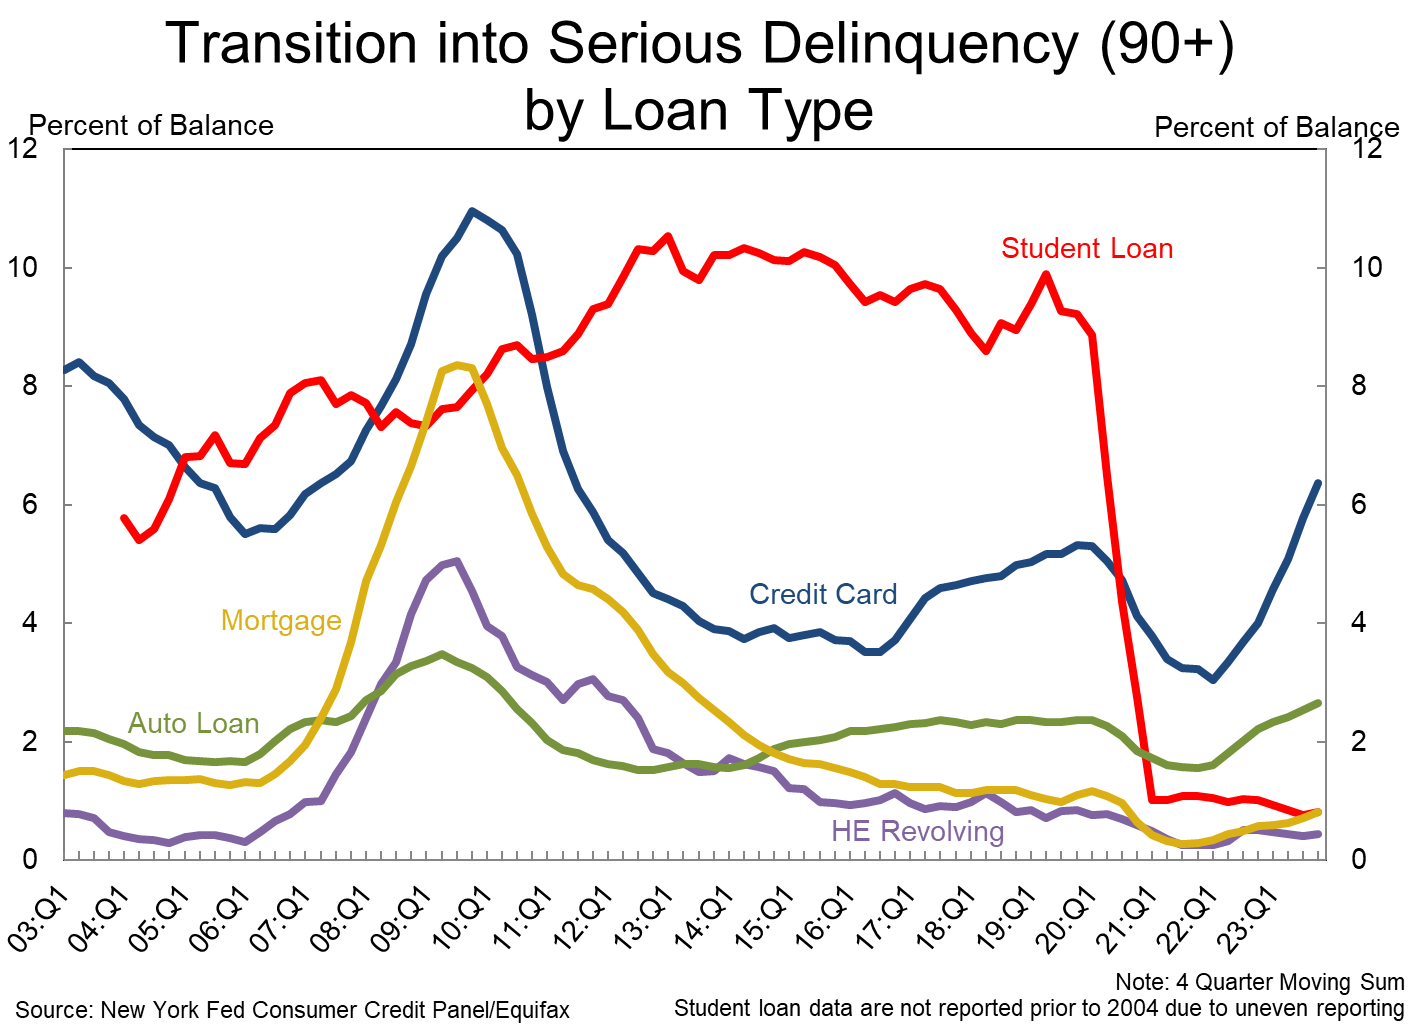
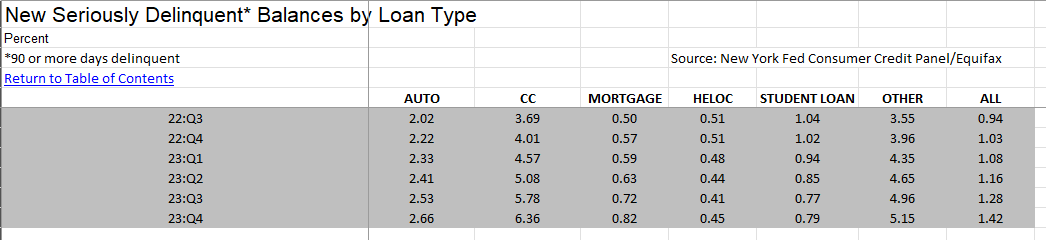
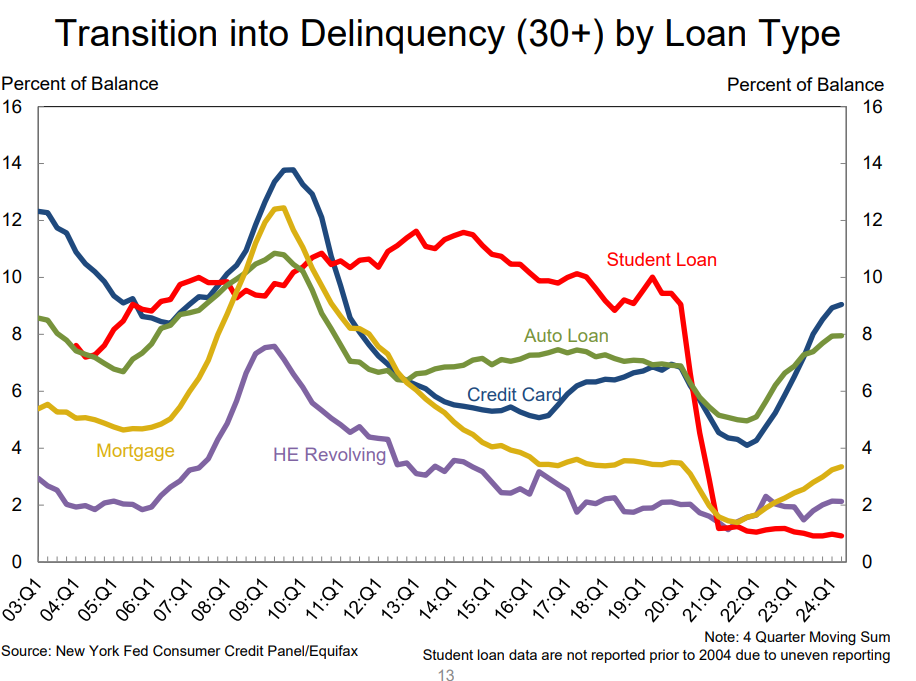
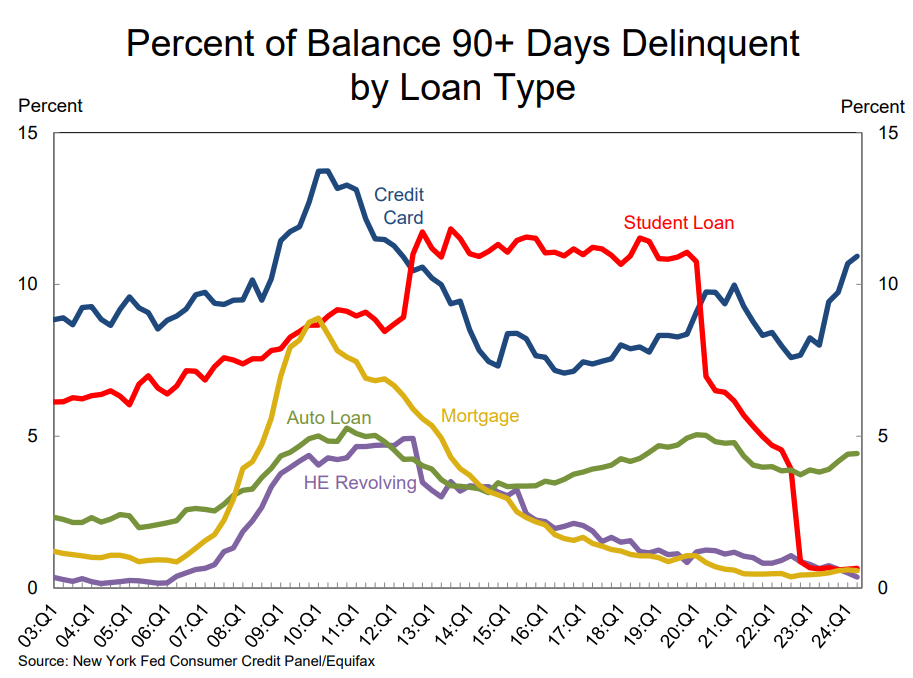
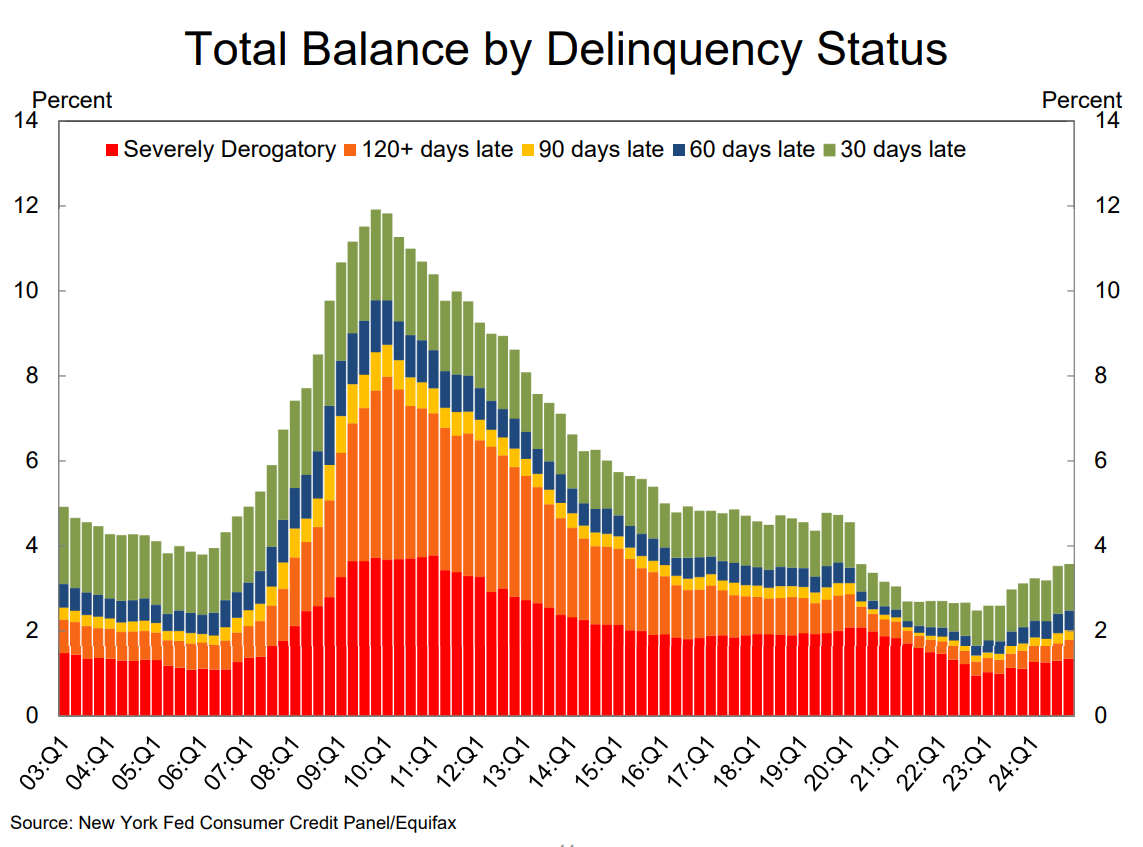
Transitions into new and serious delinquency continue to increase, especially for credit cards and autos, above pre-pandemic levels. However, despite the increase the total percent balance for serious delinquencies continues to be below it for now.
Interesting to me is that this sharp increase in transitions, was also experienced before 2008/2009.

https://www.newyorkfed.org/newsevents/news/research/2023/20231107
1 Like
Pretty Interesting data
1 Like
Household debt increased by 604 Billion in 2023, a 3.5% increase.
Delinquencies continue to deteriorate.
“Credit card and auto loan transitions into delinquency are still rising above pre-pandemic levels,” said Wilbert van der Klaauw, economic research advisor at the New York Fed. “This signals increased financial stress, especially among younger and lower-income households.”
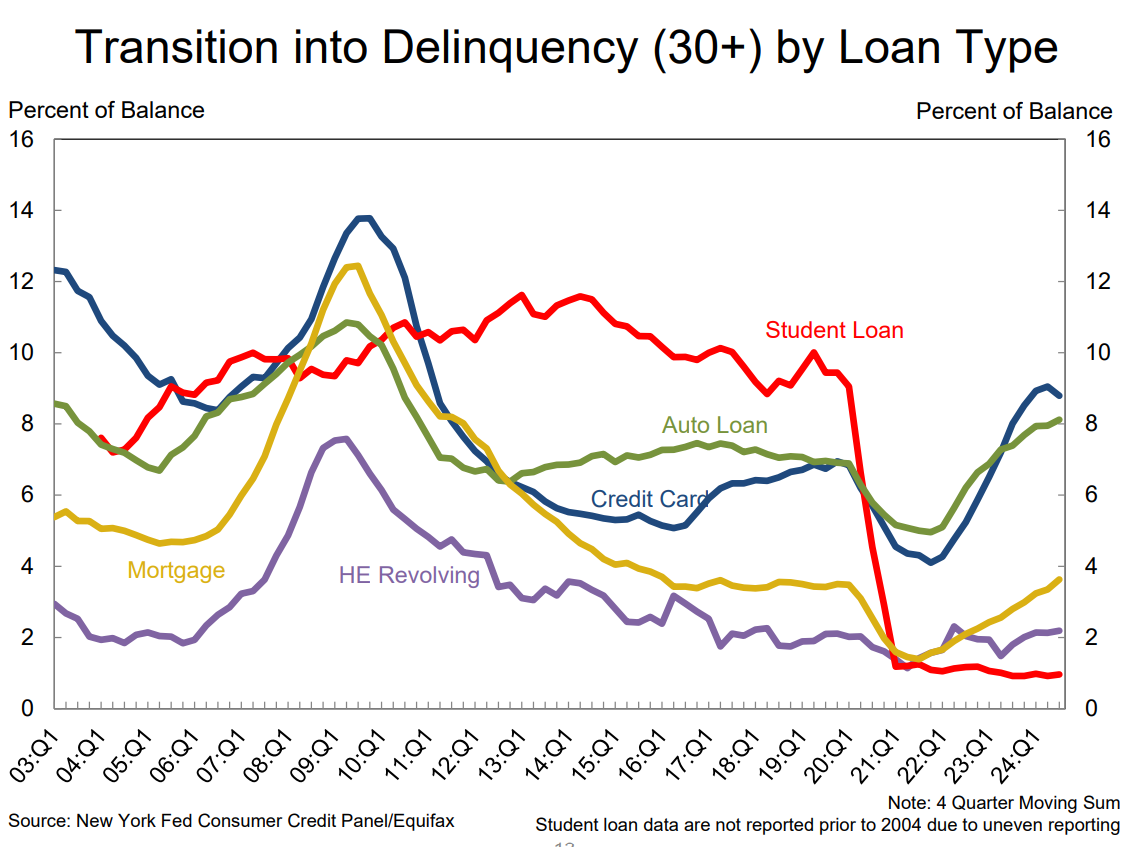
Transition into delinquency for CC and Auto Loans, very significant increase.
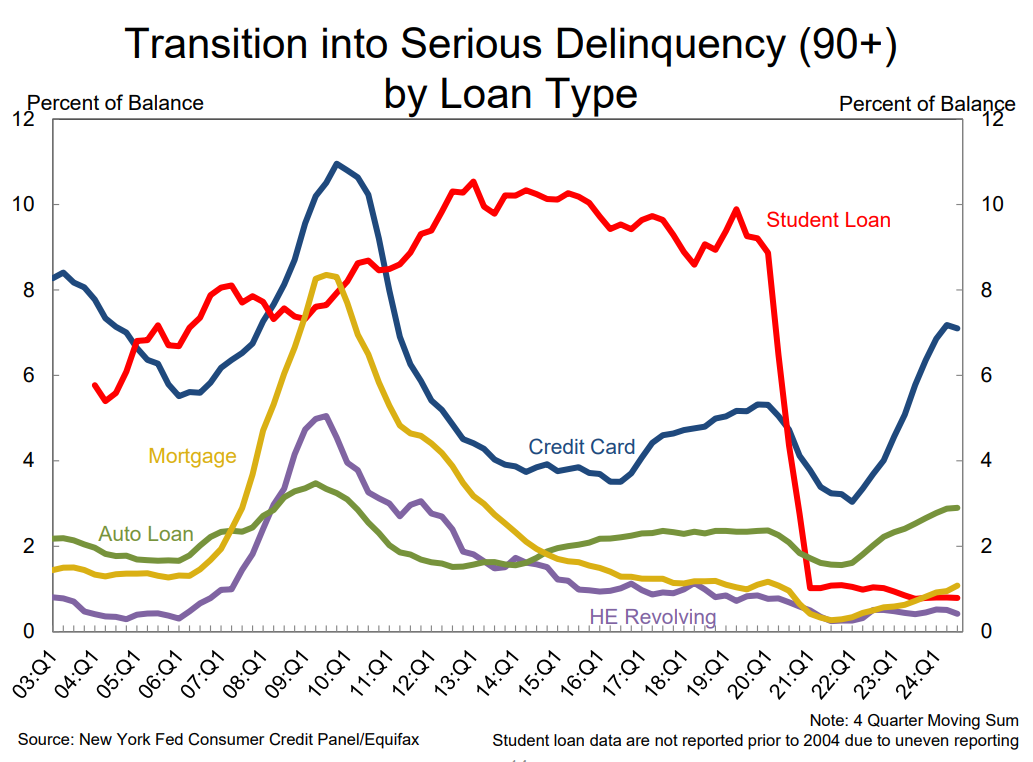
Transition into serious delinquency has increased for CC, but Auto Loan still low.
https://www.newyorkfed.org/newsevents/news/research/2024/20240206
1 Like
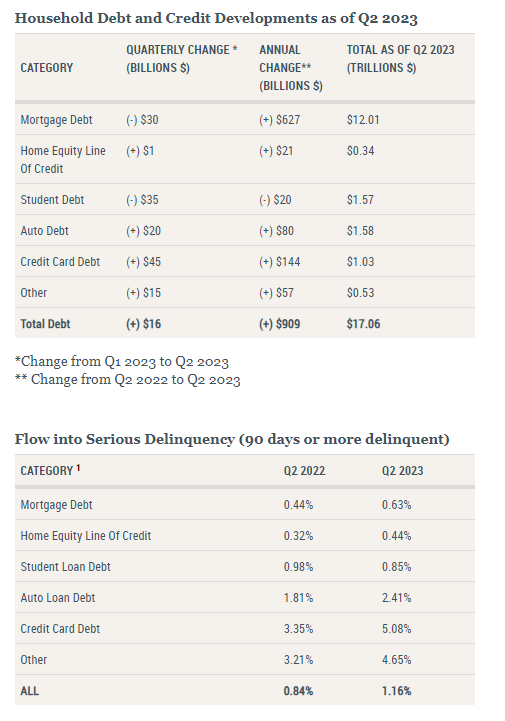
Household debt continues to increase, however, growth has slowed significantly from Q1 to Q2 2023, 0.1% vs 0.9%. While delinquencies rose for credit card and auto loans, especially for borrowers below 40.
https://www.newyorkfed.org/newsevents/news/research/2023/20230808
https://www.newyorkfed.org/medialibrary/interactives/householdcredit/data/pdf/HHDC_2023Q2
1 Like
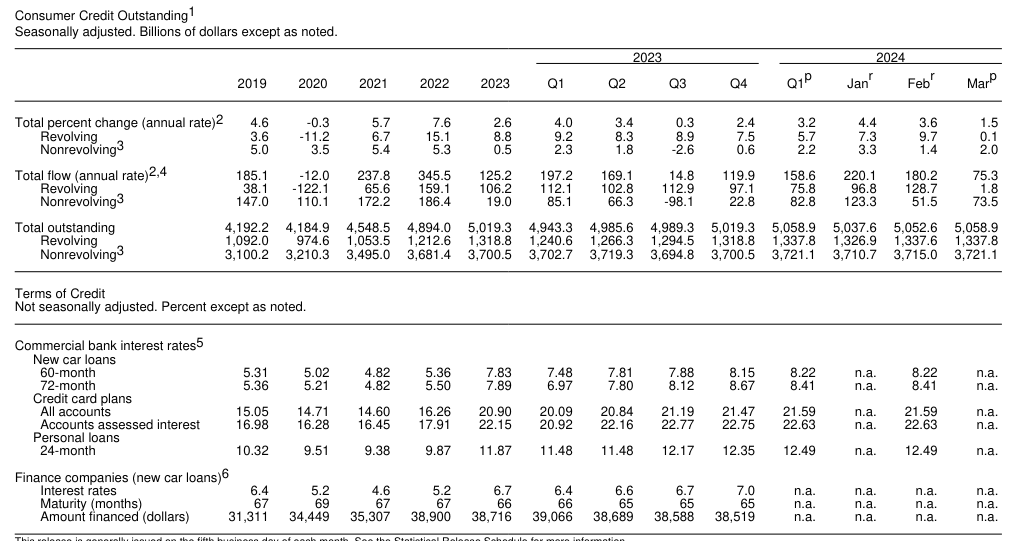
Consumer credit (revolving and non-revolving only) ended Q1 2024 at 5,059 B, 40B added during the quarter.
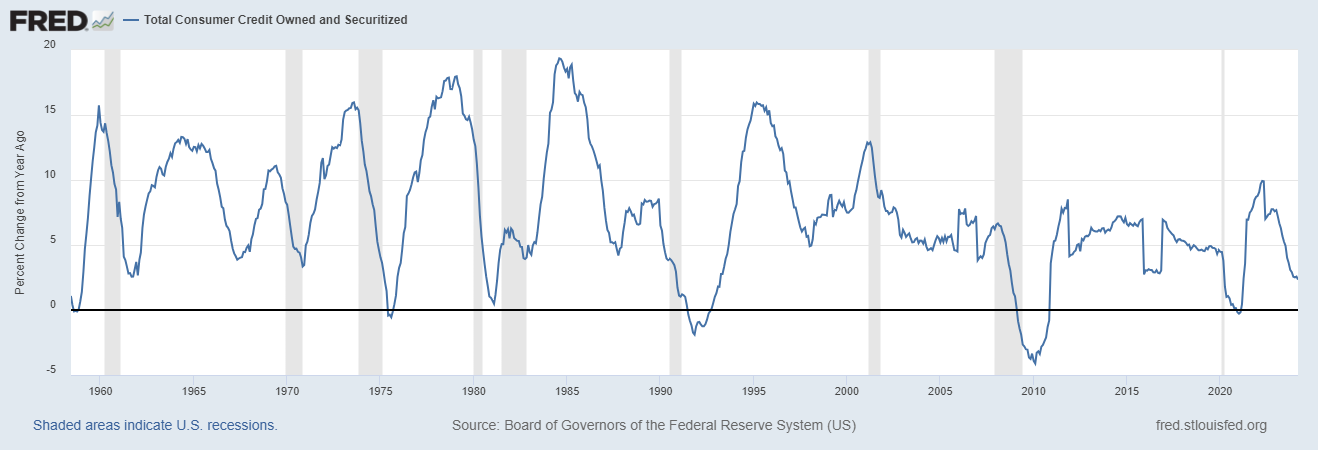
- The growth rate for credit has deaccelerated to only 2.34 Y/Y, but it has stabilized a bit more in the last few quarters.
- Interest rates on auto loans over 8% in Q1 2024, from 7.83% in 2023, and 5.31 in 2019.
- Interest rates on credit card at 21.6% (highest on record) in Q1 2024, from 20.90% in 2023 and 15% in 2019.
As a reference, consumer credit Q1 2024 grew 40B vs 226B for consumer disposable income.
While income is currently the primary source of consumer spending growth, credit is not completely insignificant either.
And over time, it depends on the corresponding growth rates, as an eg. 2022 income had barely 38B more, while consumer credit grew 345B.
1 Like
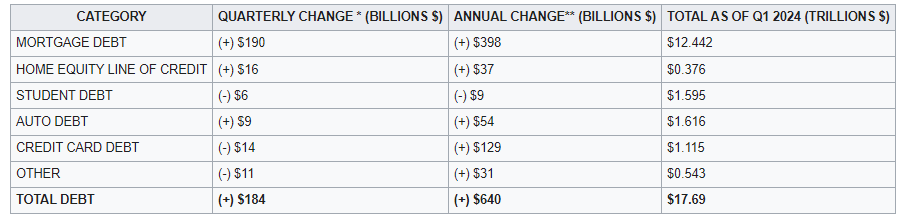
Total household debt increased by $184 billion (1.1%) in the first quarter of 2024, to $17.69 trillion, mostly due to mortgage debt since consumer credit has been slow on Q1 2024.
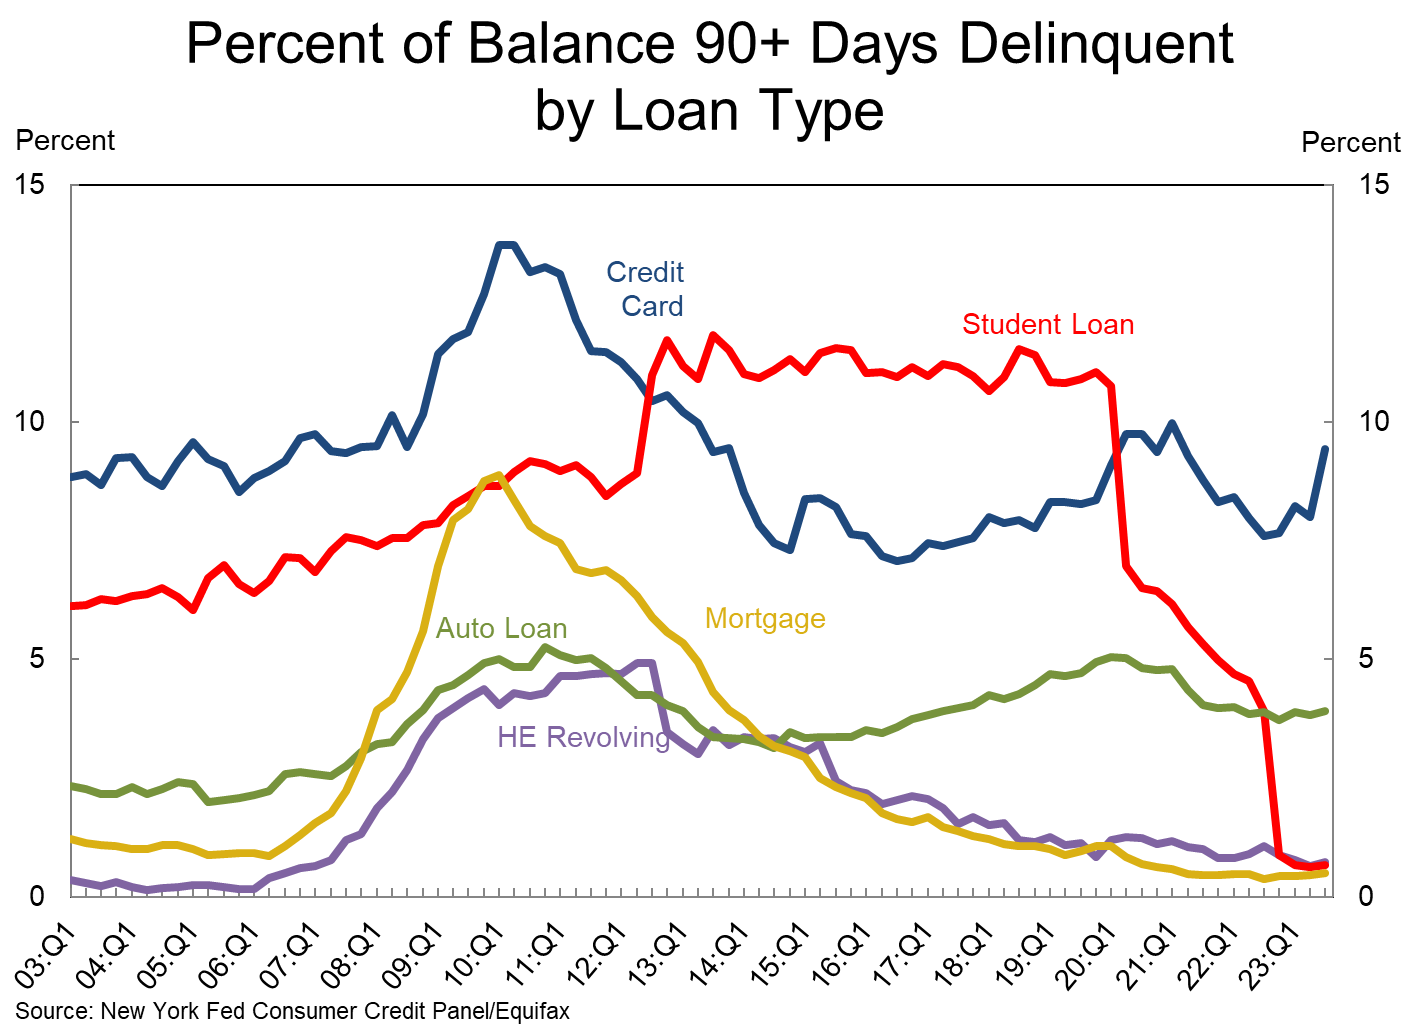
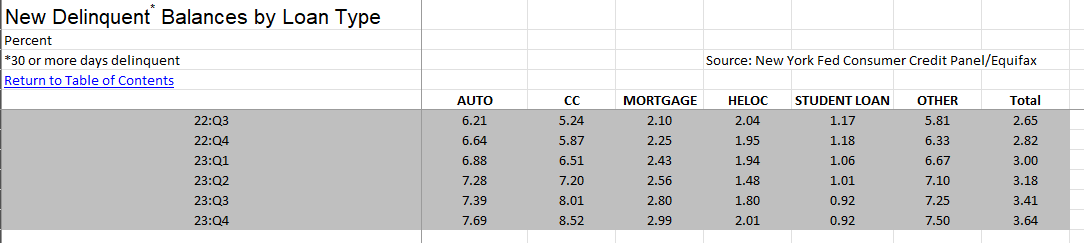
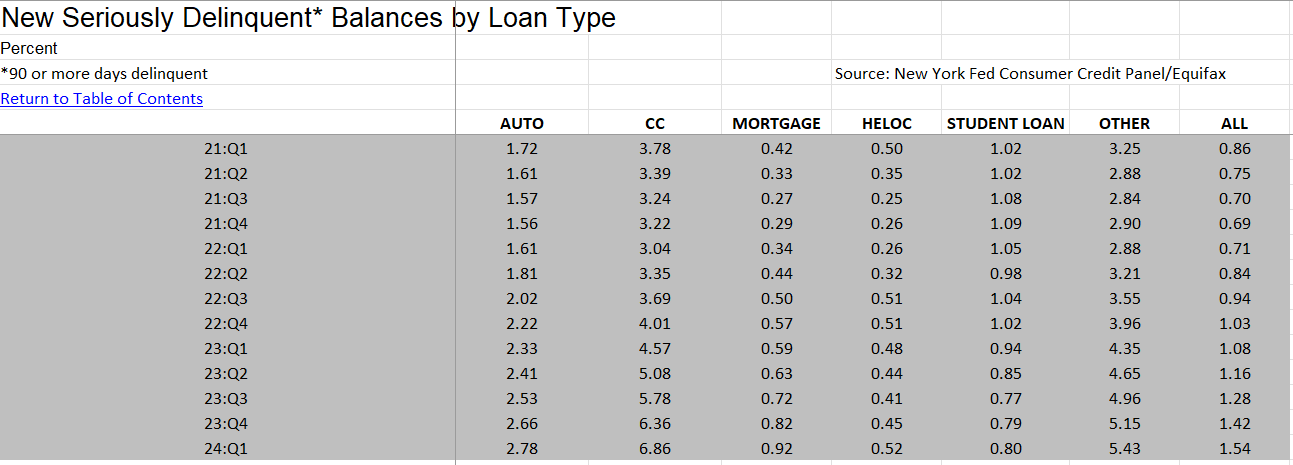
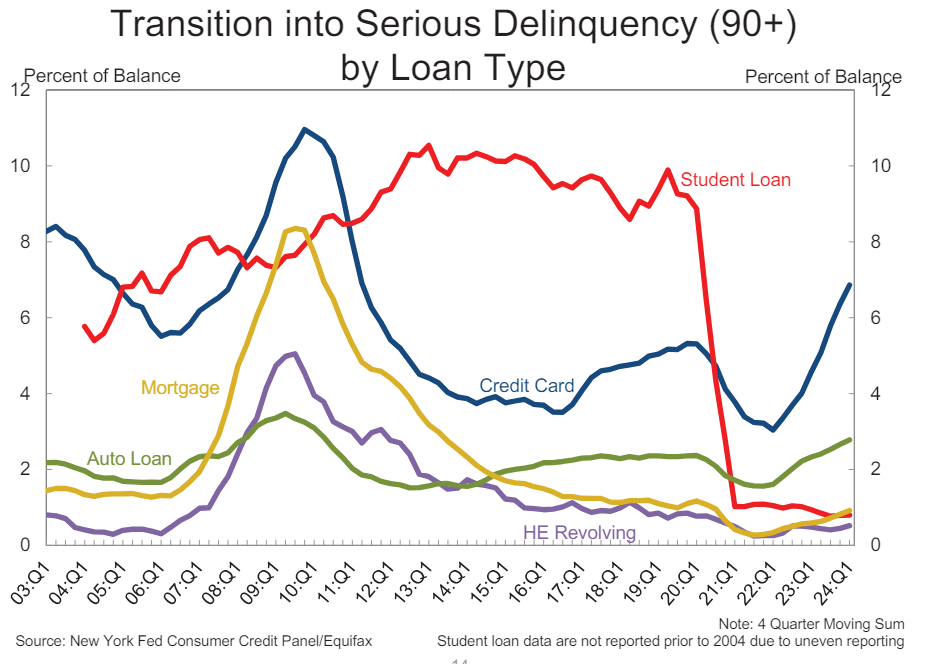
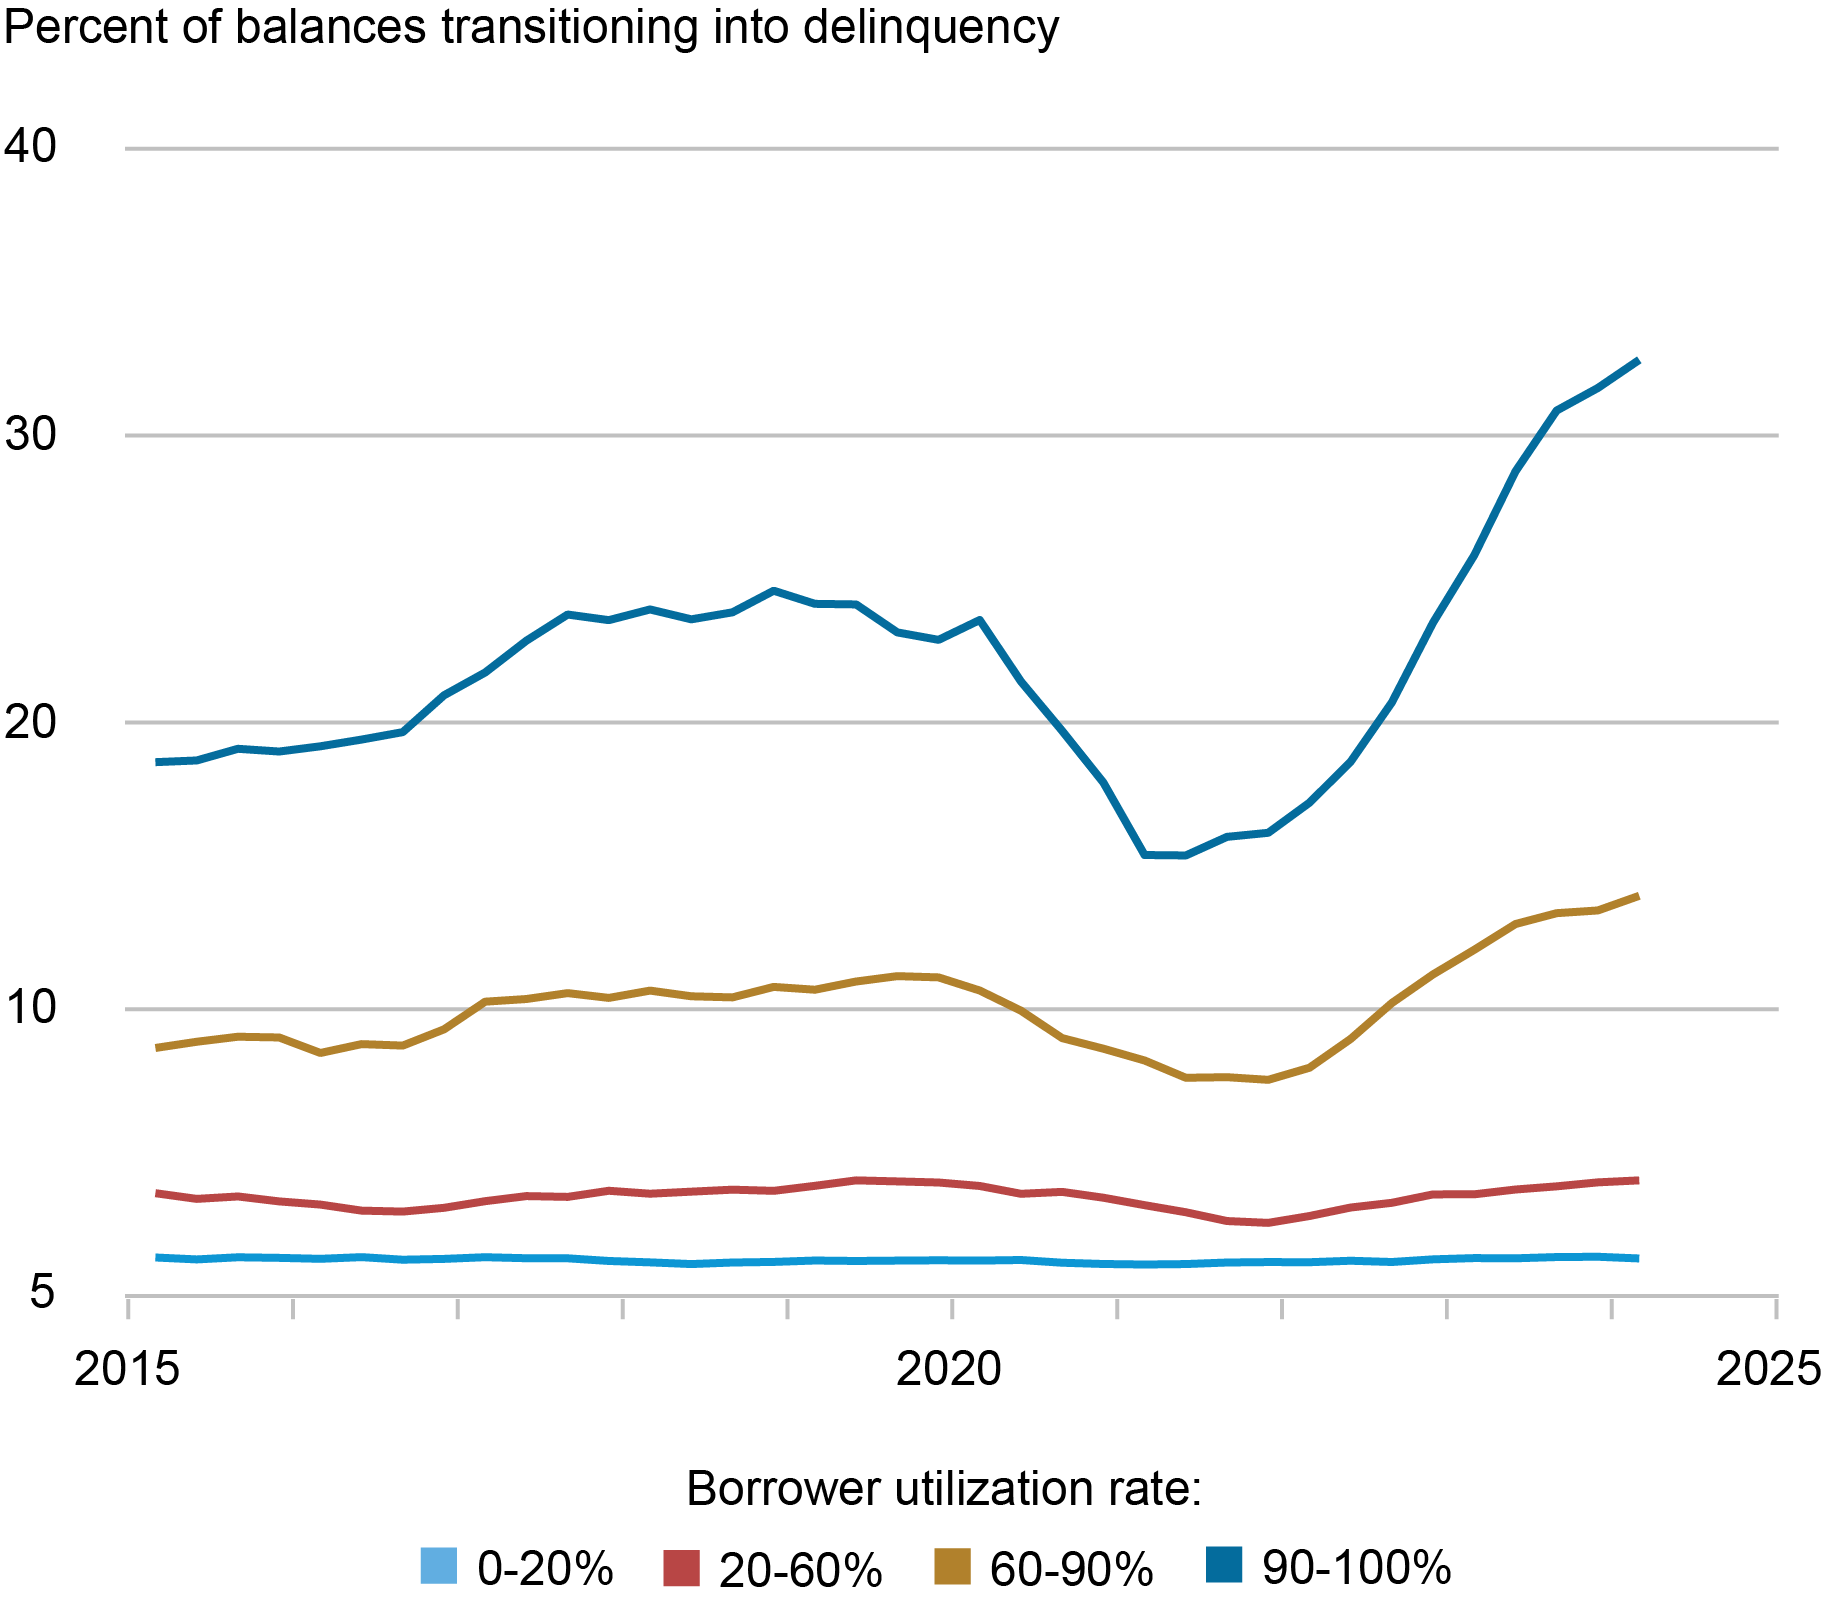
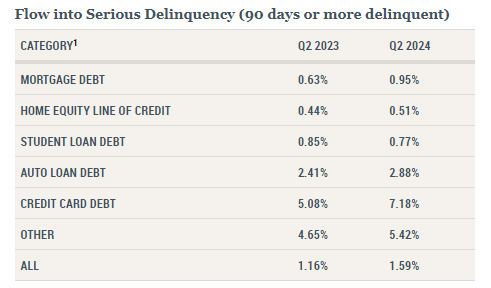
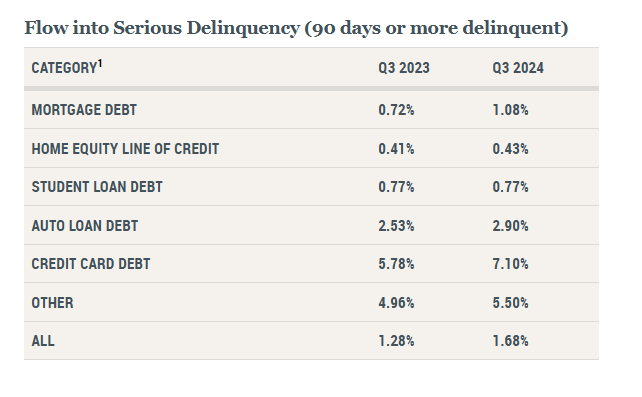
Flow into serious delinquencies continues to increase, particularly on credit card and auto loans and the Other category (sales financing, personal loans, and Retail loans). Other types of debt flow into delinquencies remain low.
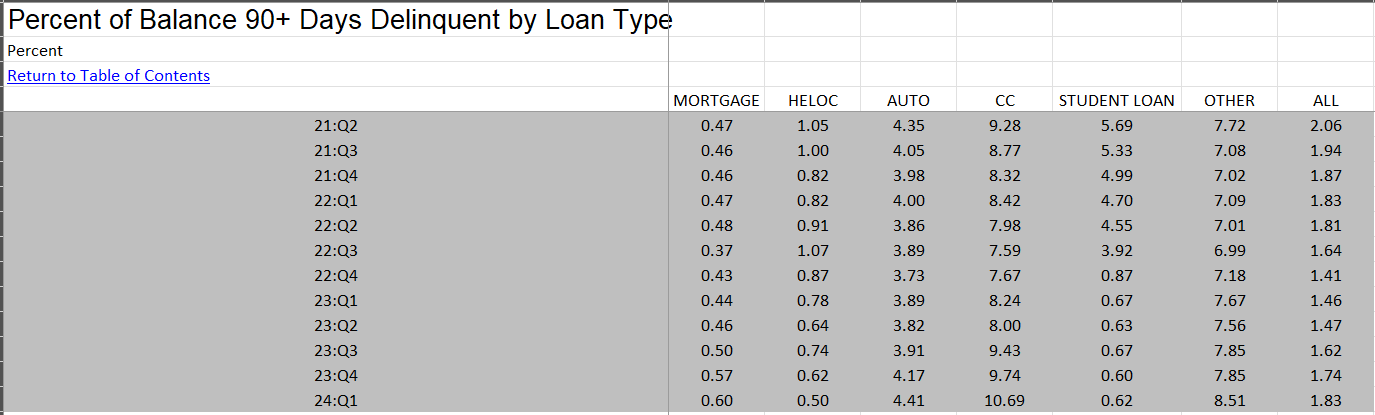
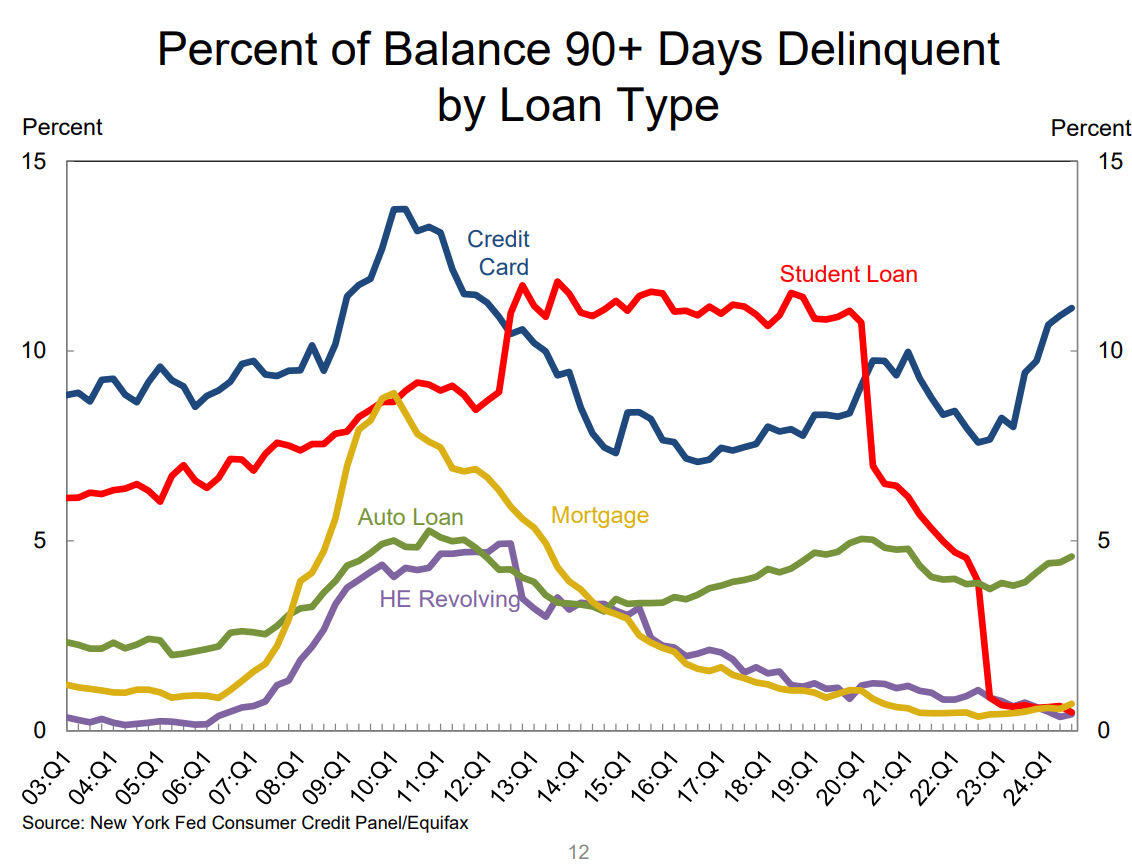
90+ days delinquent balances are particularly high for credit card debt at 10.69%.
The Other category is also high.

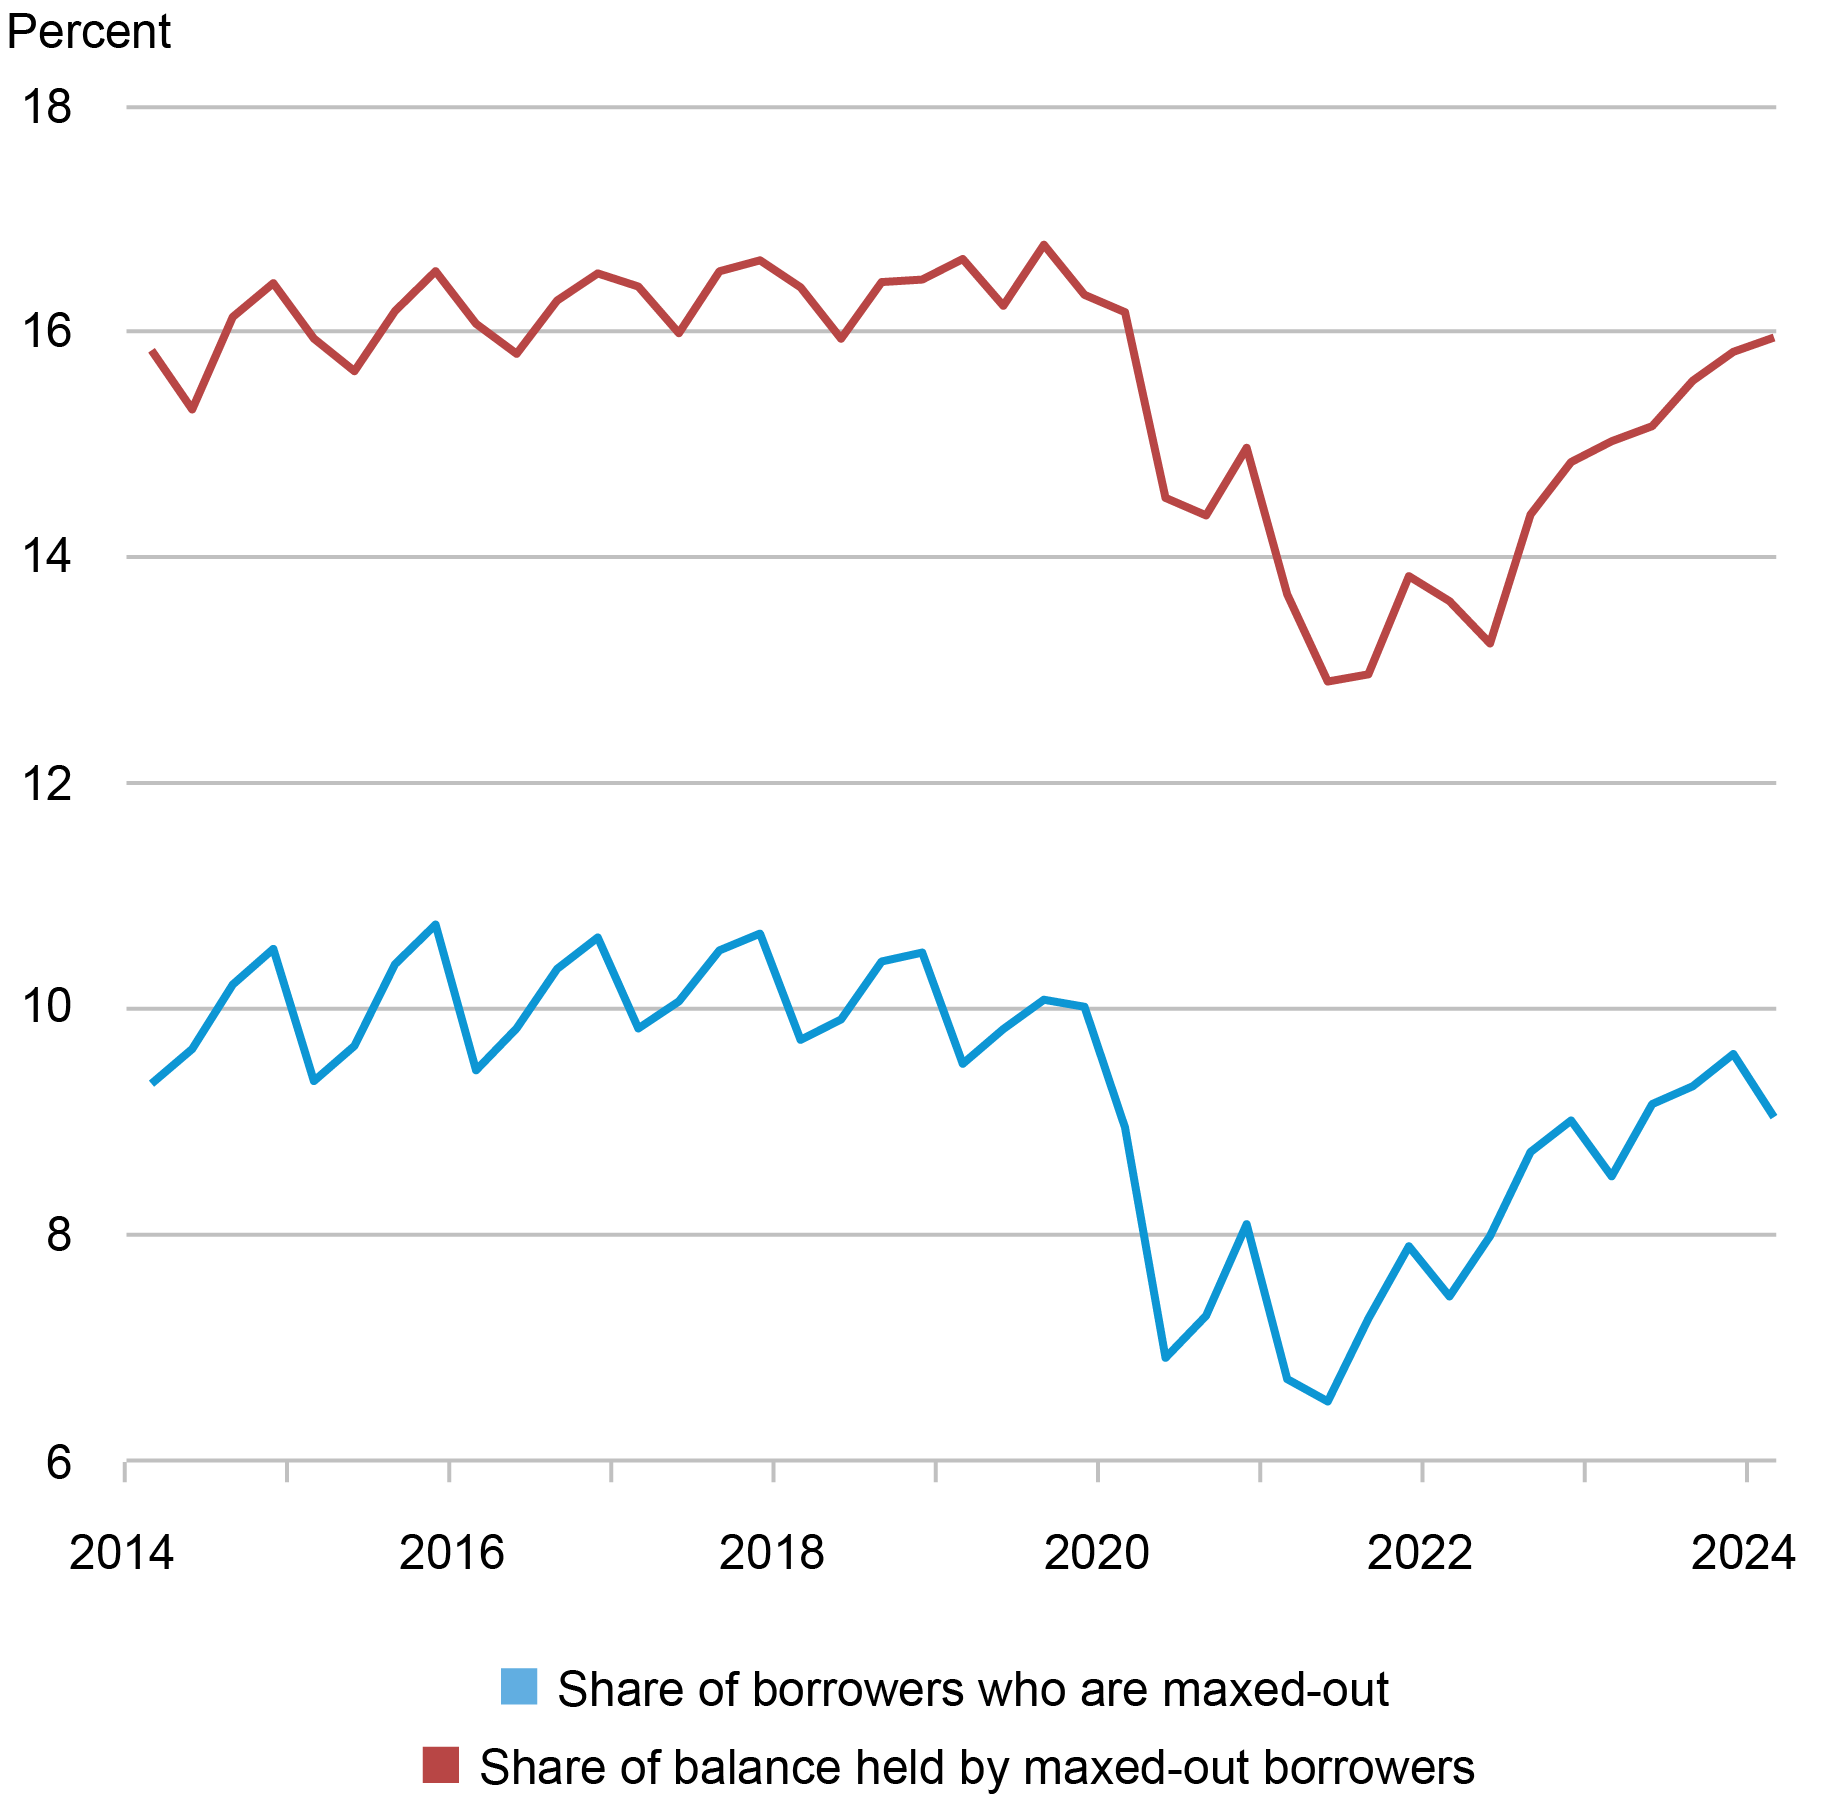
According to their NY FED study, credit card delinquencies are likely to continue to rise, since the share of consumers that are maxed out, and their transition rates are increasing, with no signs of improvement.
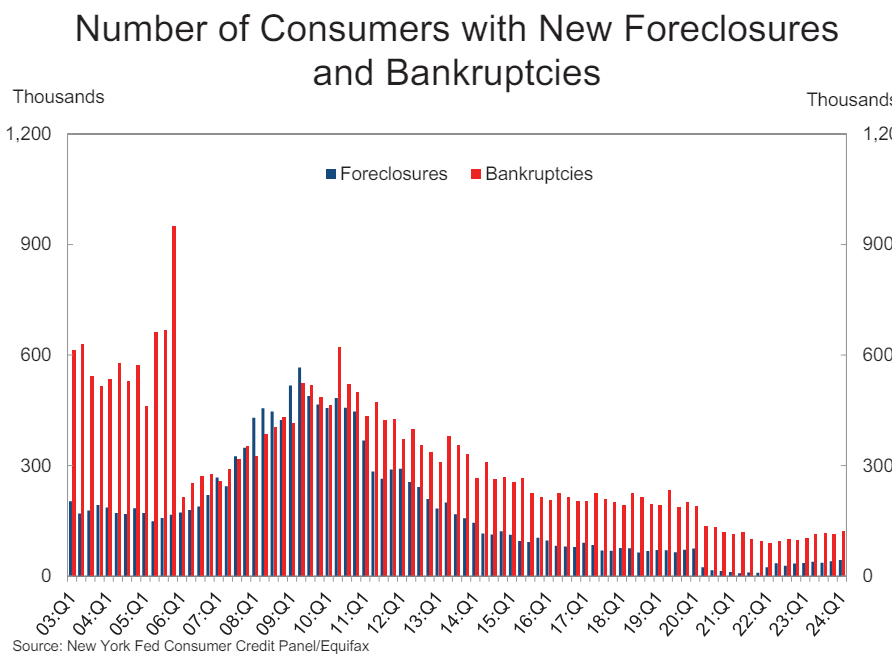
New bankruptcies and foreclosures remain low, but increasing.
https://www.newyorkfed.org/medialibrary/interactives/householdcredit/data/pdf/HHDC_2024Q1
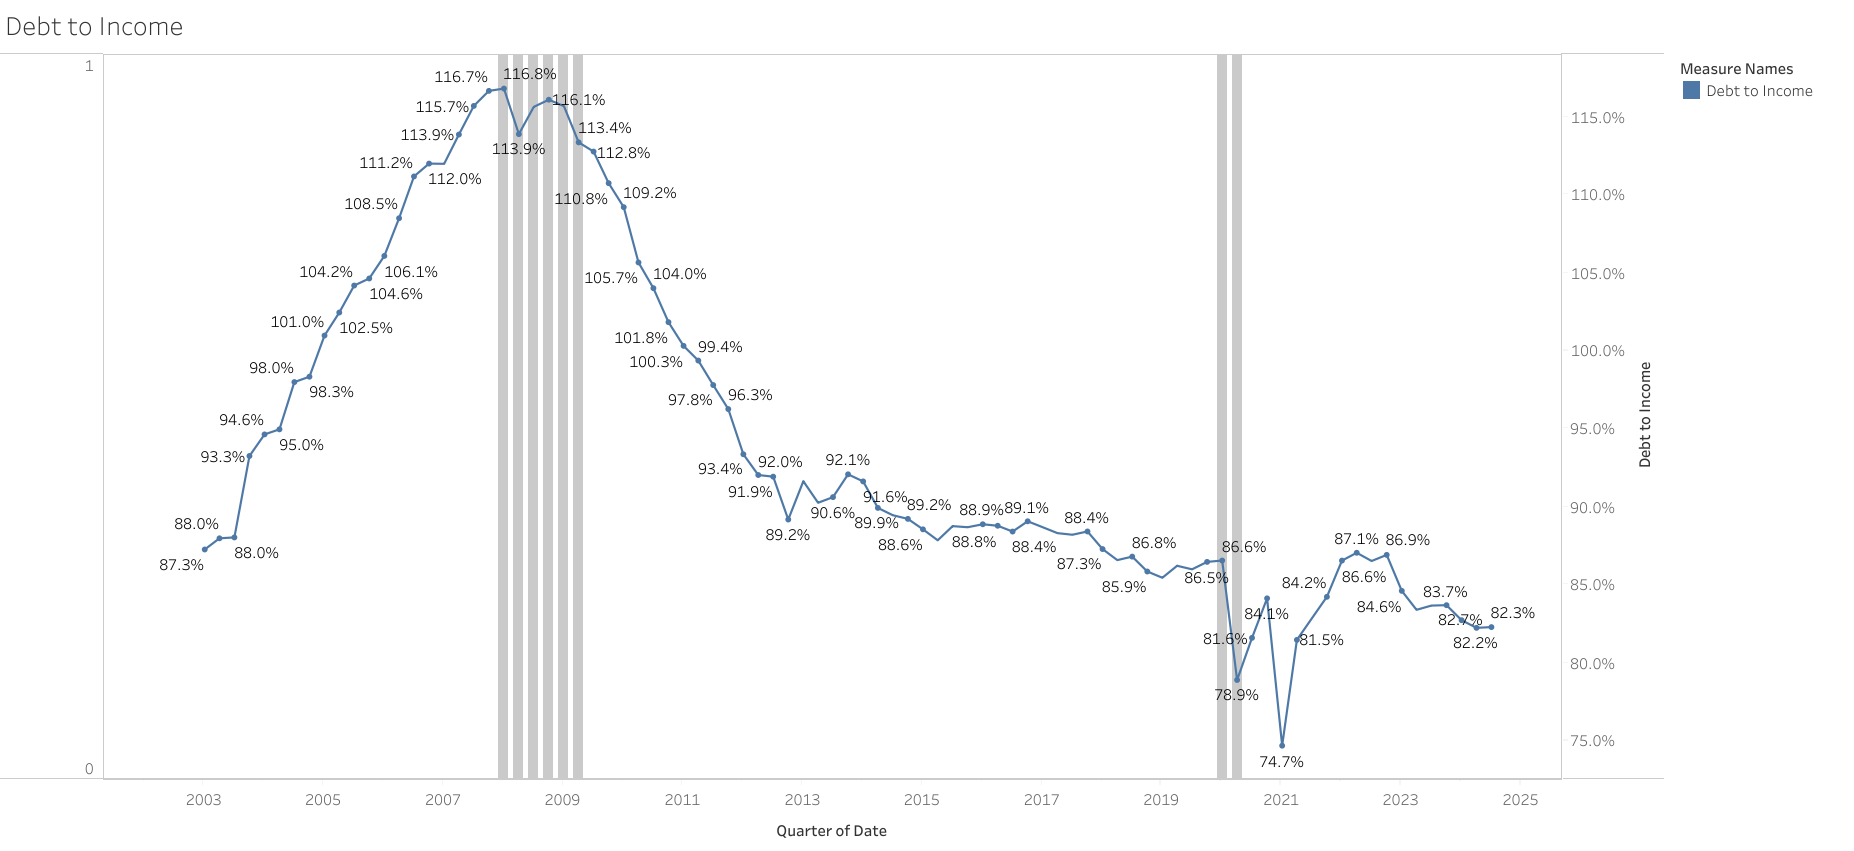
Consumer debt to Income levels in the US, while still high have come down significantly since the 2008 financial crisis. Showing at least a significantly better standing than during that period.
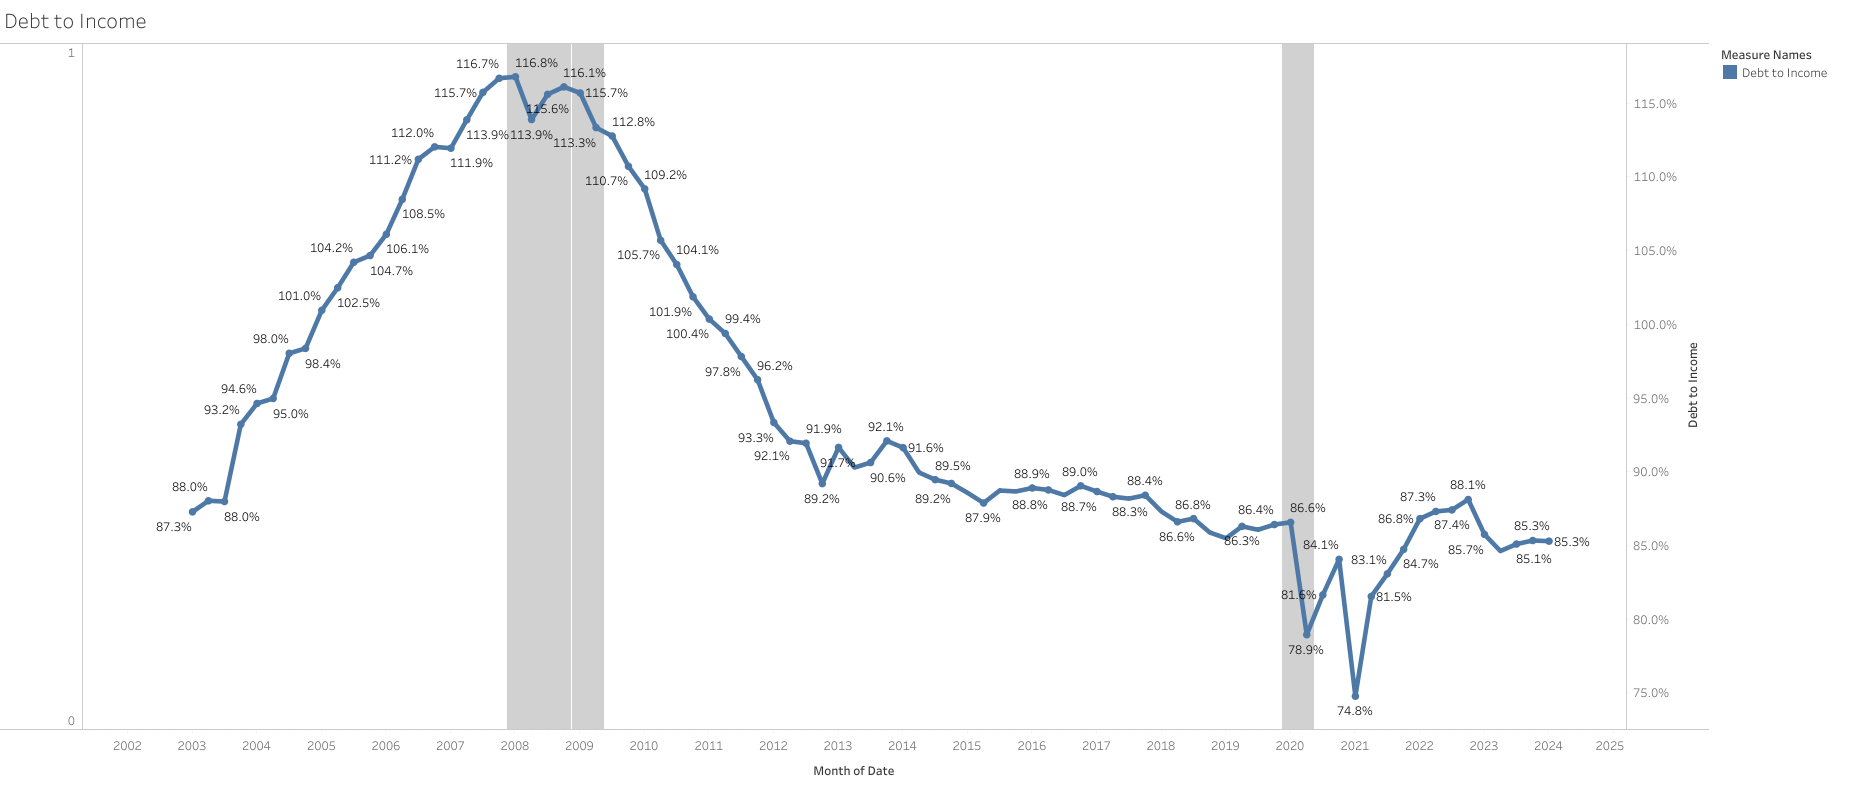
Debt service payments to income show a similar pattern.
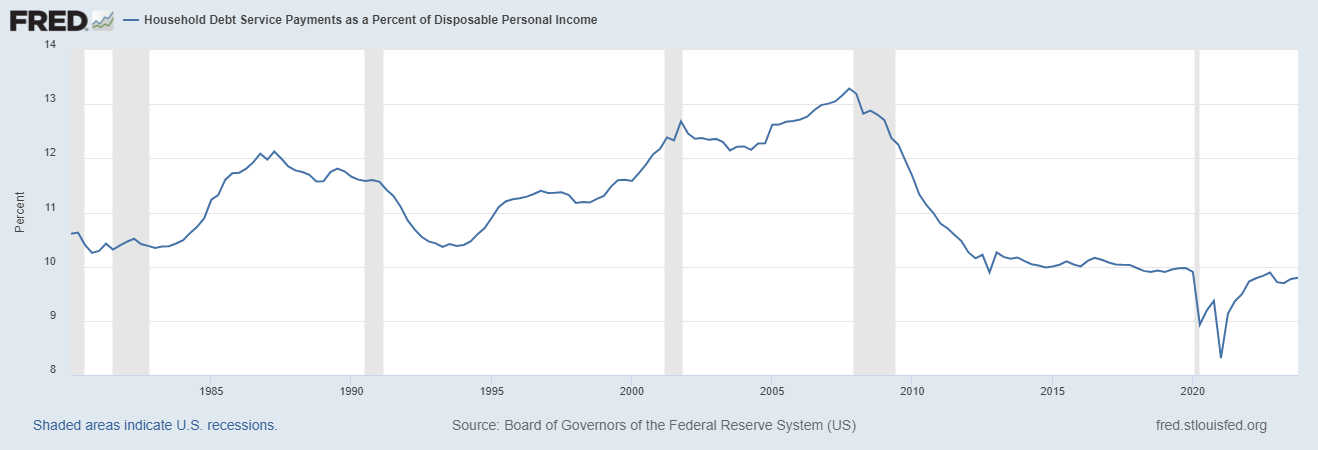
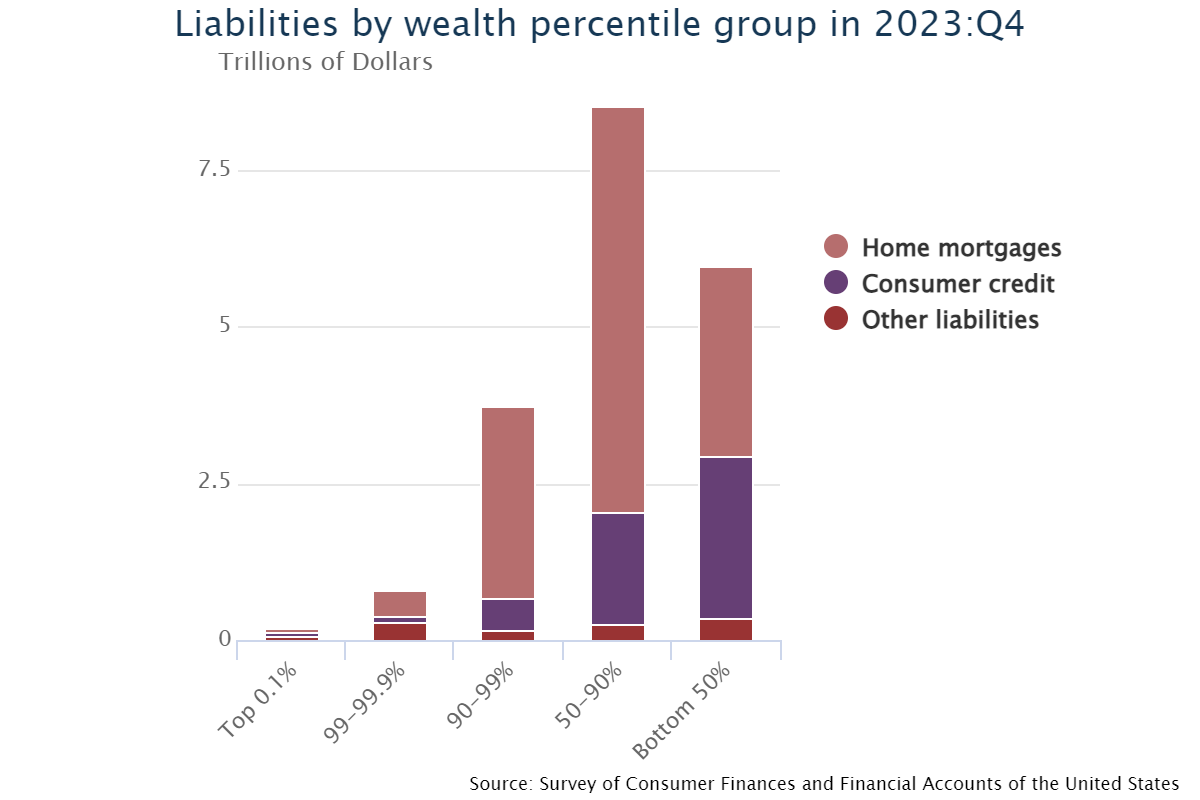
However, it is important to mention this is aggregate data, and that it is most likely skewed for the richest cohorts.
Most of the debt is concentrated on the less wealthy, who would struggle the most in a decline in income.
A better consumer balance sheet however does not mean that short-term or temporary difficulties could be encountered, as can be seen in delinquencies for some consumer debt reaching levels not seen since 2008/2009.
But at least important sectors such as mortgaged debt remain in a healthier place.
1 Like
How did you calculate the debt to income ratio?
I think it would be cool if we have always dedicated supporting sections in the Wiki that highlight the methodology of any of our graphs and we link those sections in our Forum posts so people can understand even better how graphs are build.
It would also be cool if those sections in the Wiki link to other resources in the Wiki.
So as an example if income in this case is the same as personal income we can have cross links in the Wiki to this article.
At the top of the personal income article we could then have a description what personal income actually is.
That’s an very important base building block because without further research into the topic I would not even know if personal income is only salaries or if it includes returns on capital from interest or dividends or even capital gains.
If the later are included the picture would be heavily skewed by the richest 0.1% maybe even to a point that it would be unusable for interpreting the health of debt levels overall.
1 Like
I used disposable income BEA serie, which is the standard to use in this measures.
Disposable income includes everything income-related (no capital gains): compensation, government transfers, rental income, interest and dividend. In this case, interest and dividends are only about 16% of income.
I can create another graph that only includes compensation and government transfers, which is about 80% of income. I don’t expect a much different picture though, other than higher % levels for all periods.
This is all the data that I used too: US Economic Data - Google Sheets
1 Like
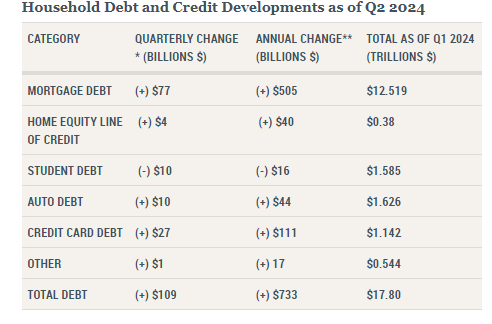
Q2 2024 Household debt increased by $109 billion (0.6%) in Q2 2024, to $17.80 trillion. Flows into delinquencies continue to rise.
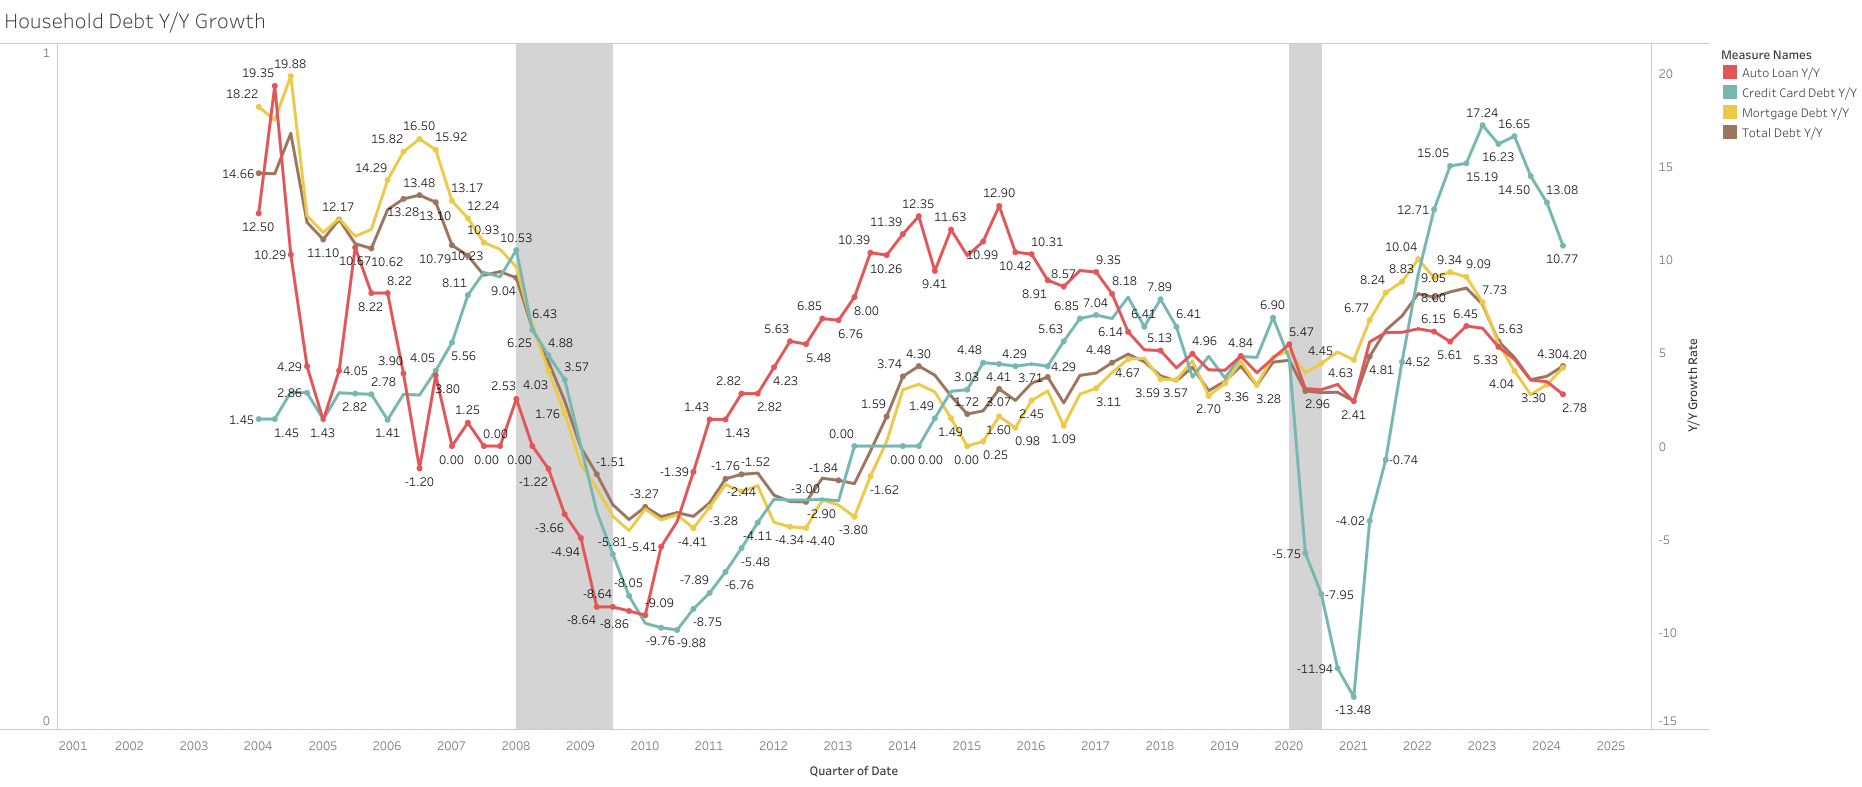
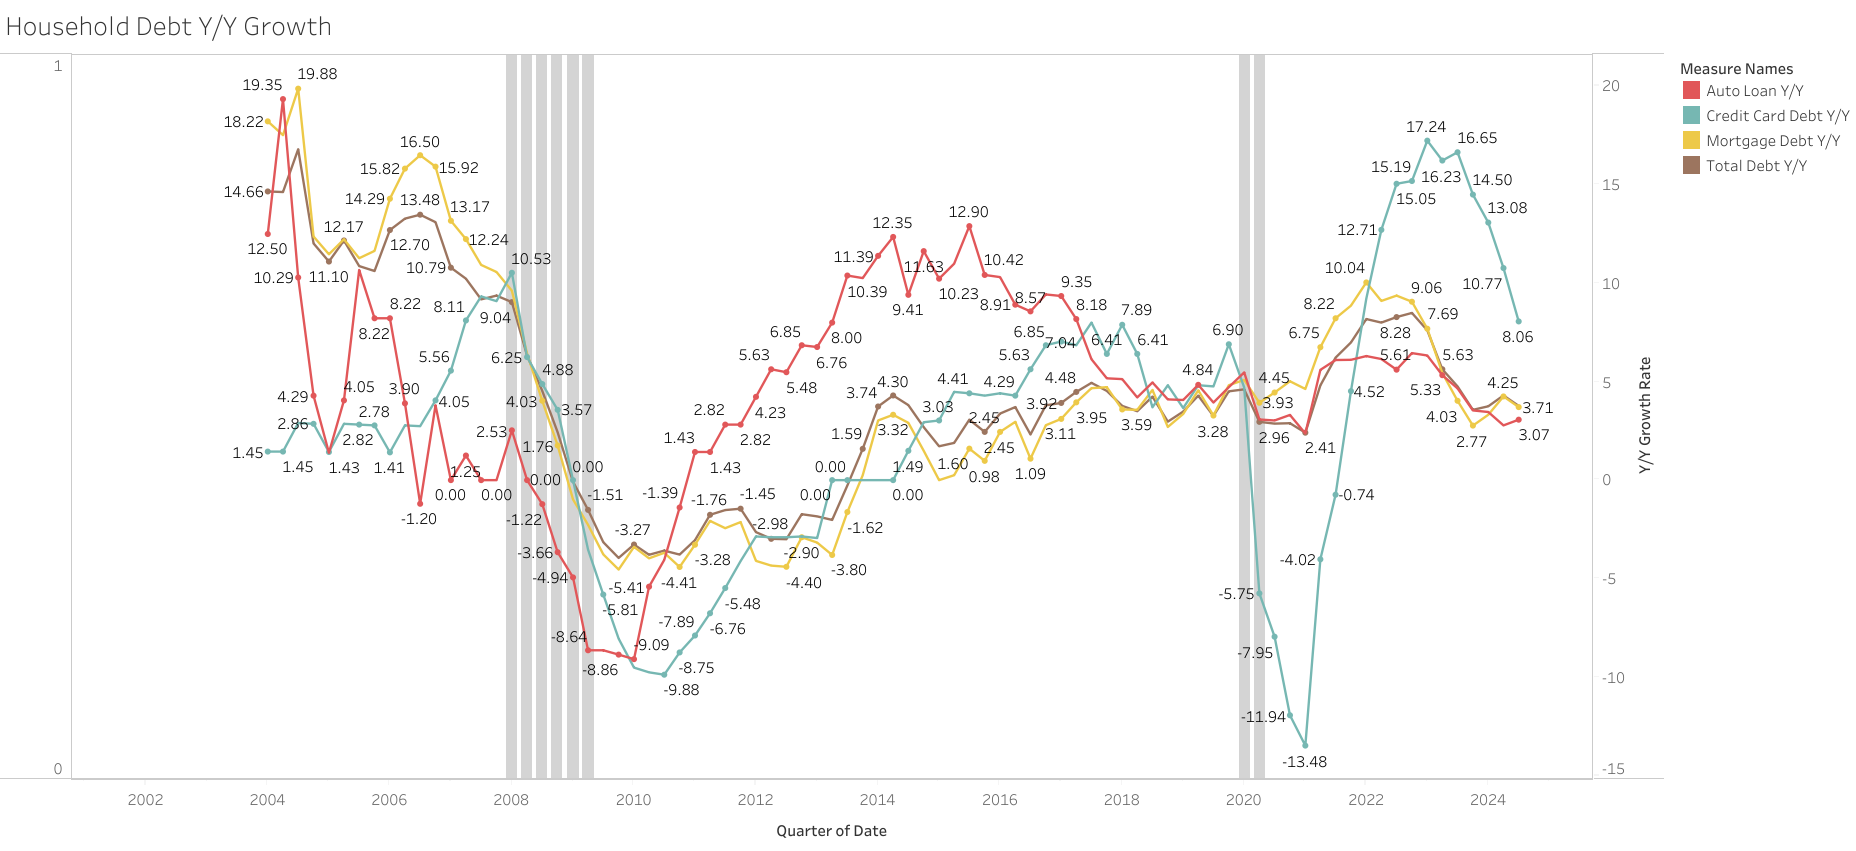
- Y/Y growth rates moderating, but credit cards are still significantly high. However, 1H2024 credit card credit grew only by $13 billion (vs $ 45 billion 1H2023).
- Debt excluding mortgages up $32m billion in Q2 2024 vs -$6 billion in Q1 2024.
As reference disposable income grew 0.9% Q/Q (4.43% Y/Y) or $186 B SAAR (seasonally adjusted annual rate)
Flows into delinquency still increasing, especially high for credit cards and to a lesser extent for auto loans.

https://www.newyorkfed.org/medialibrary/interactives/householdcredit/data/pdf/HHDC_2024Q2
1 Like
Q3 2024 Household Debt Rose Modestly. Delinquency Rates Remain Elevated
Total household debt increased by $147 billion (0.8%) in Q3 2024, to $17.94 trillion.
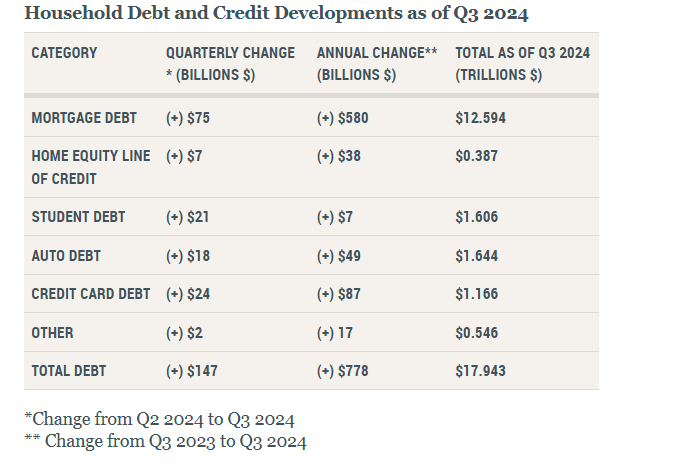
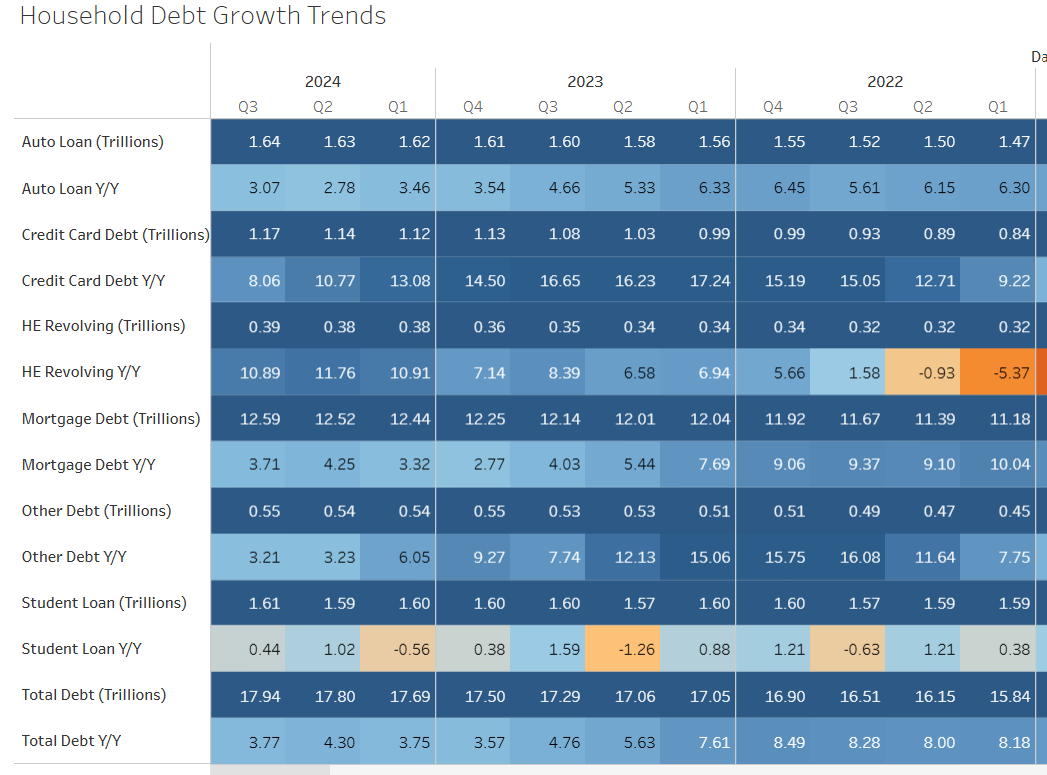
Debt to Income ratio remained essentially flat in Q3 2024 at 82.3%.
Aggregate delinquency rates edged up from the previous quarter, with 3.5% of outstanding debt in some stage of delinquency, from 3.2% in Q2 2024 and 3.0% in Q3 2023.
- Credit card delinquency rates improved, with 8.8% of balances transitioning to delinquency compared to 9.1% in the previous quarter.
- Early delinquency transitions for auto loans and mortgages worsened slightly, rising by 0.2 and 0.3 percentage points respectively.
- bout 126,000 consumers had a bankruptcy notation added to their credit reports this quarter, a small decline from the previous quarter.
https://www.newyorkfed.org/medialibrary/interactives/householdcredit/data/pdf/HHDC_2024Q3
1 Like
Q4 Consumer Debt Report: Household Debt Balances Continue Steady Increase
The report shows total household debt increased by $93 billion (0.5%) in Q4 2024, to $18.04 trillion vs 0.8% in q3 2024
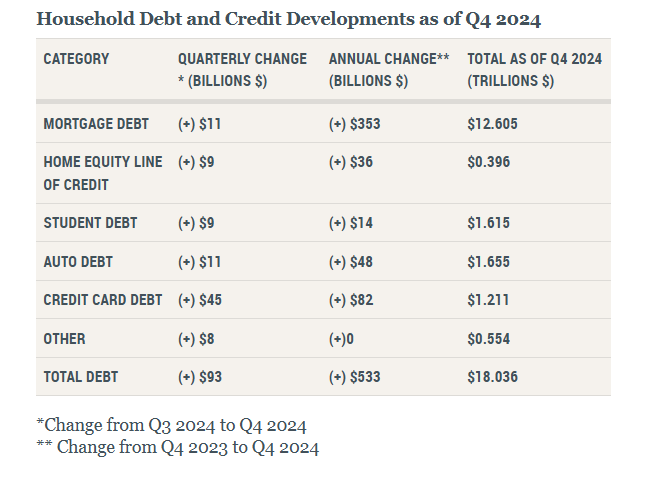
Delinquency Transition Rates Remain Elevated for Auto and Credit Cards

https://www.newyorkfed.org/medialibrary/interactives/householdcredit/data/pdf/HHDC_2024Q4