Following analyst earnings expectations for the S&P 500 is critical for investors and macroeconomic analysts because these expectations shape market sentiment, impact asset pricing, and provide forward-looking insights into corporate health and economic conditions.
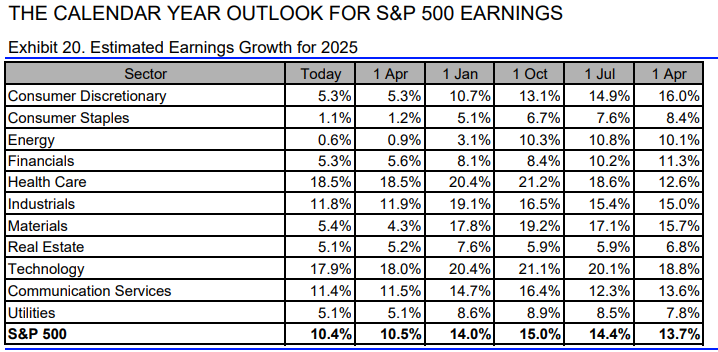
Despite the Recent Market Sell Off analysts are still expecting Solid Earnings Growth for 2025
This could be both positive, but a risk at the same time. Earnings growth expectations continue to be high, any continuing readjustment or revision could continue to fuel the market sell-off.
Q1 2025 will be crucial.
- Earnings expected at 10.7%, revised down from 14% at the beginning of the year
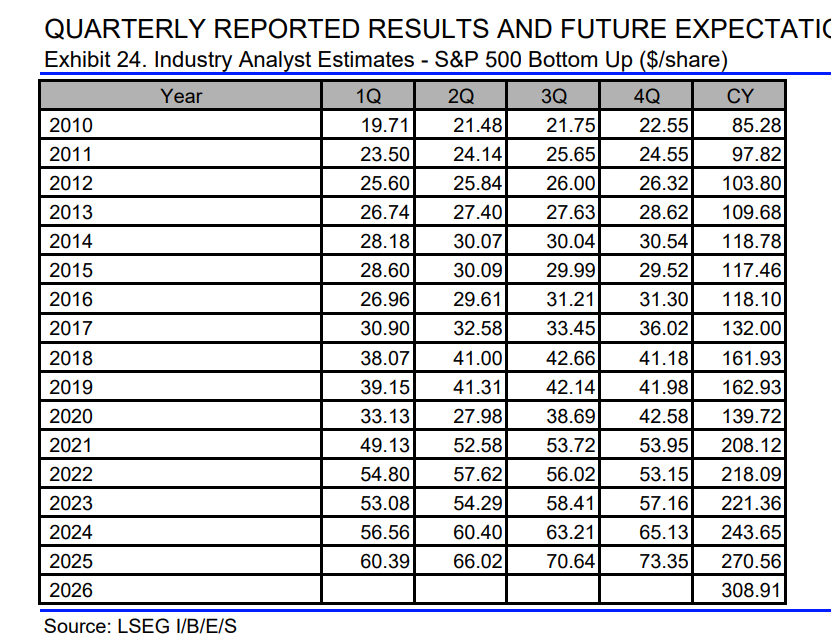
- EPS at 270, a 11% growth rate

The forward 12m P/E has compressed from 22.5x to 20.5x (a 9% contraction), while forward 12m EPS estimates have actually ticked higher.

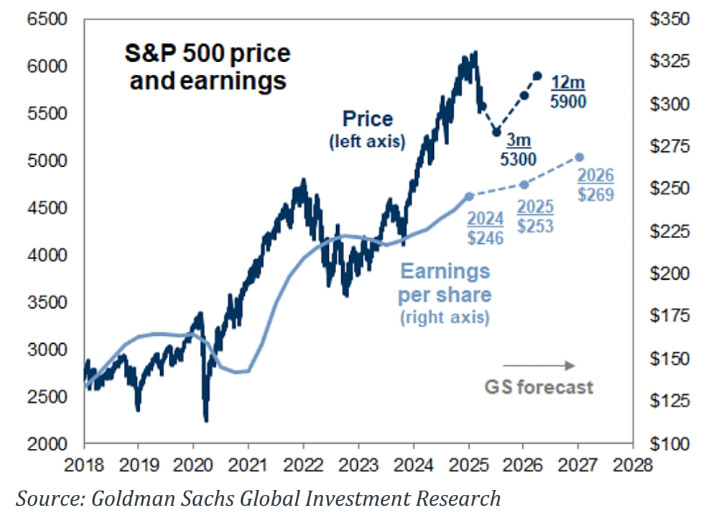
Goldman cuts 2025 SPX forecast to 6200 from 6500 as they cut EPS est’s to $262 from $268 (vs Wall St consensus of $270)
- They said every 10-percentage-point tariff-rate increase they find reduces S&P 500 earnings by 1% to 2%.
- Outlook for slower growth suggests lower valuations on a more sustained basis
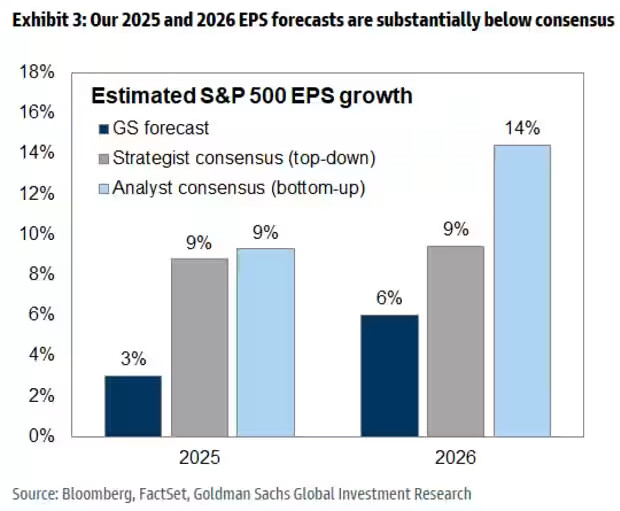
Goldman slashed their S&P 500 earnings per share growth target for 2025 by more than half, from plus 7% to plus 3% ($253 per share)
Consensus continues to be ~269 EPS, but I think we could start to see additional revisions going forward, after the down revisions we are starting to get for 2025 US GDP.
- Earnings per share (EPS) growth in 2026 is reduced slightly from 7% to 6%.
- Estimate each 5 pp incremental increase in the effective tariff rate would weigh on S&P 500 EPS by roughly 1-2%
- Strategist now expects the benchmark to end the year around 5,700 points versus his previous estimate of 6,200, citing a [higher recession risk and tariff-related uncertainty.
“If the growth outlook and investor confidence deteriorate even further, valuations could decline much more than we forecast,” Kostin wrote in a note. “We continue to recommend investors watch for an improvement in the growth outlook, more asymmetry in market pricing, or depressed positioning before trying to trade a market bottom.”
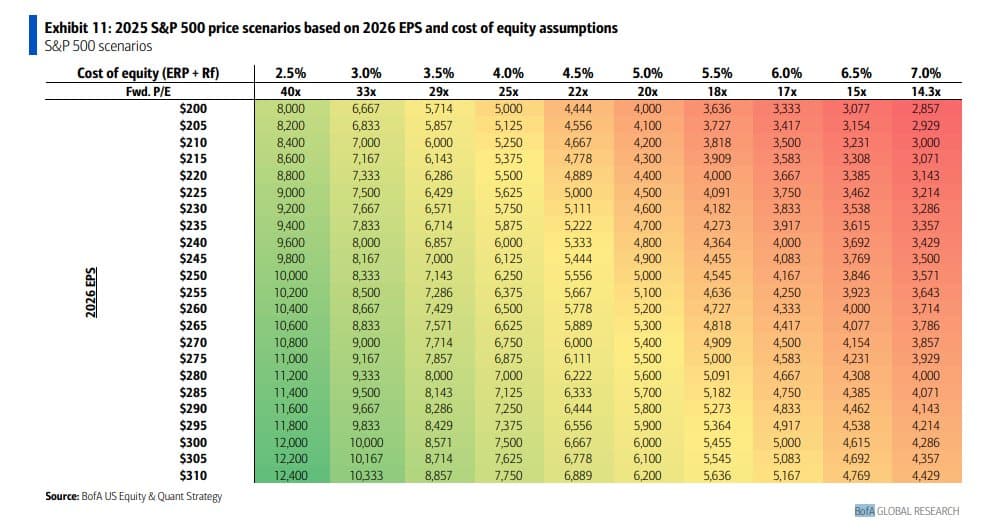
BoA’s Savita Subramanian cuts her 2025 SPX estimate to 5600 on the back of a cut to 2026 EPS estimates to $257 ($250 for 2025)
This drops their “fair value” model to 5,411 along with a 50bps increase in cost of equity estimate.
"The range of expected earnings across scenarios is wide based on different macro scenarios: a recession could hit earnings by 20%, the typical recessionary drop, yielding earnings of $200.
"Stagflation would likely be milder given the nominal benefit to earnings, but would pose risks of 10% to 20%.
“Goldilocks and boom scenarios would likely represent 10% to 20% gains from here (where trailing EPS as of 1Q25 assuming current 1Q25 consensus is ~$250). The cost of equity (equity risk premium + risk-free rate) is also a big swing factor.”
Magaly Assessment Earnings Expectations as of April 9, 2025
Analysts are still expecting 2025 EPS for $268%, a 10.66% increase over the previous year (even higher than last year 9.65%, where growth was exceptional)
Analysts have barely revised these expectations since 1 month ago, when I posted the first update even with all this market turmoil, they were expecting 270 back then to 268 now.
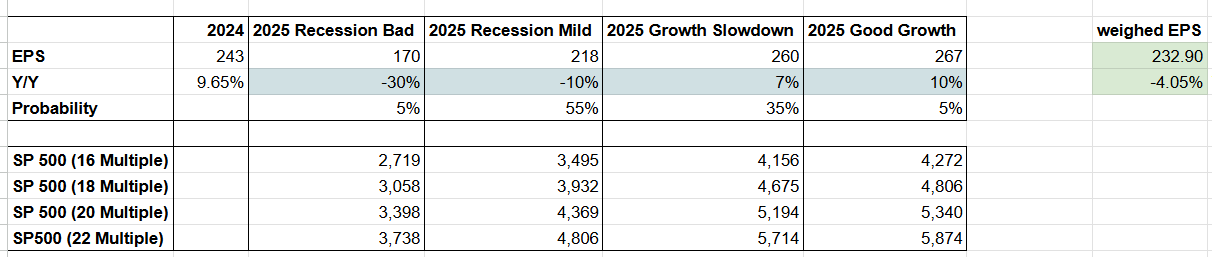
Given rising recession risks, or at the very least, a significant slowdown from 2024’s growth pace, such bullish earnings estimates now seem overly optimistic, and this expectation no longer makes sense to me both 2025 and 2026. Therefore, I believe there’s a high probability we’ll see meaningful downward earnings revisions after the next quarter’s (Q1, Q2, etc) earnings reports, potentially triggering further market sell-offs
Historically, earnings decline by 20–30% during recessions, so I quickly calculated scenarios for earnings based on my recession scenarios, and I think the current risks for the market continue to be to the downside (especially after today’s rally).
Analyst Expectations
Great. Thinking about EPS, calculating scenarios and putting it in relation to index levels by using different multiples makes a lot of sense.
I assume those first estimates and scenarios are still very rough estimates with a very low confidence of accuracy or did you find ways how to connect/translate your mild recession scenario to actual EPS estimates?
It’s worth mentioning that some analysts like Yardeni started to cut their targets but his estimate is still at $260 for 2025.
The % change used is a rough estimate based on past recessions (gdp/earnings don’t have a particularly high correlation) so my confidence there is low, but I am pretty confident that in a recession earnings will be negative, and that the 10% growth is no longer possible.
Ed Yardeni also said this on april 7, I think he is just cautious not lowering so much still very fast, since there is still uncertainty about the recession, Trump deals, and whether the recession will come in 2025 or mostly in 2026.
There could be a combination of weak earnings between 2035/2026, and not necessarily 1 year or the other
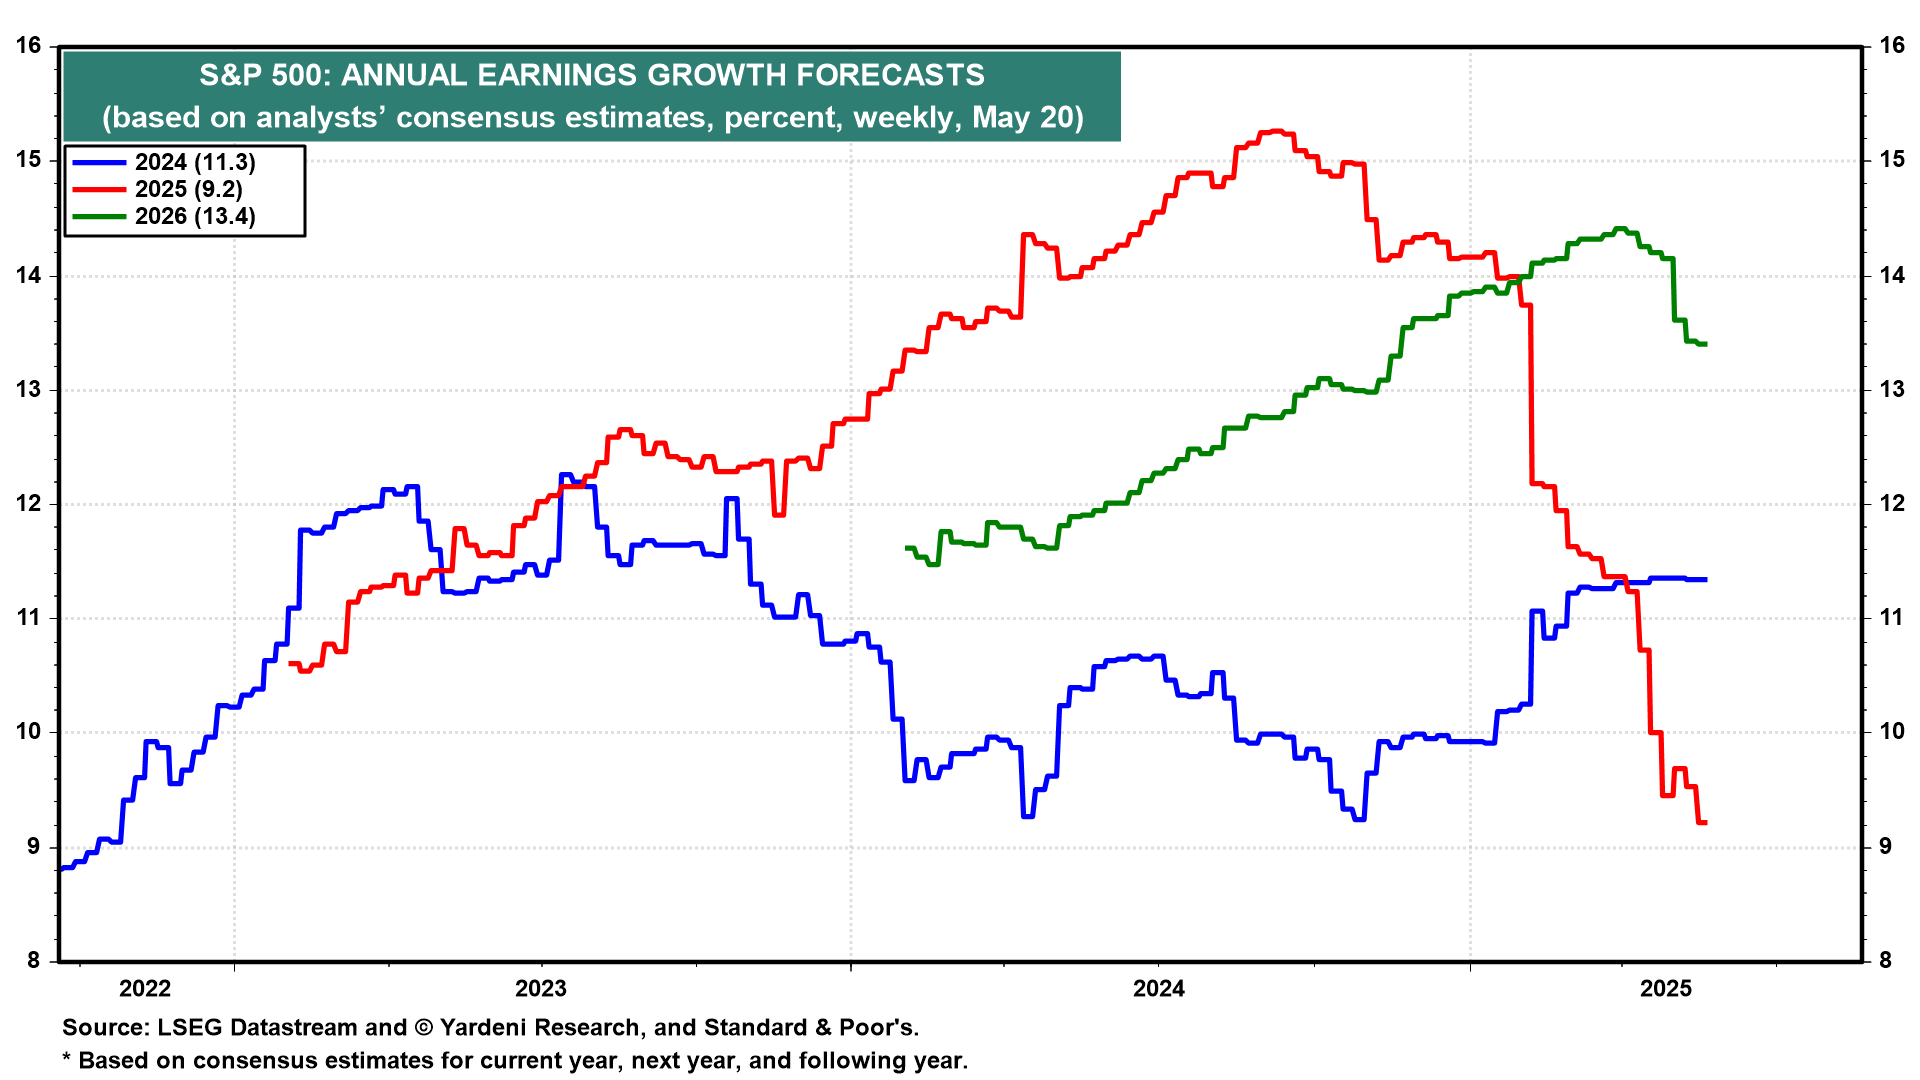
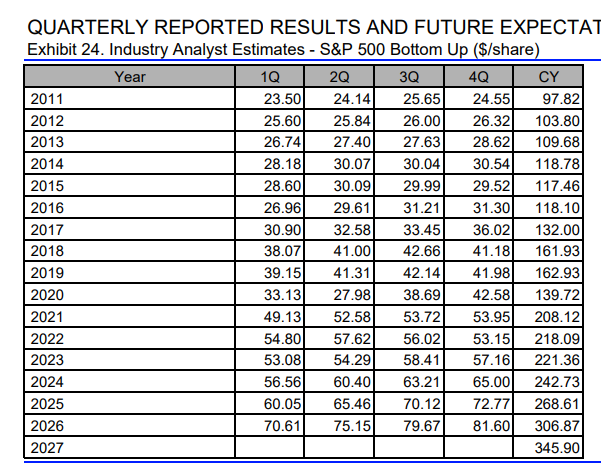
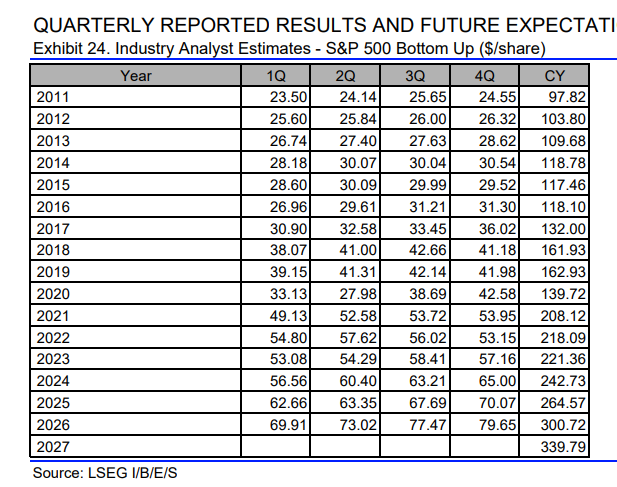
Industry analysts have been lowering their S&P 500 earnings per share estimates, but they remain high at $268.85 and $307.03 for 2025 and 2026, up 9.2% and 14.2% y/y (chart). Those estimates are likely to fall over time, as estimates typically do since analysts tend to be too optimistic initially. They will fall a lot if Trump Tariff Turmoil causes a recession
S&P 500 forward earnings per share has been flattening out at a current record high of $279.13. That puts the forward P/E at 18.1 based on today’s close of 5062.25 on the S&P 500. That’s relatively high given the downside risk to earnings.
Both Goldman and BoA have estimates at $250 currently, but the risks they see are also to the downside
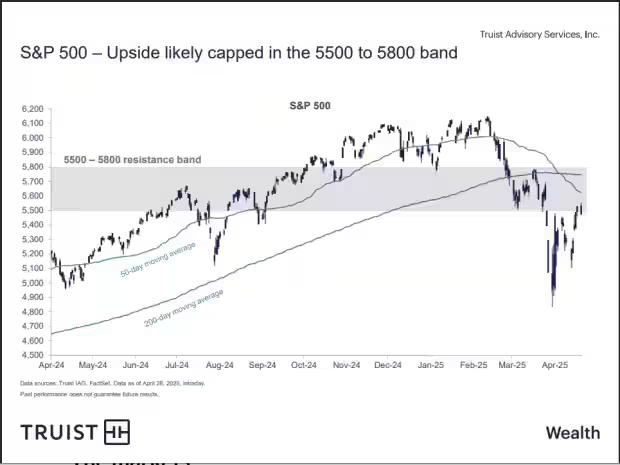
Truist Advisory Services’ co-chief investment officer Keith Lerner says the upside in the S&P 500 is limited to around the 5800 level, but the downside could be up to 10% (or more) in the event of a retest of the 4,835 low.
“Thus, the risk-reward appears less attractive at current levels,” Lerner said in a note to clients. “Markets have gone from pricing in a decent amount of bad news at the recent lows to providing less of a buffer should we have a rockier road ahead.”
Even by applying a currently “optimistic” 21 times forward P/E on the S&P 500 of $278, near-term upside for the index is still limited to around 5,800, he said, of the level that also marked its March peak.
@Magaly Which source are you using for consensus EPS numbers e.g. as mentioned here and how often is this source updating? I assume you are always referring to S&P 500 EPS if you don’t specify further?
Can you remind me of our past observations (incl. links to the forum posts at the time) when we observed analysts and consensus being wrong and then adjusting very slowly.
How often does this happen overall?
I want to understand better how reliable analyst earnings predictions are and how hard it would be to have an edge. Maybe there are also some websites/publications that track expectations vs. actuals over time or analyzed this question.
1 Like
I am using Refinitiv source, this is updated on a weekly basis, and yes, it refers to SP500 EPS.
For that post, I used data as of May 7, which shows down revisions from the last time I posted this, but still very minimal revisions for the headwinds ahead imo.
For what I have been hearing from commentators and analysts, is that earnings analysts revise their estimates mostly based on company guidance, since in Q1 2025 guidance most companies have reaffirmed it with the disclamer tariffs impact is still no accounted, or remove their guidance completely or expand their ranges, it has been difficult for analyst to lower their estimates much more because of uncertainty and lack of clarity.
I don’t think we have ever analyzed this in much detail. What I have always noticed is that quarterly estimates are usually pretty much on point or even lower than actuals (most companies beat), but longer-term estimates 1/2 year from now are usually revised a lot on a constant basis.
Since revisions are very common, I think the edge only comes from anticipating how big the revision could be, is not the same to slowly revised lower from 9% to 6%, to have to revised from 9% to 1% or even negative.
I can do a more in-depth analysis if it’s needed.
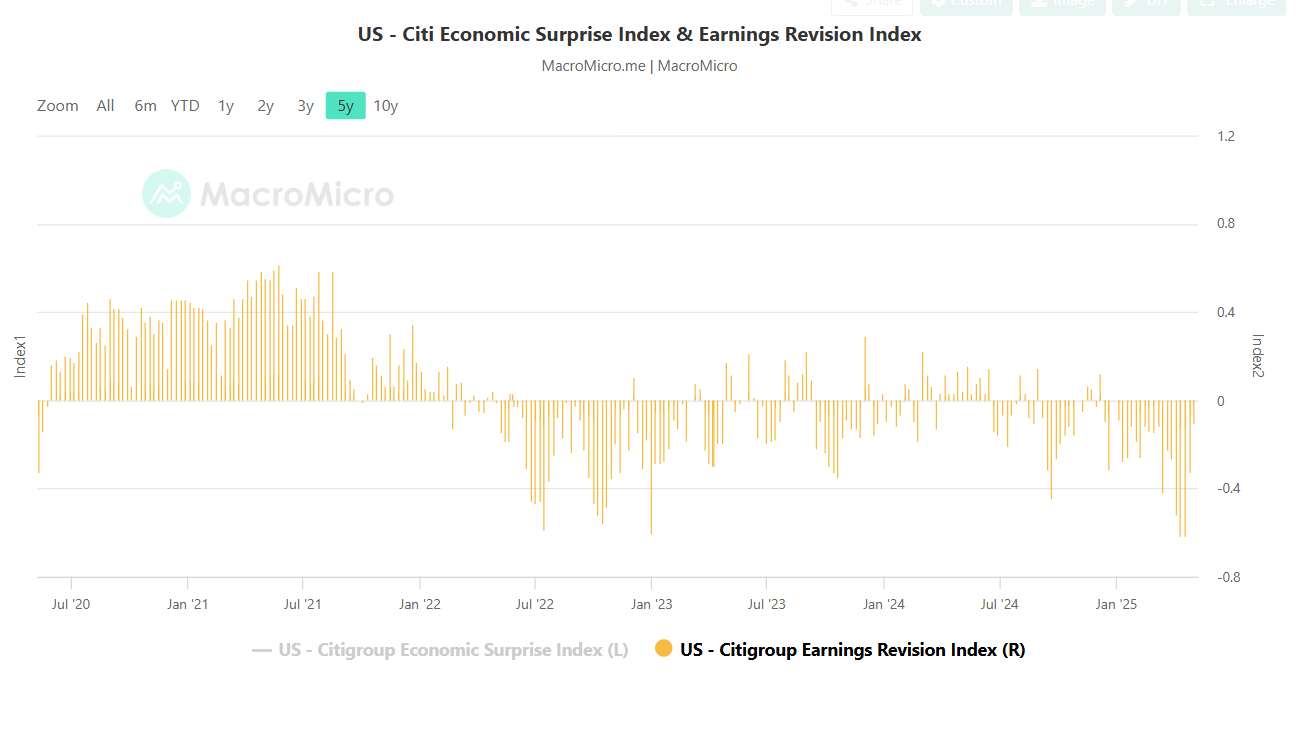
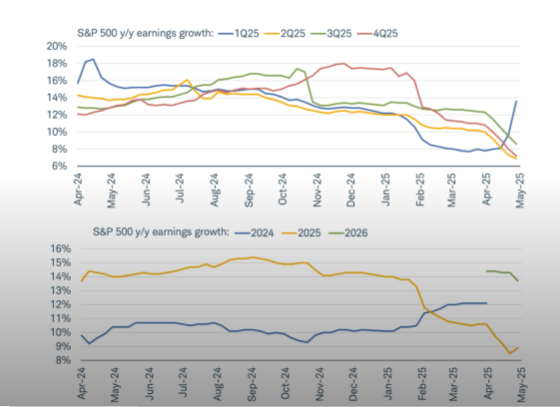
This is a chart I found from Charles Swap, showing revisions since april 2024 for current and coming quaters, and their opinion analyst will most likely lower their estimates more, but for now they don’t have much certainty.
Hmm I remember that we had talked about that topic before and the fact that analysts sometimes revised their earnings estimates shortly before earnings.
Aren’t there any insights or relevant discussions in one of our older quarterly overall earnings topics?
I also thought that we observed a series of stronger revisions I think maybe at the beginning of 2023 relatively shortly before earnings.
Maybe slightly deeper research would be good that gives a better overview of what happened with earnings and revisions over the last years.
If you are right and analysts predict based on company guidance then it should be possible to develop an edge to their projections in some situations.
I think we had the conversation in discord, but it was only a conversation, we never really went in depth.
I did a deep research with GPT, and got some sources with interesting insights:
-
A 2008 Columbia study found earnings announcements trigger most analyst revisions, with 40% within two days, 70% by ~ day 10, but only over 20% occurring later especially due to not new information like guidance.
-
Several studies show a post-earnings drift as markets often underreact to non-EPS details in guidance, and that the drift will be large or not based on how responsive analyst revisions are after earnings
aggregated forecast revisions are better predictors of post-earnings announcement returns than measures of earnings surprises. They are more informative when investor attention is low, when the accrual component in earnings is high and when there is no management guidance.
-
FactSet shows that over 25 years, analysts have overestimated S&P 500 EPS by an average of 6.3% at the start of each year than the actual year end annual results (2001 +36%, 2008 +43%, 2009 +28%, 2020 +27% and 2022 +6.5%). There is usually an optimism Bias for longer-term expectations, and particularly acute in recessionary periods.
-
Over the past ten years, actual quarterly earnings reported by S&P 500 companies have exceeded estimated earnings by 6.9% on average. 75% of companies in the S&P 500 have reported actual EPS above the mean EPS on average. So, there is for quarterly estimates there is instead a conservative bias.
According to Chicago Booth’s analysts walk down forecasts by suppressing positive news from quarterly forecasts, not by issuing misleading negative revisions. When analysts have positive news, they will often revise the share price target upward or state explicitly that they expect companies to beat earnings estimates, while leaving the quarterly forecast unrevised. Suppressing positive news leads to beatable forecasts.
Cool you found the discord conversation.
Did you look again at the sources linked there e.g. from refinitiv or yardeni?
I think I am overall more interested in the precision and how it worked in the last couple of years as I think older data might be outdated.
I think by using refinitiv as a source or factset or yardeni we would be able to establish the extend of earnings revisions and when they happen?
Sure, it will take me some time tough, since I think this will have to be more a manual work.
But first I need to see how early we can access expectations data from these.
Will eventually post here summary or tag in notion if I am able to get good results. I will analyze most likely from 2022 to 2024, since I think as expected analyst are mostly wrong when there are shocks or risks materializing.
1 Like
Make sense. I think there could also be more charts how revisions went e.g. from Yardeni or like the one you found a couple of posts ago to give a good & quick overview