Main Article: Job Openings - InvestmentWiki
Data: Softlanding or not probabilities - Google Sheets
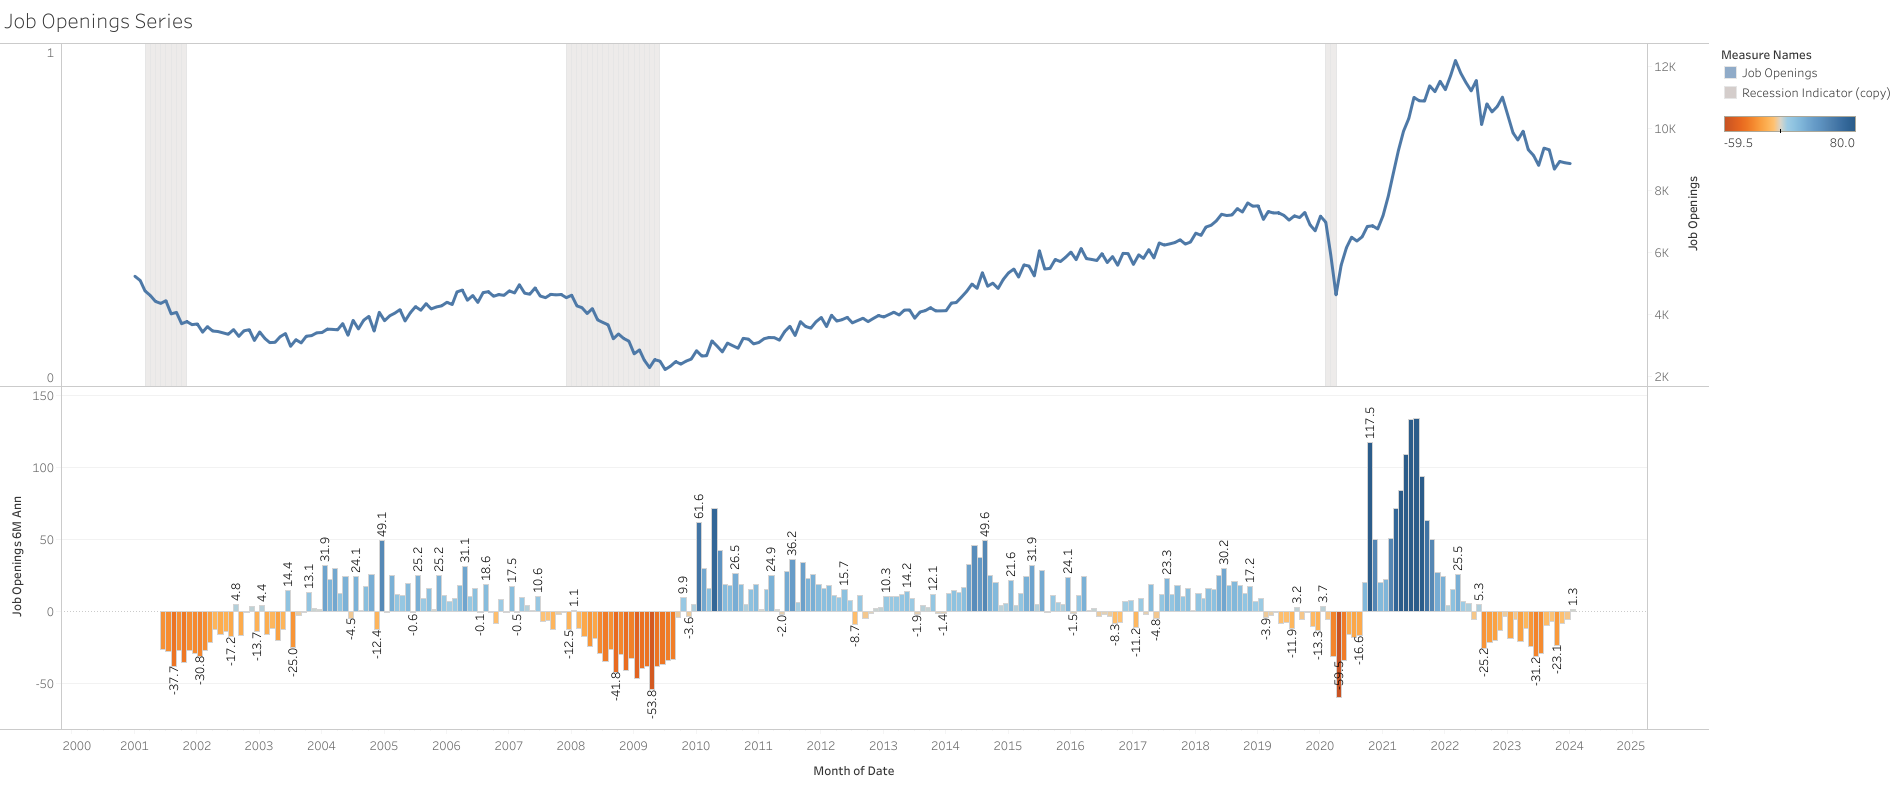
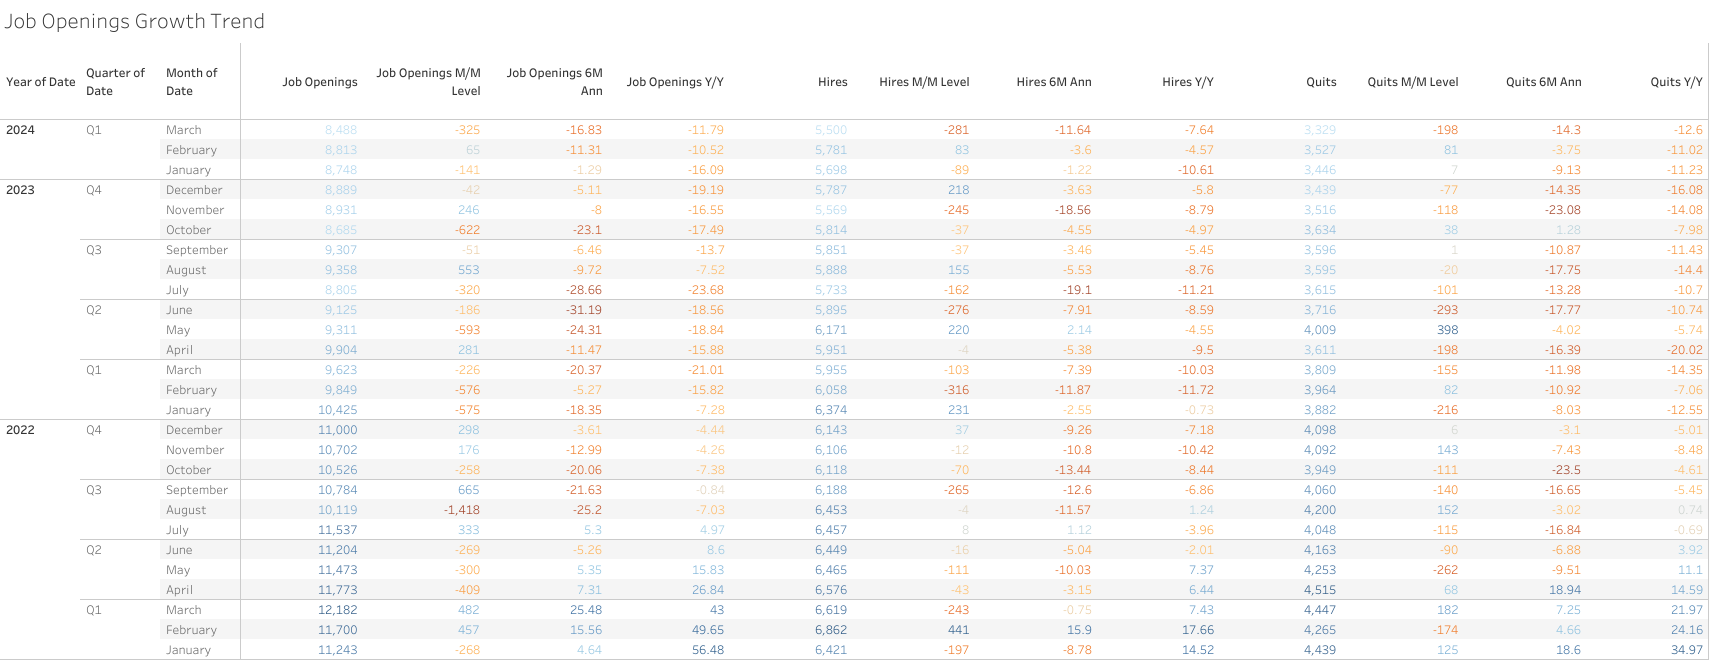
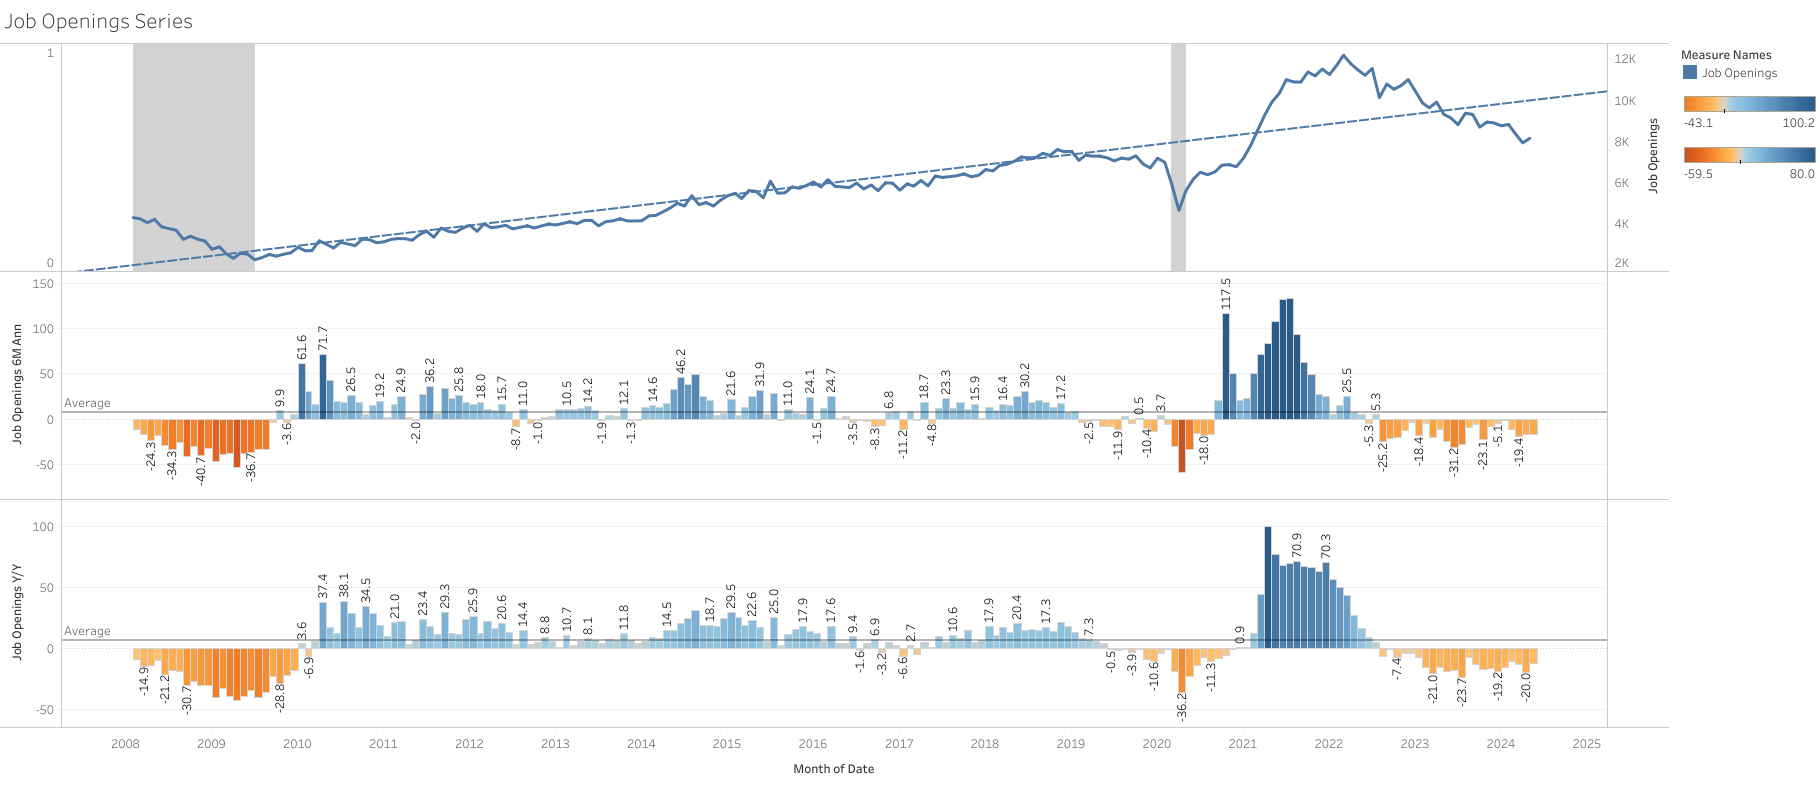
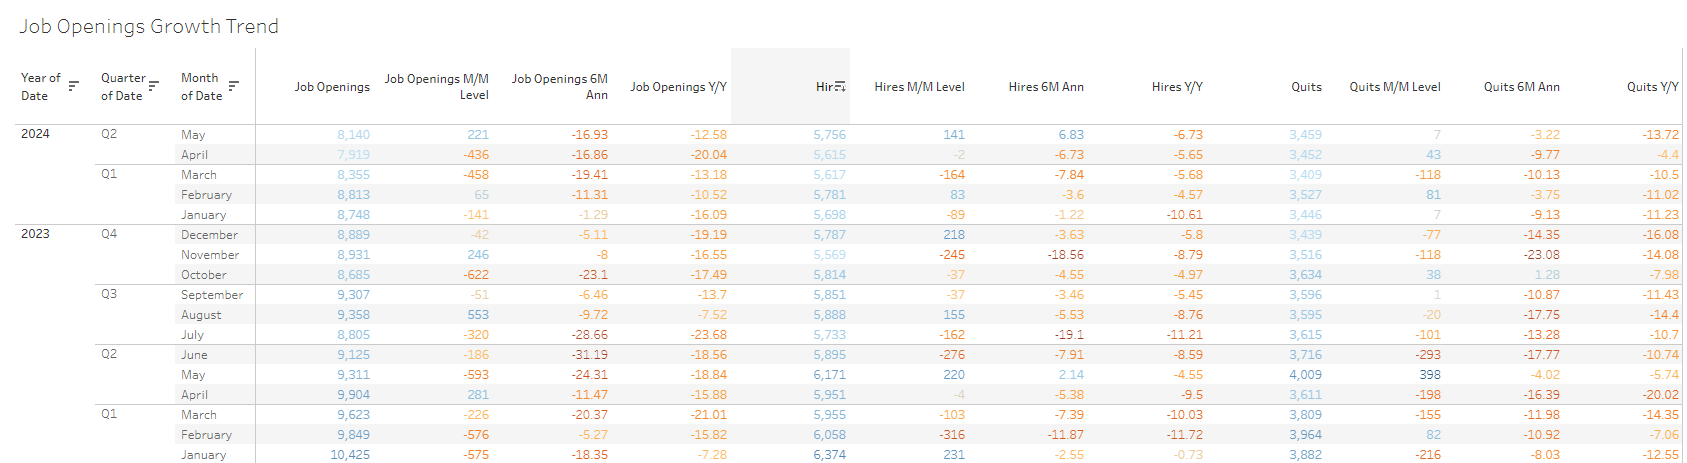
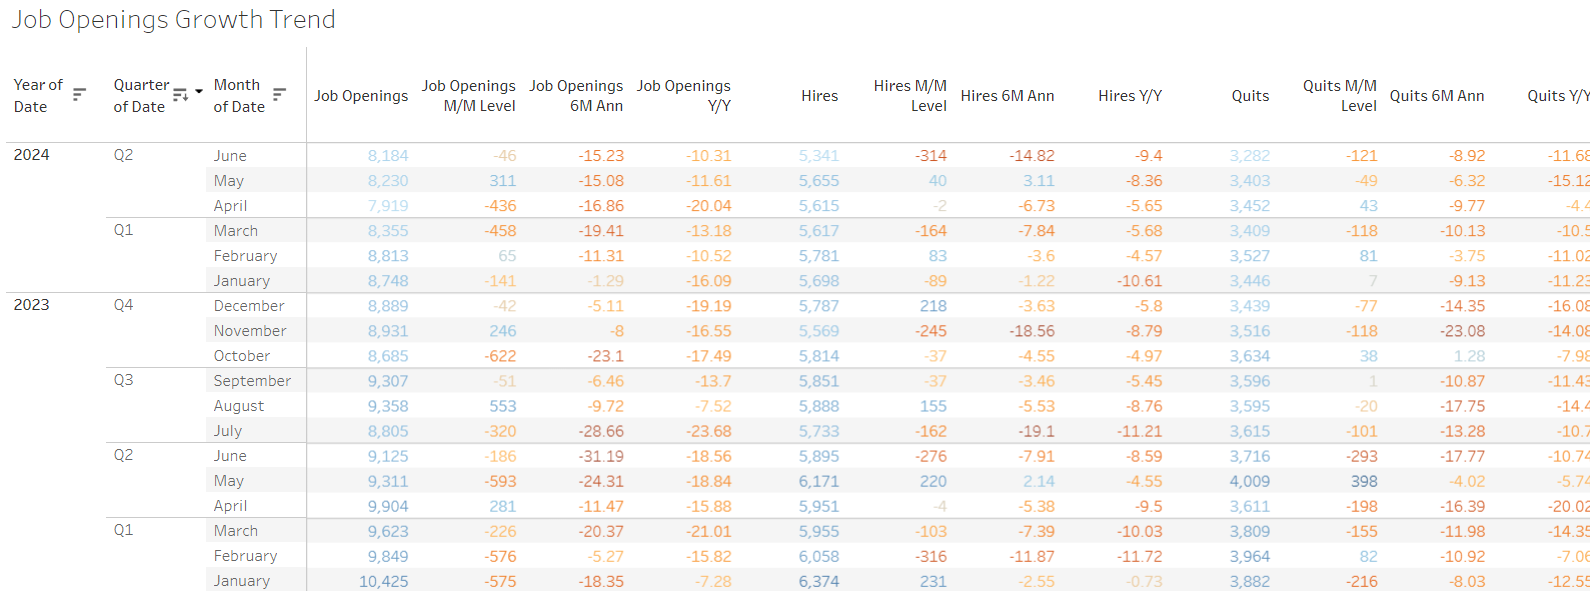
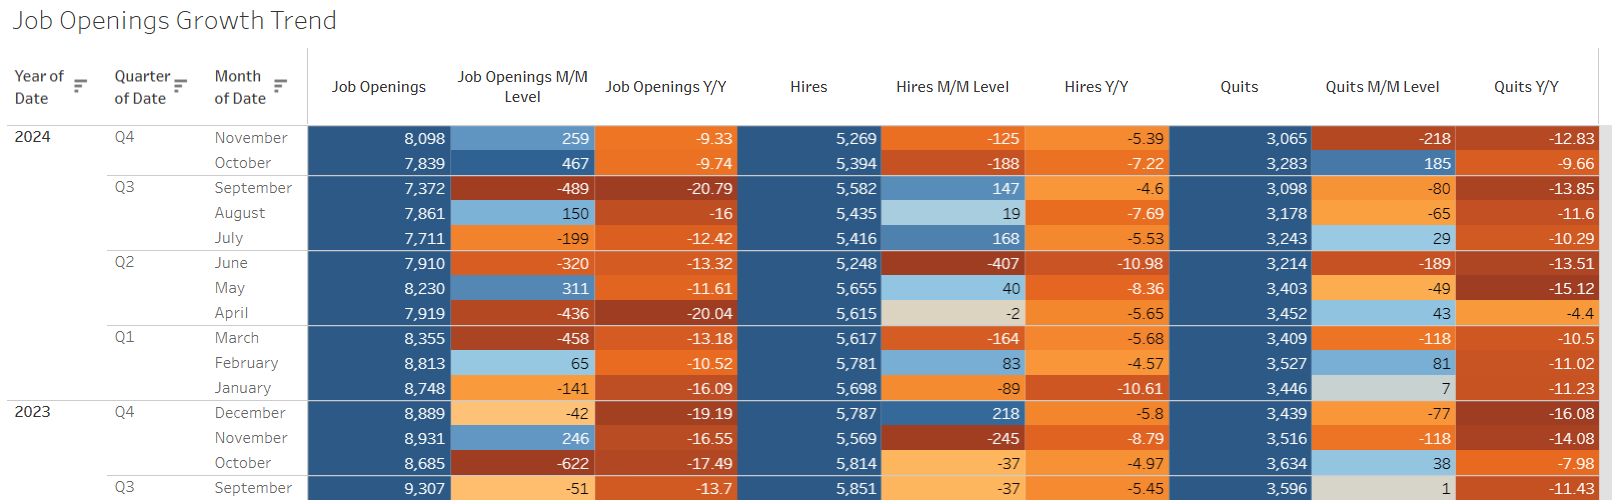
Tableau:https://public.tableau.com/views/USLaborMarket/JobOpeningsGrowthTrend?:language=en-US&:sid=&:display_count=n&:origin=viz_share_link
Main Article: Job Openings - InvestmentWiki
Data: Softlanding or not probabilities - Google Sheets
Tableau:https://public.tableau.com/views/USLaborMarket/JobOpeningsGrowthTrend?:language=en-US&:sid=&:display_count=n&:origin=viz_share_link
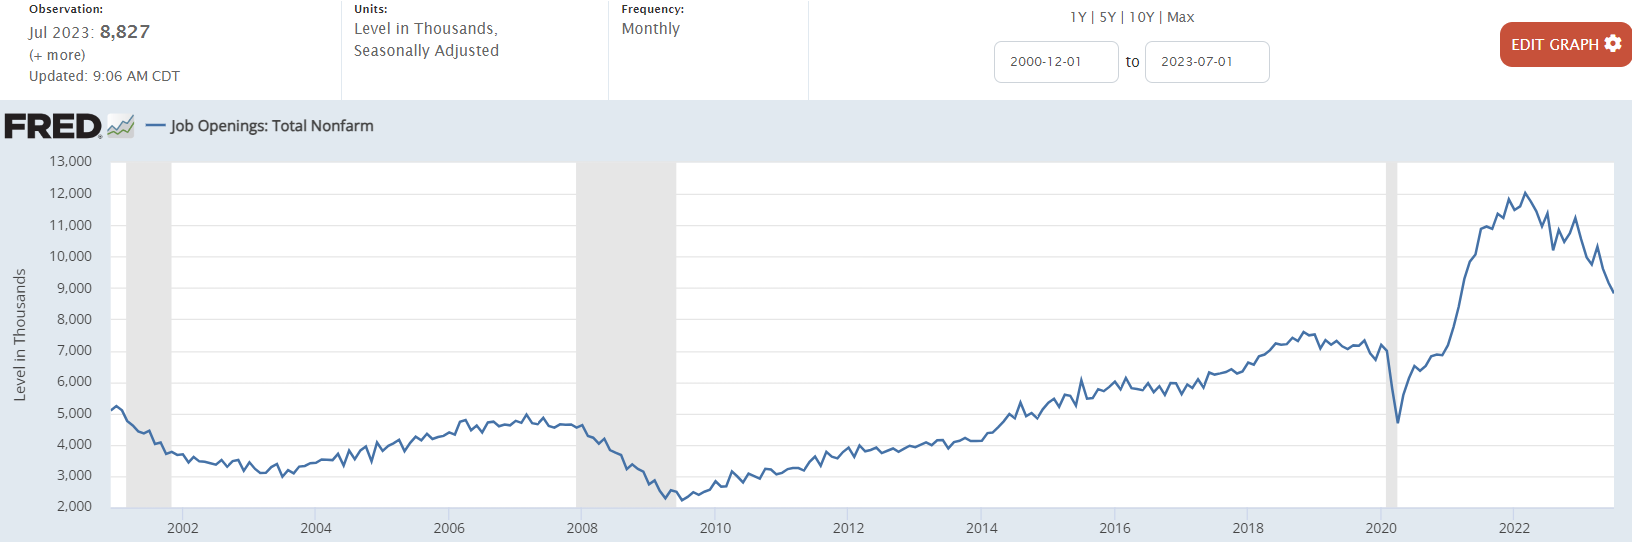
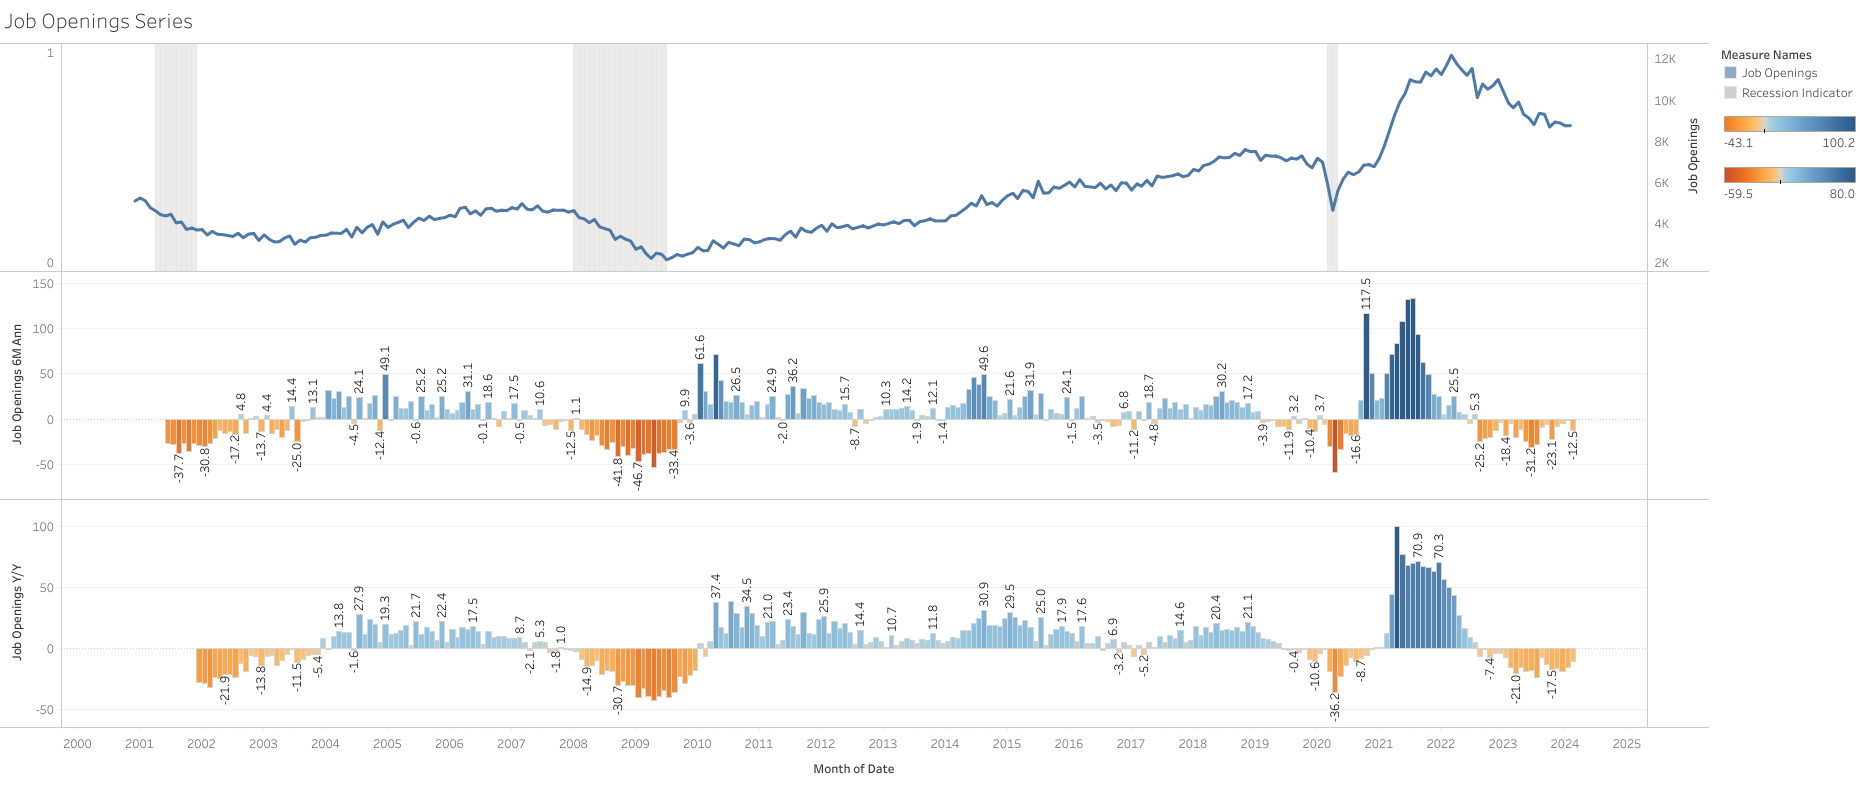
Soft development in July for job openings, probably in line with what the FED wants to see
Big miss in Job openings, with an increase in openings not seen since 2021. This is probably not something the FED wants to see at this point.
But at the same time could be just a temporary bounce which we have seen before.
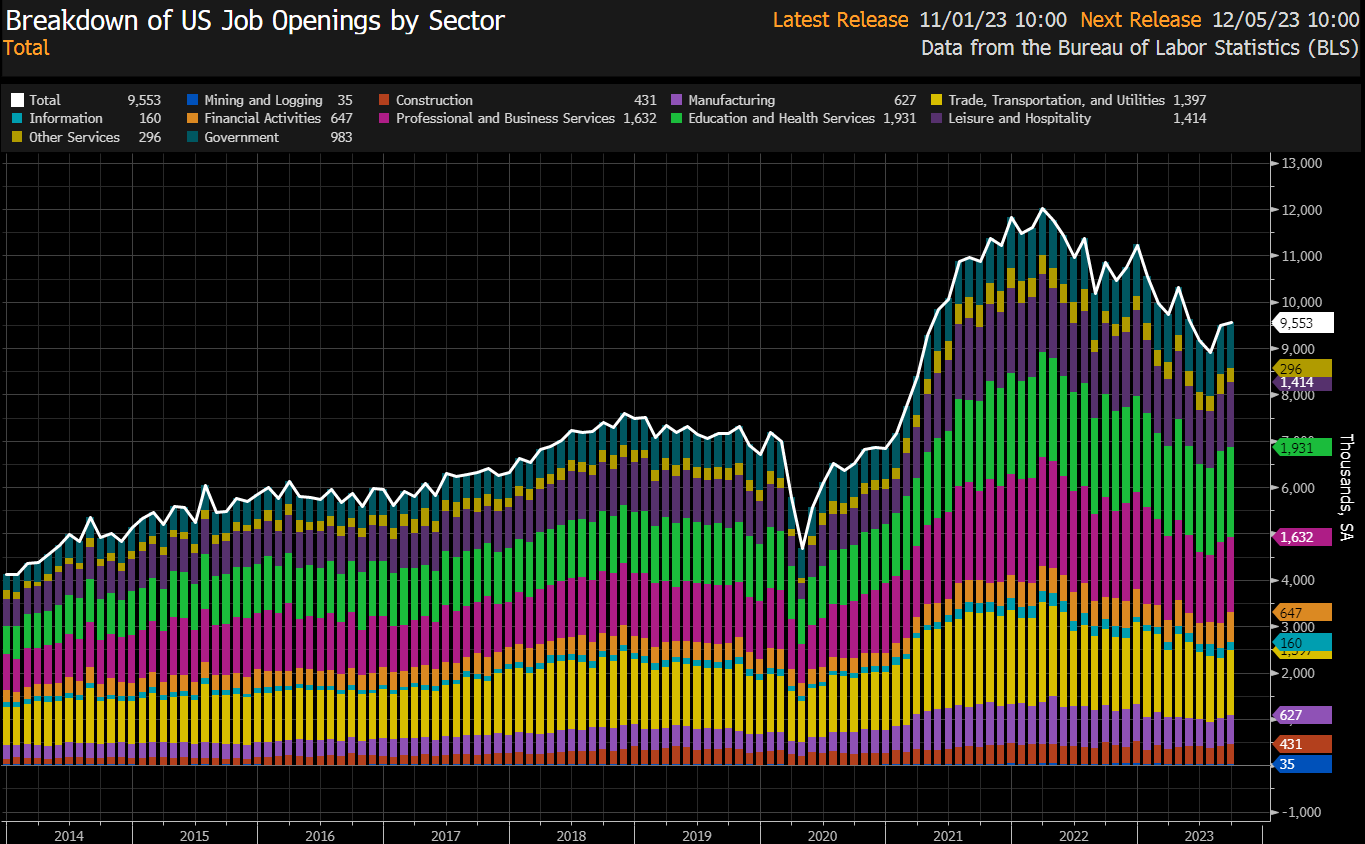
August JOLTS job openings up to 9.61M vs. 8.82M est. & 8.92M in prior month.
Job openings were up 56,000 to 9.553 million in September. Data for August was revised lower to show 9.497 million job openings instead of the previously reported 9.610 million. Economists polled by Reuters had forecast 9.250 million job openings in September.
Very interesting overview and good to know both for our economic understanding and Upwork.
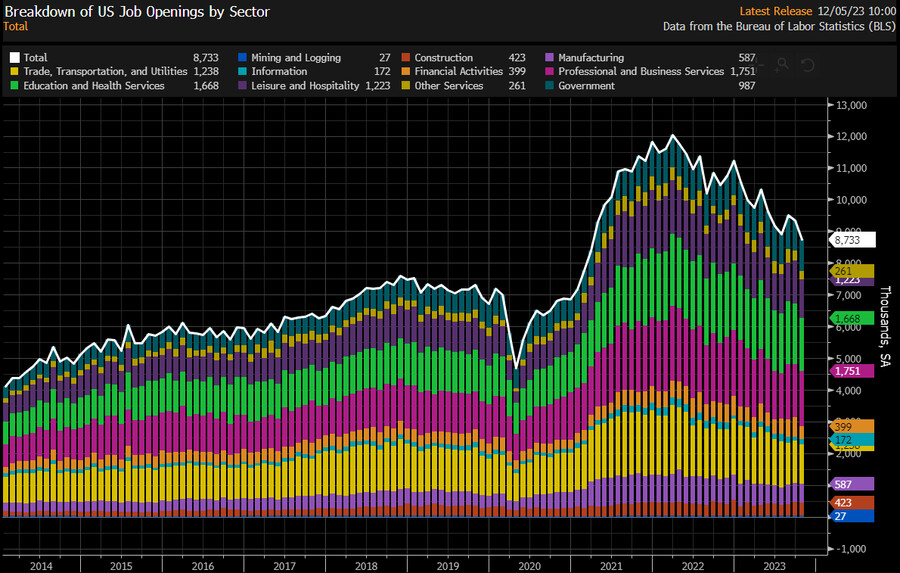
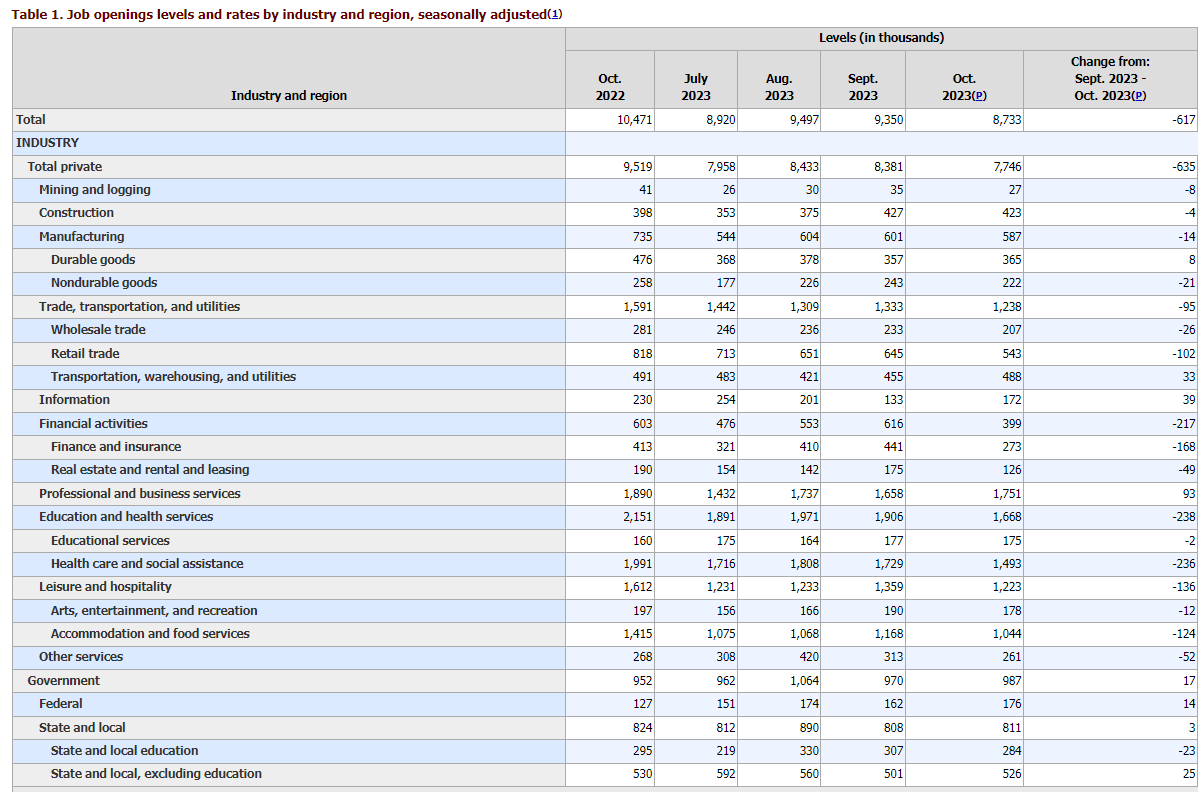
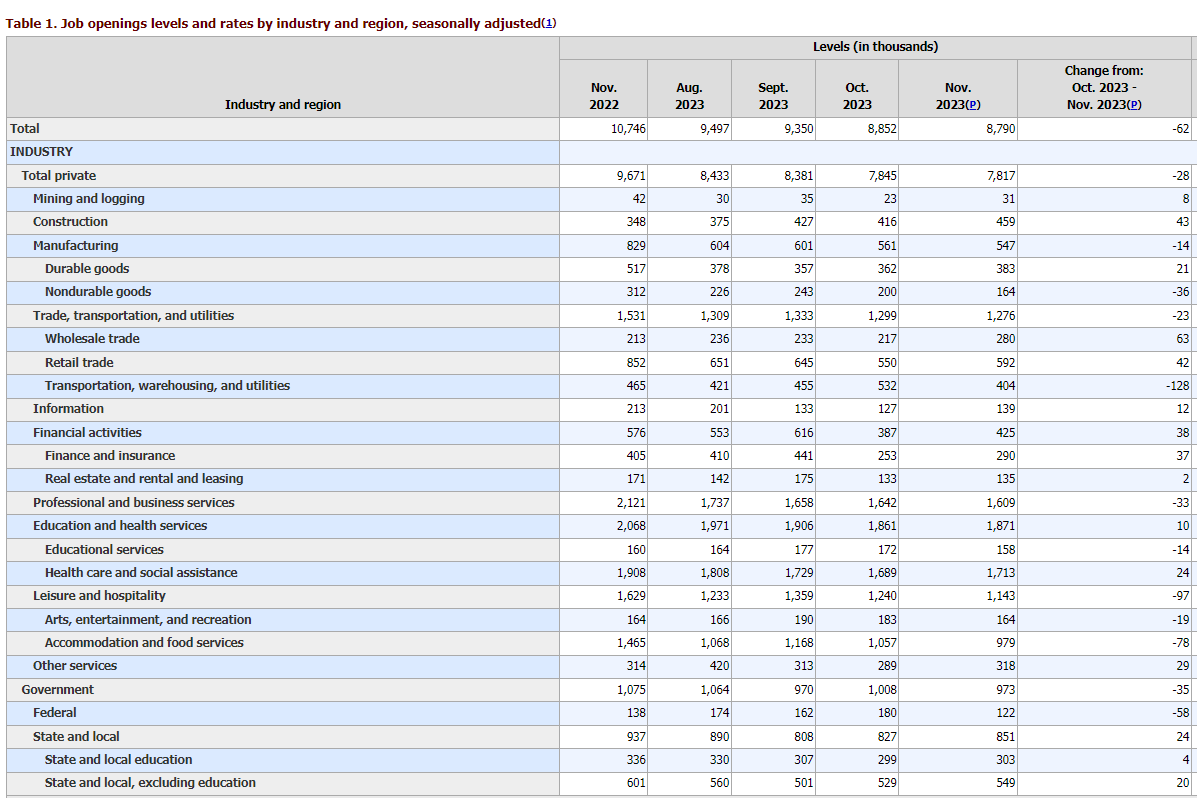
Significant soft report for job openings, coming at the lowest level since March 2021.
October JOLTS job openings were down -617,000 to 8.733M vs. 9.3M est. & 9.35M in the prior month.
Last month was revised lower too from 9.553 to 9.350 M
Job openings continue to cool down.
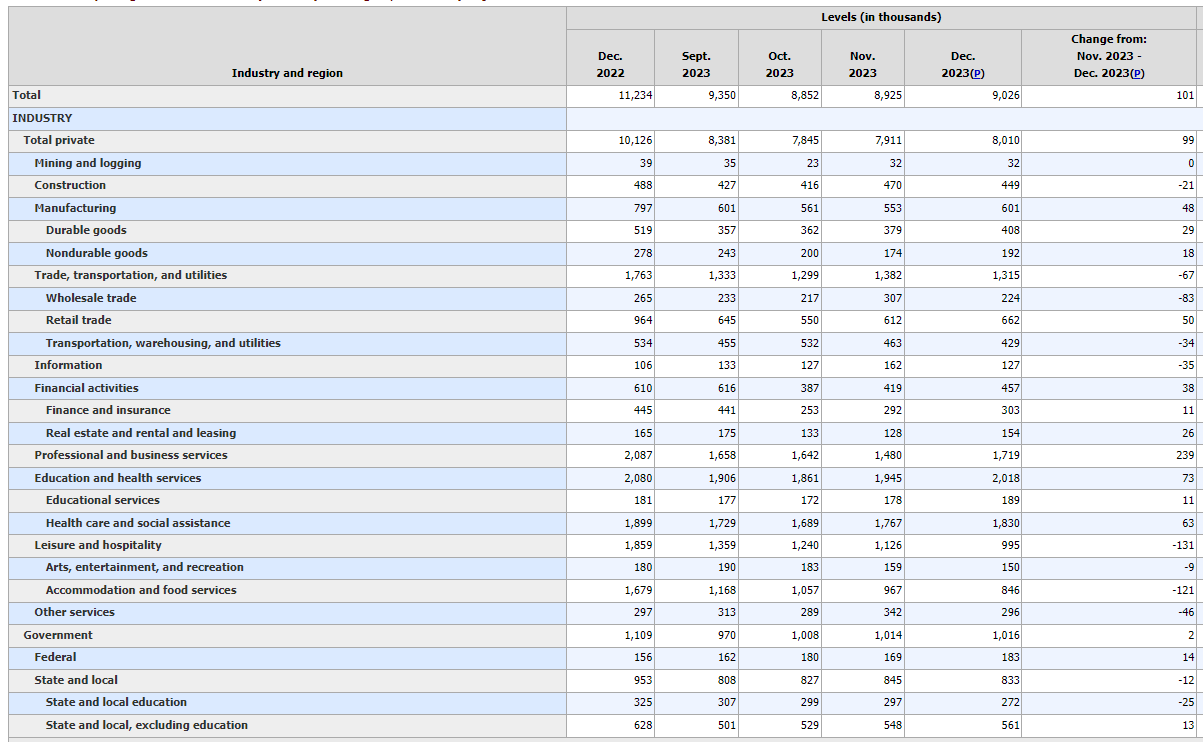
Job openings surprised to the upside for December, adding 101k openings. November was revised up.
December JOLTS job openings up to 9.026 million vs. 8.75 million est. & 8.925 million in prior month (rev up from 8.79 million)
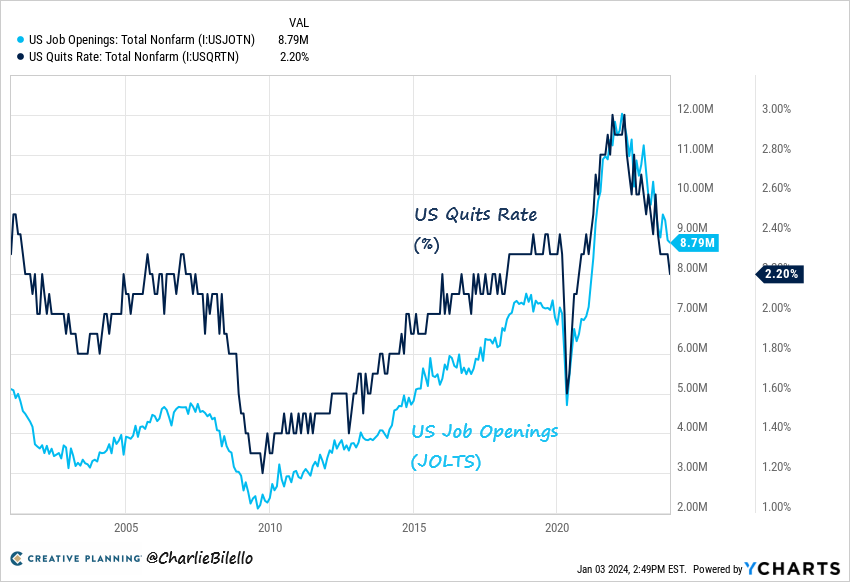
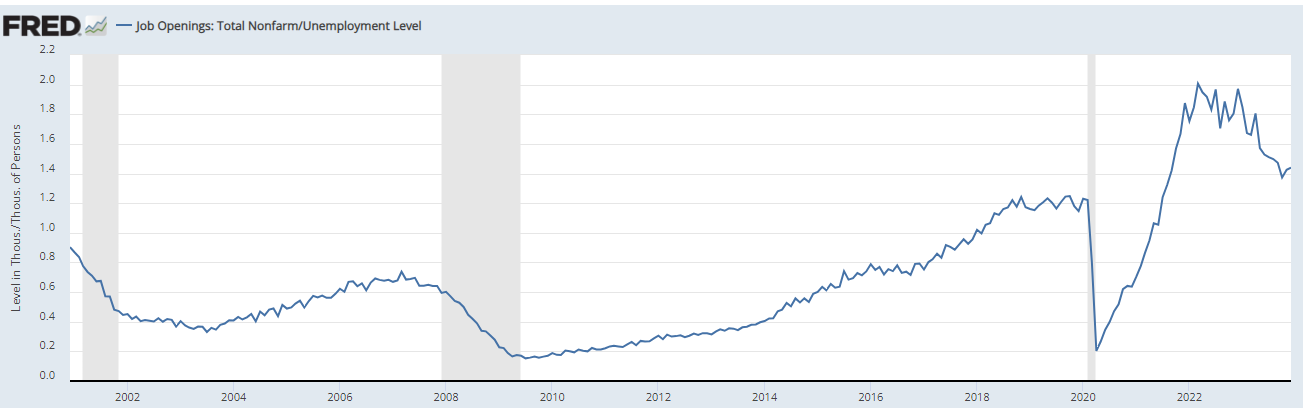
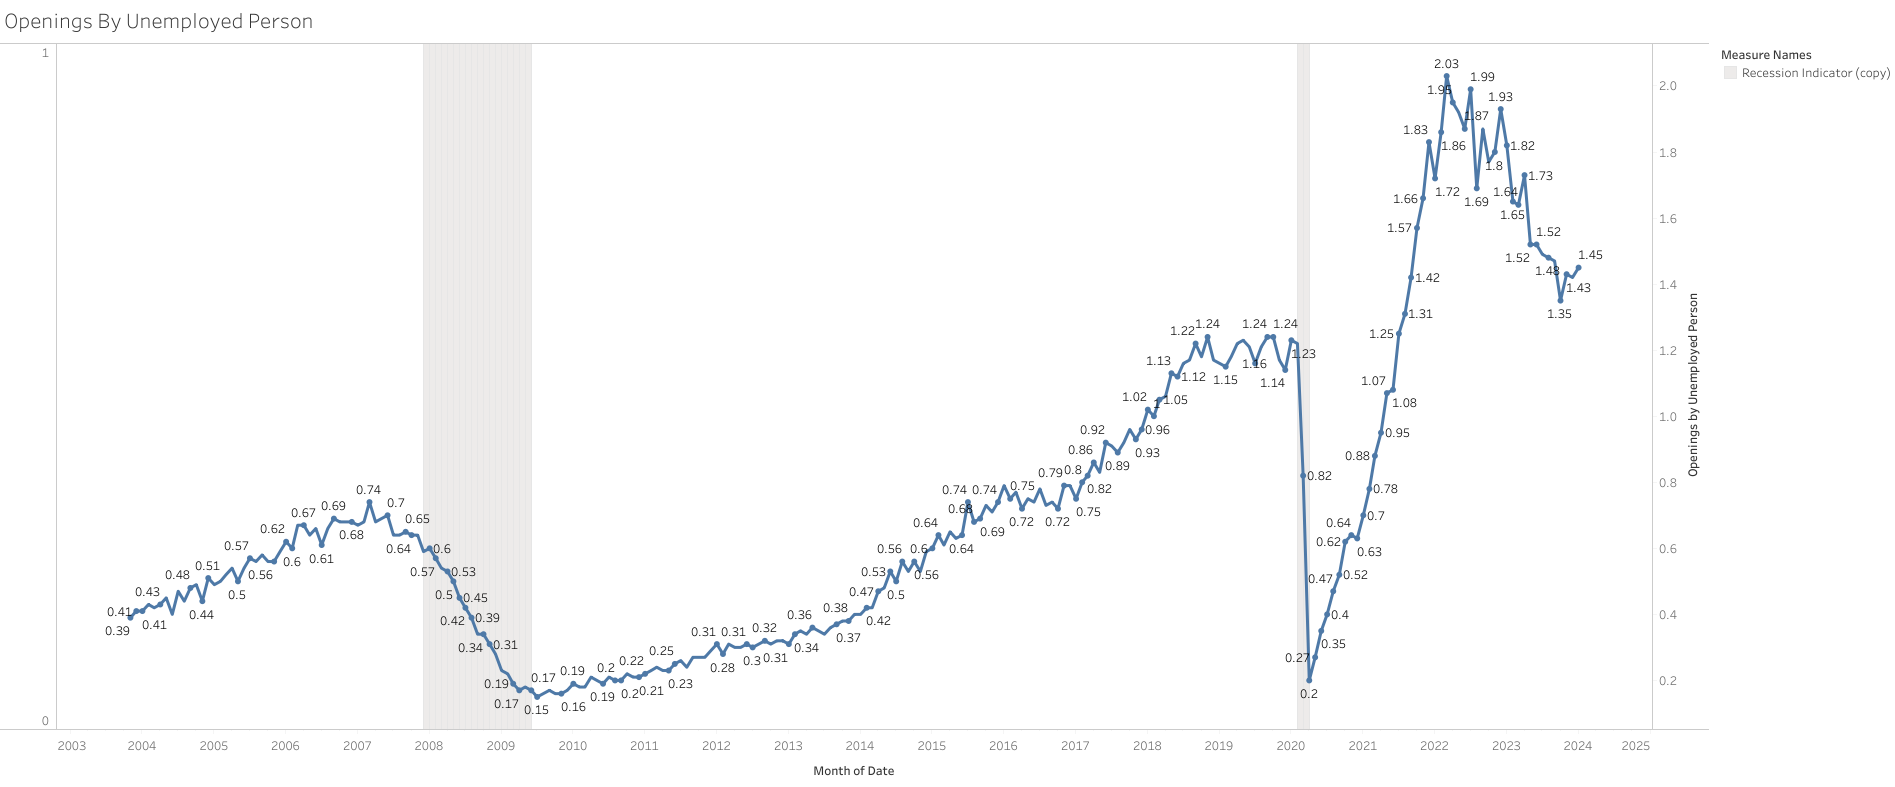
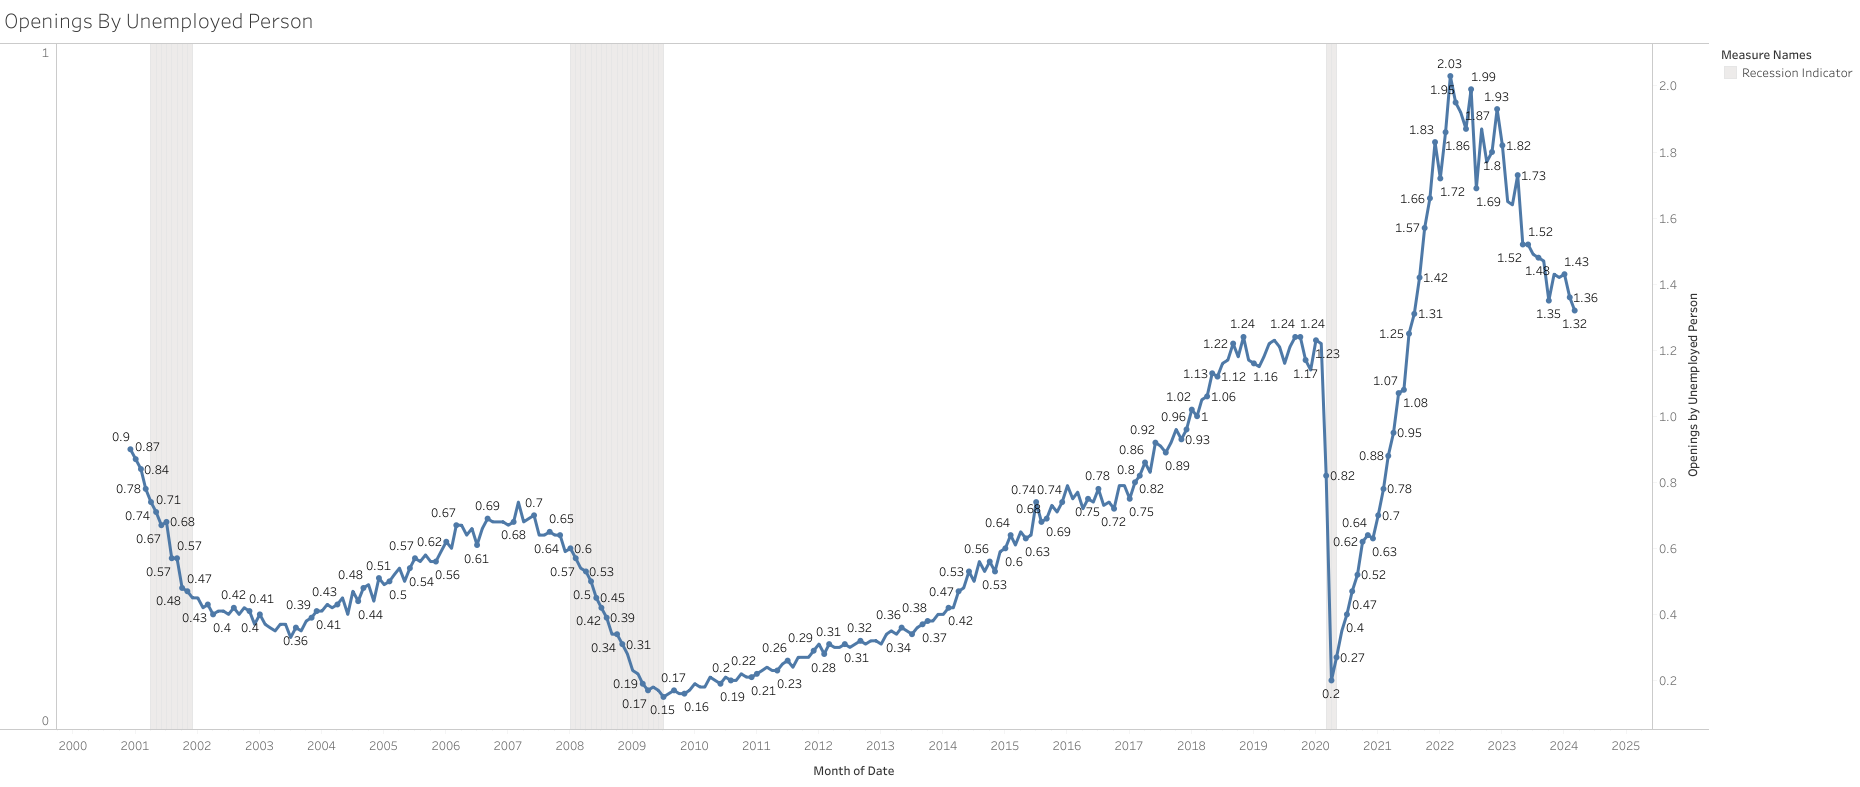
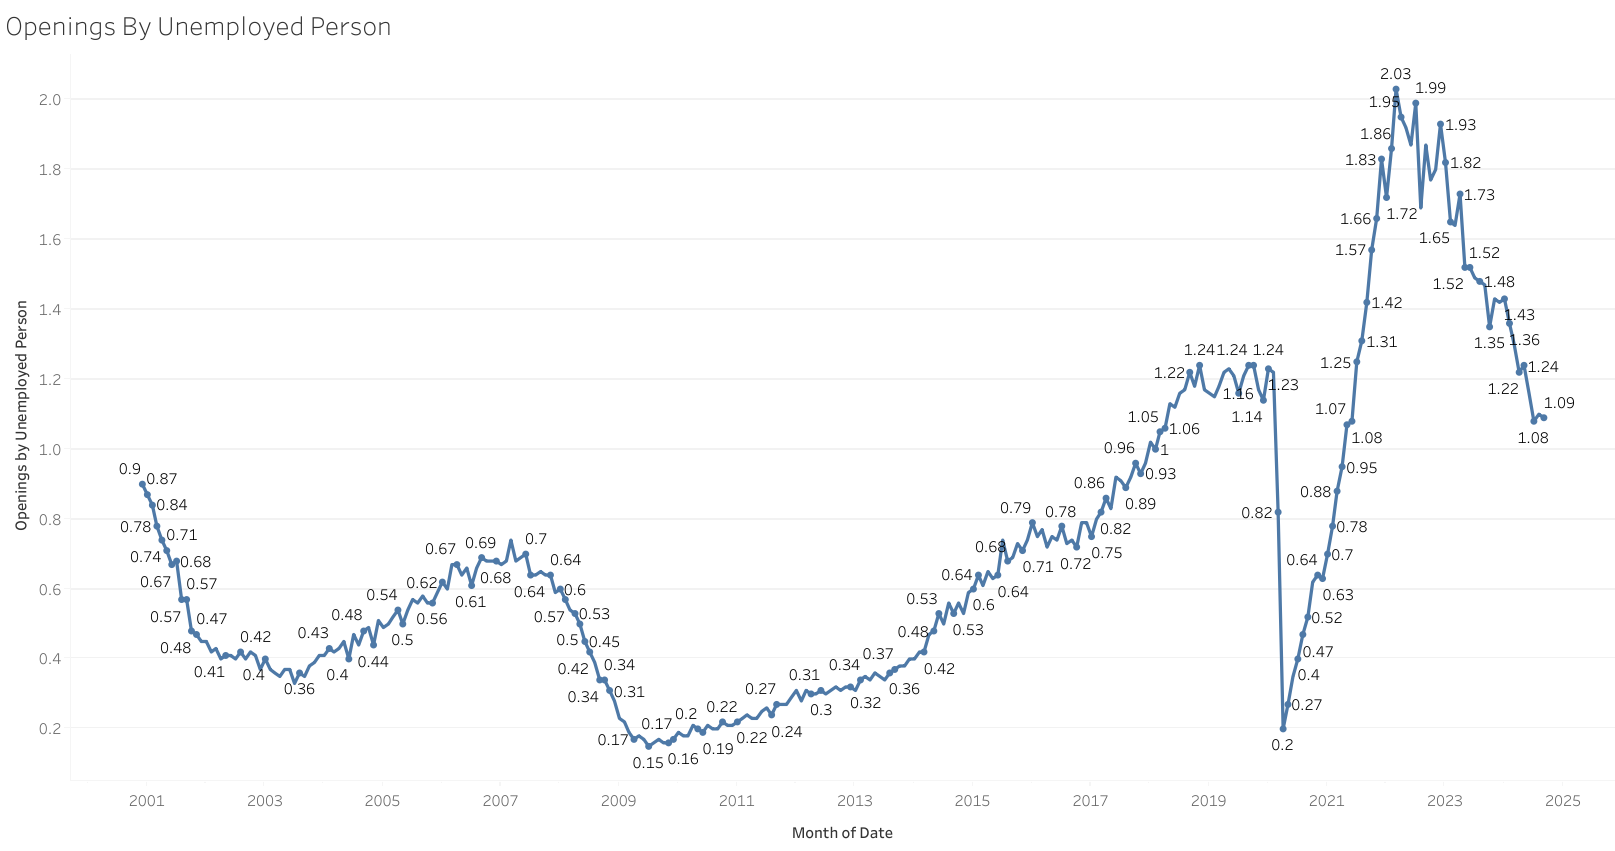
Openings per unemployed person remain stable at 1.44.
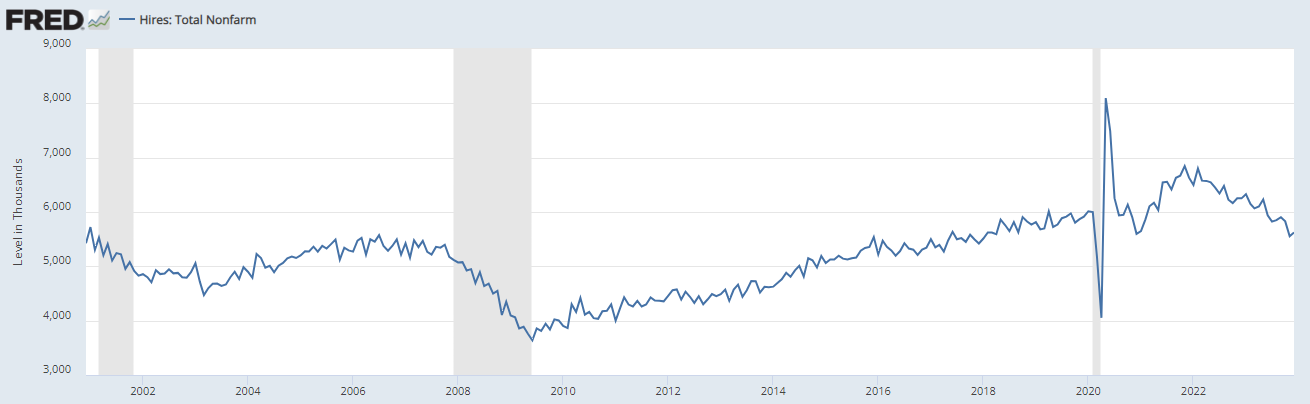
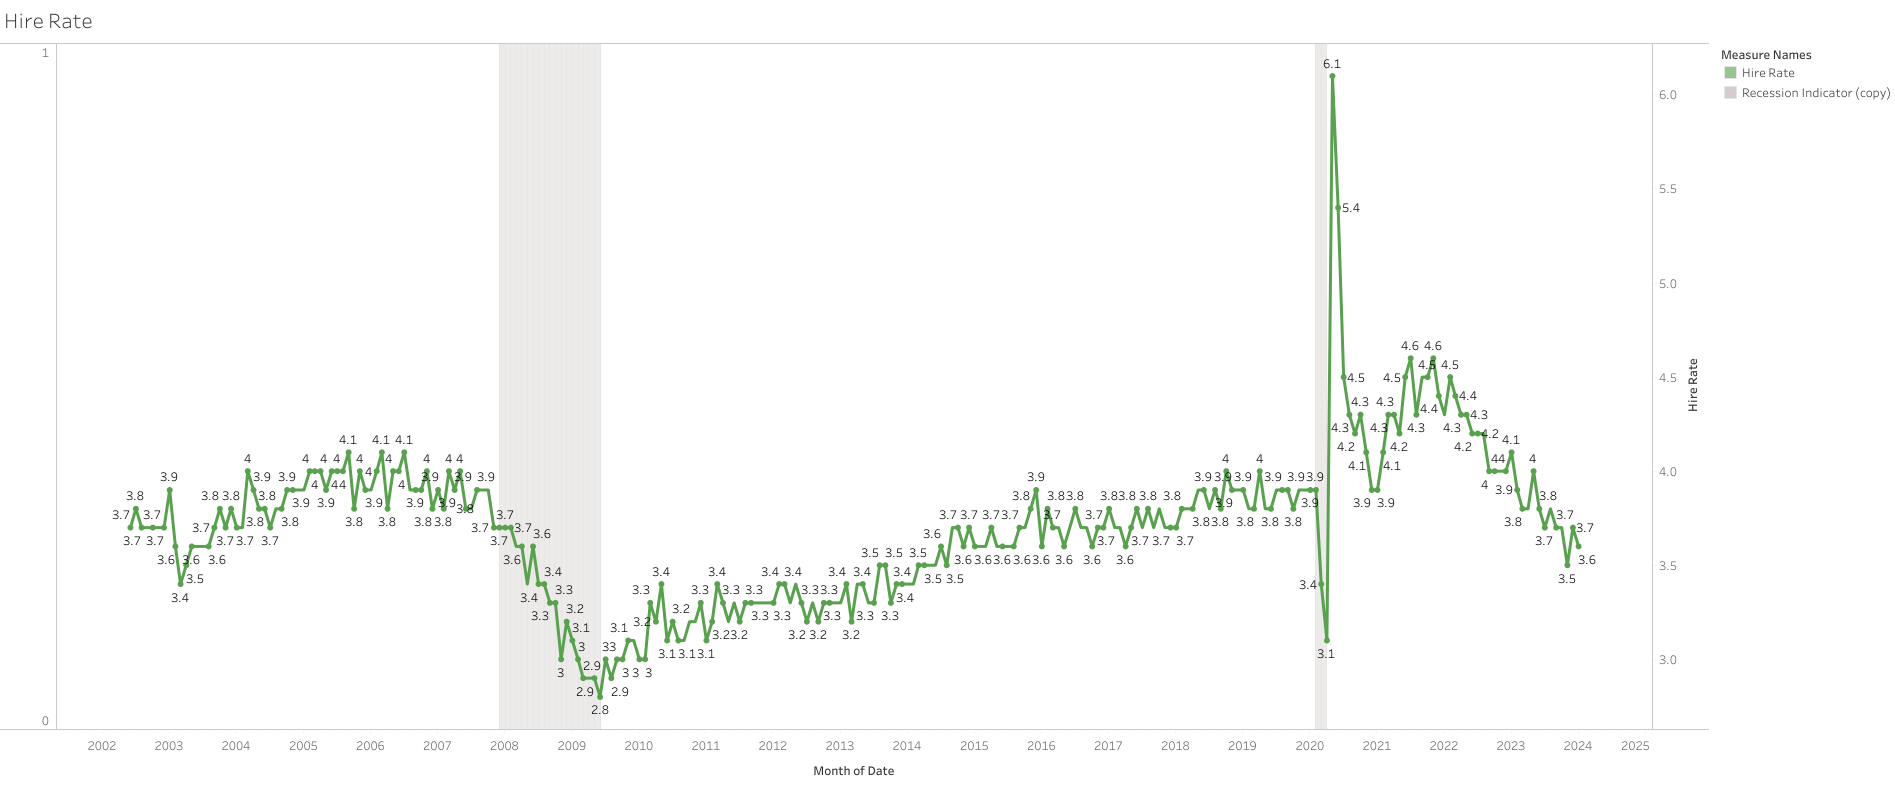
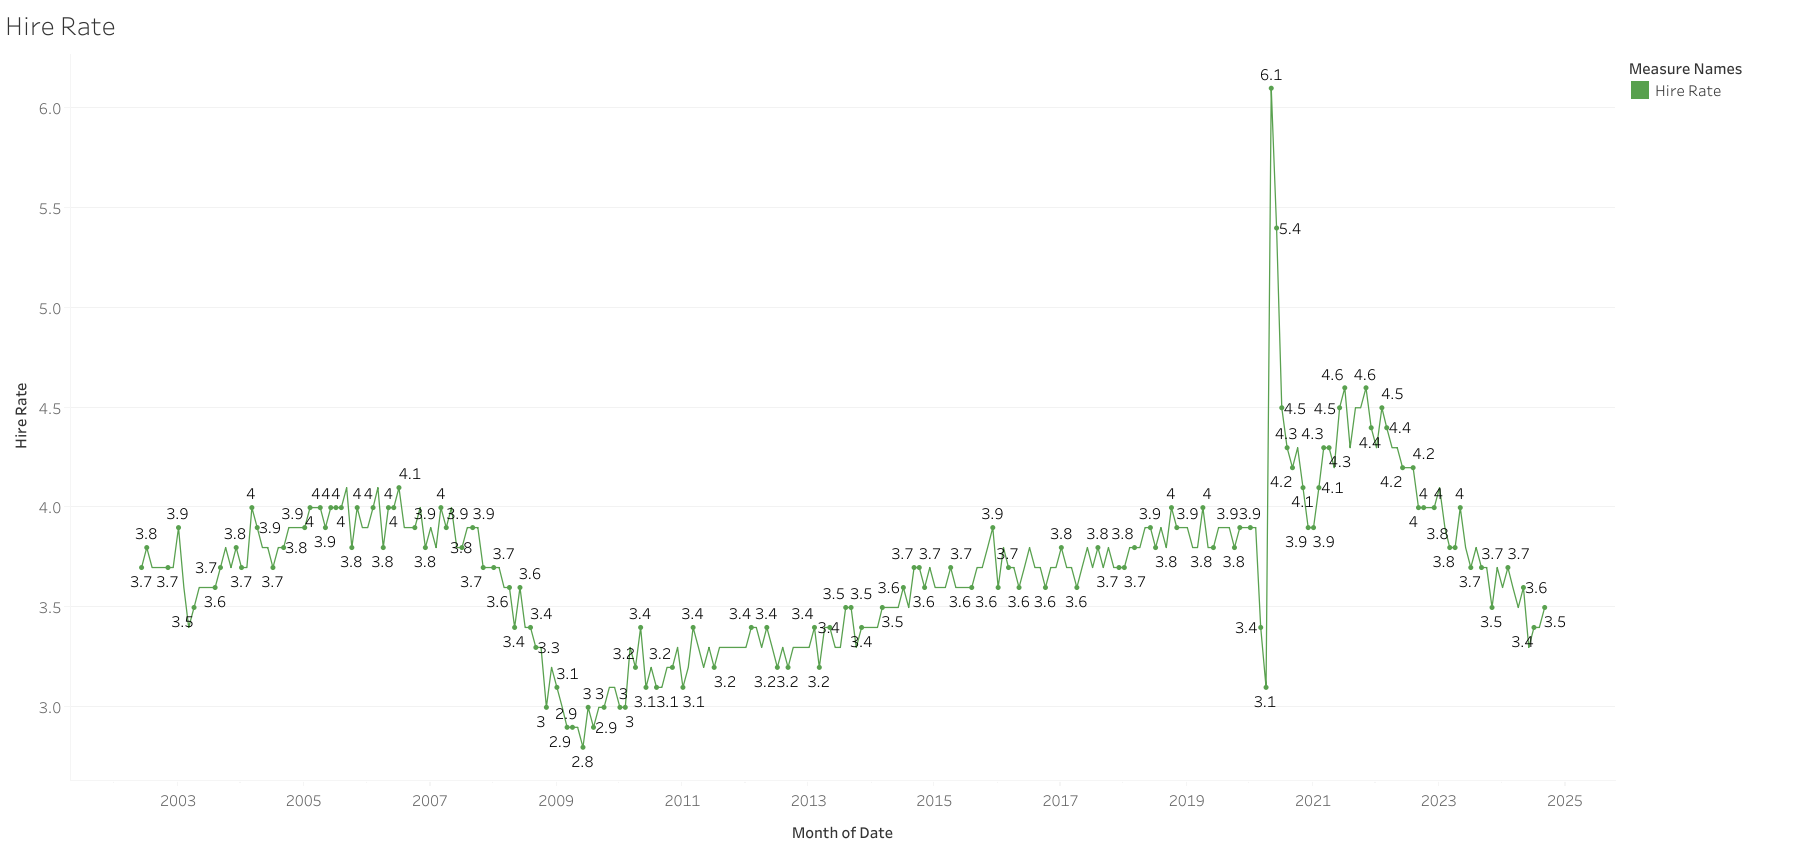
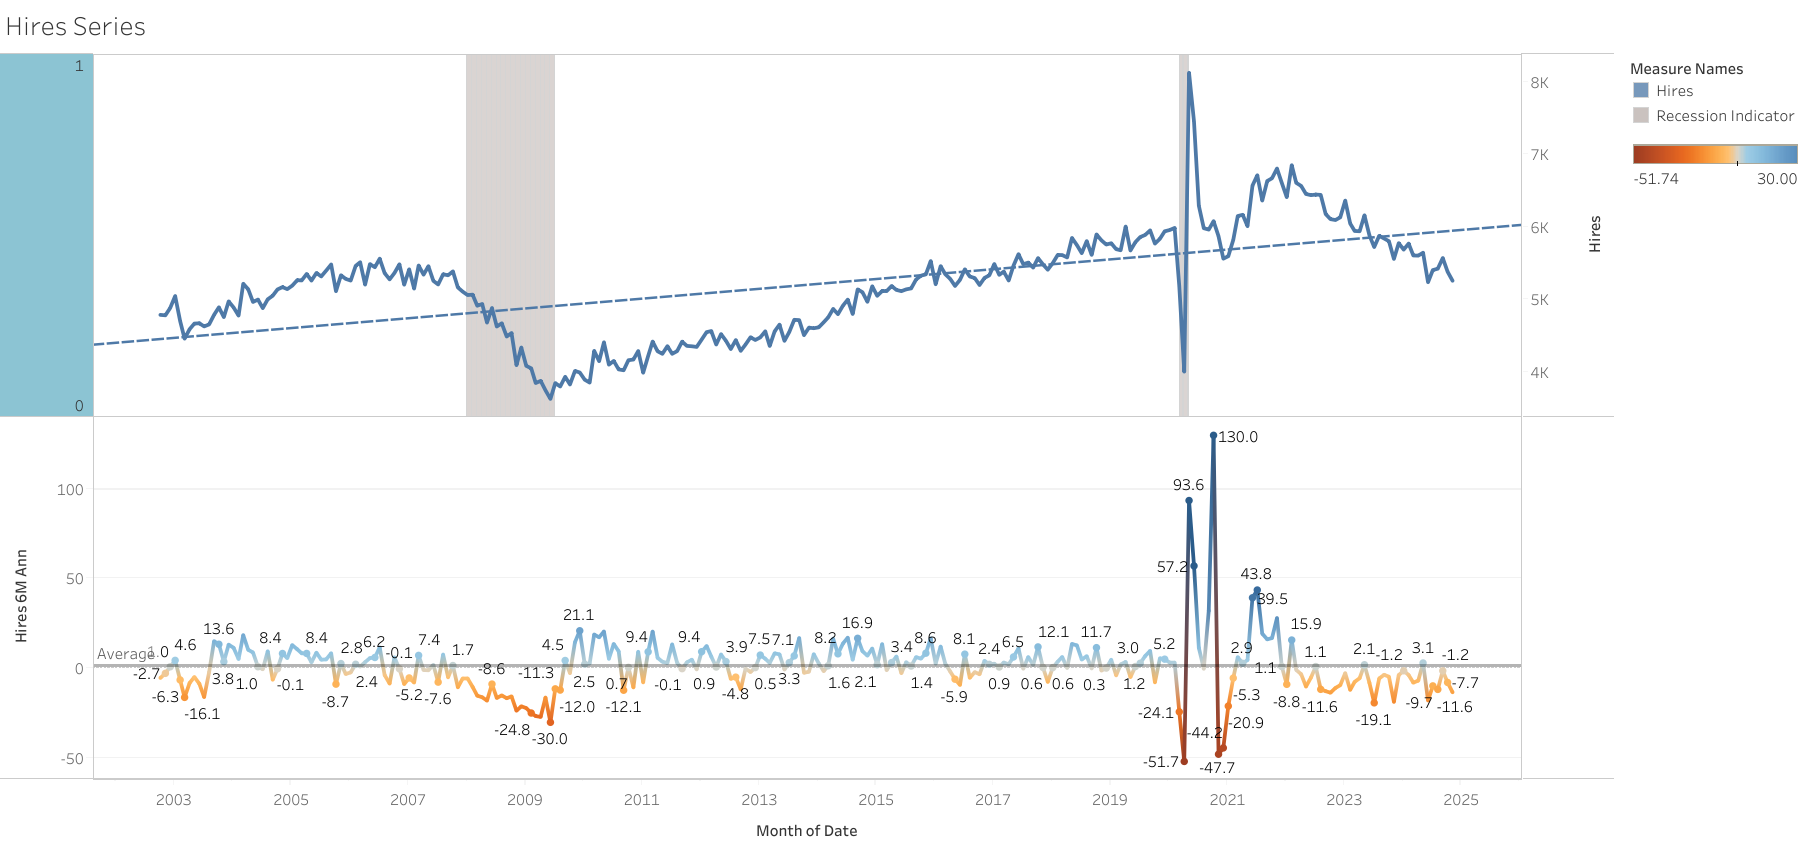
Hires increased 67k, but is still on the way to being below pre-pandemic levels
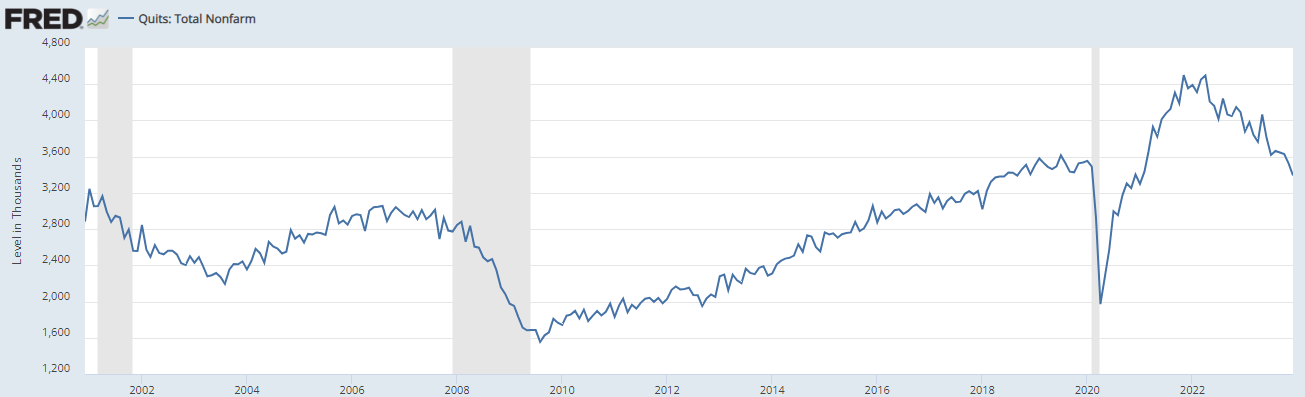
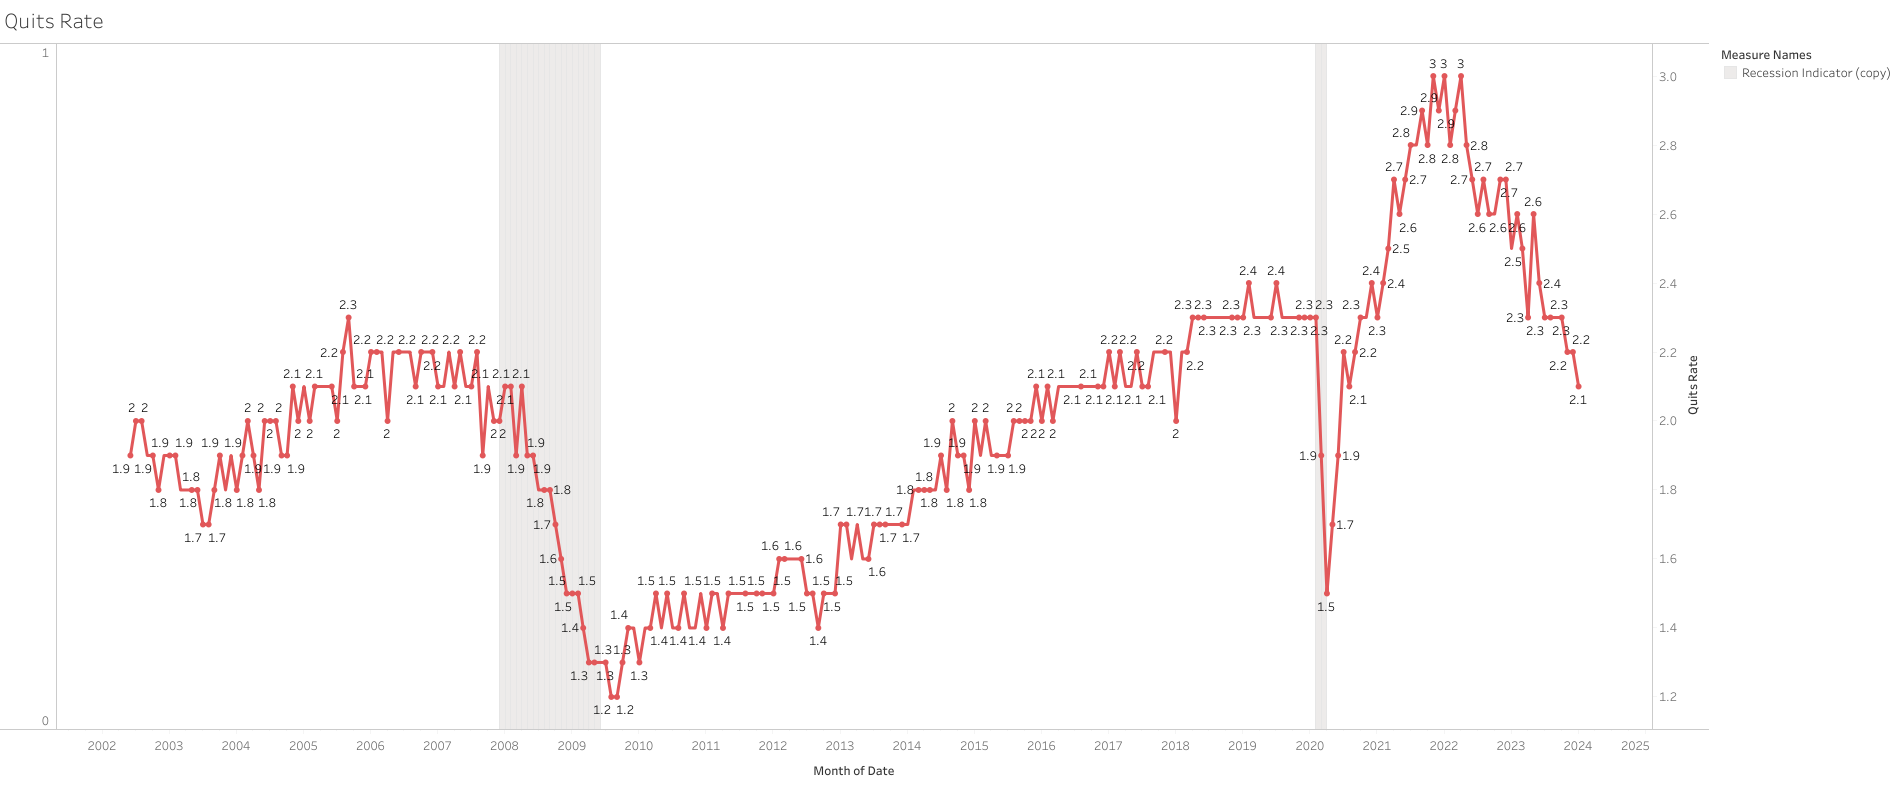
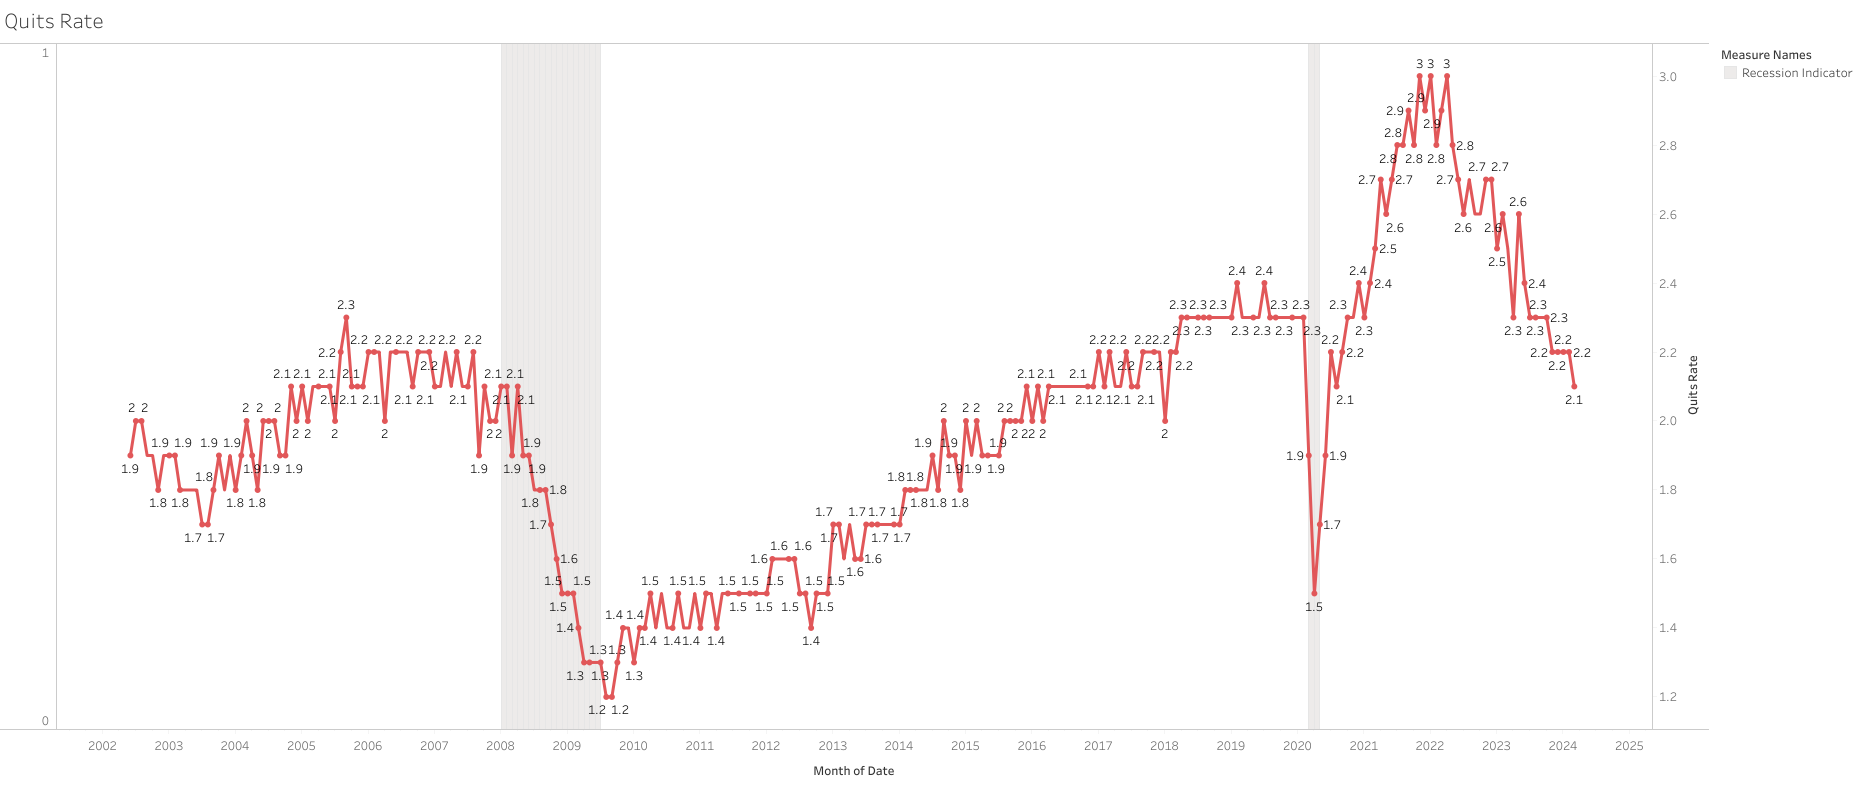
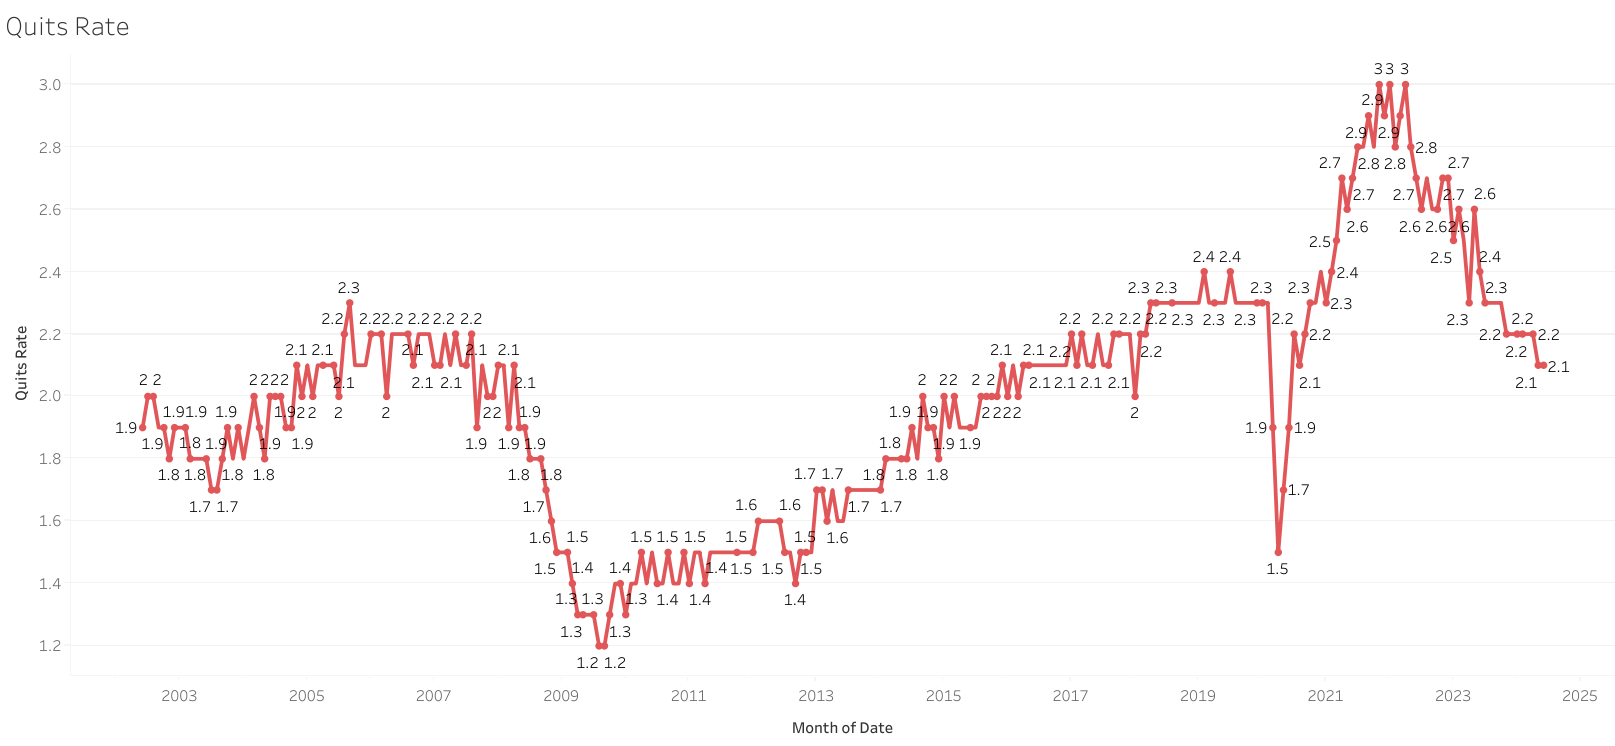
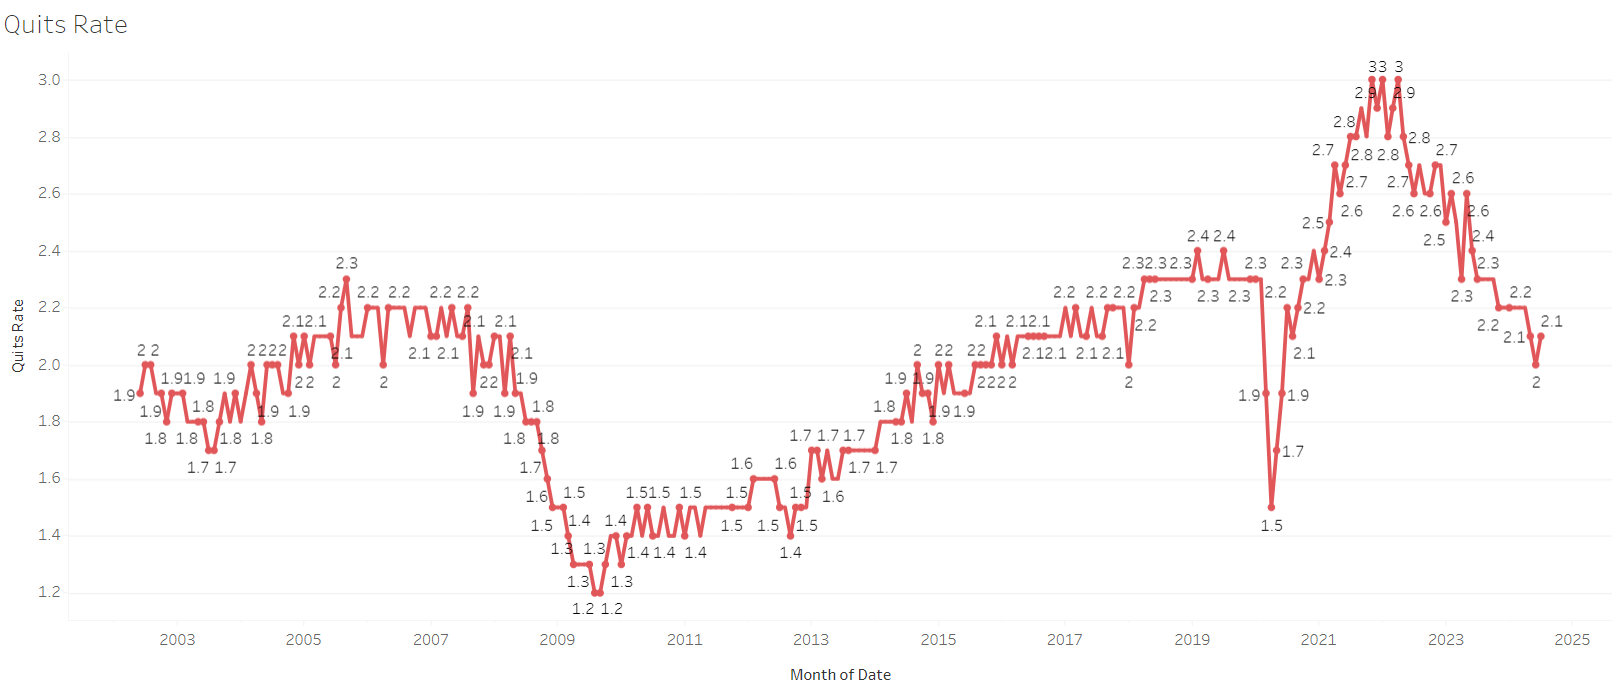
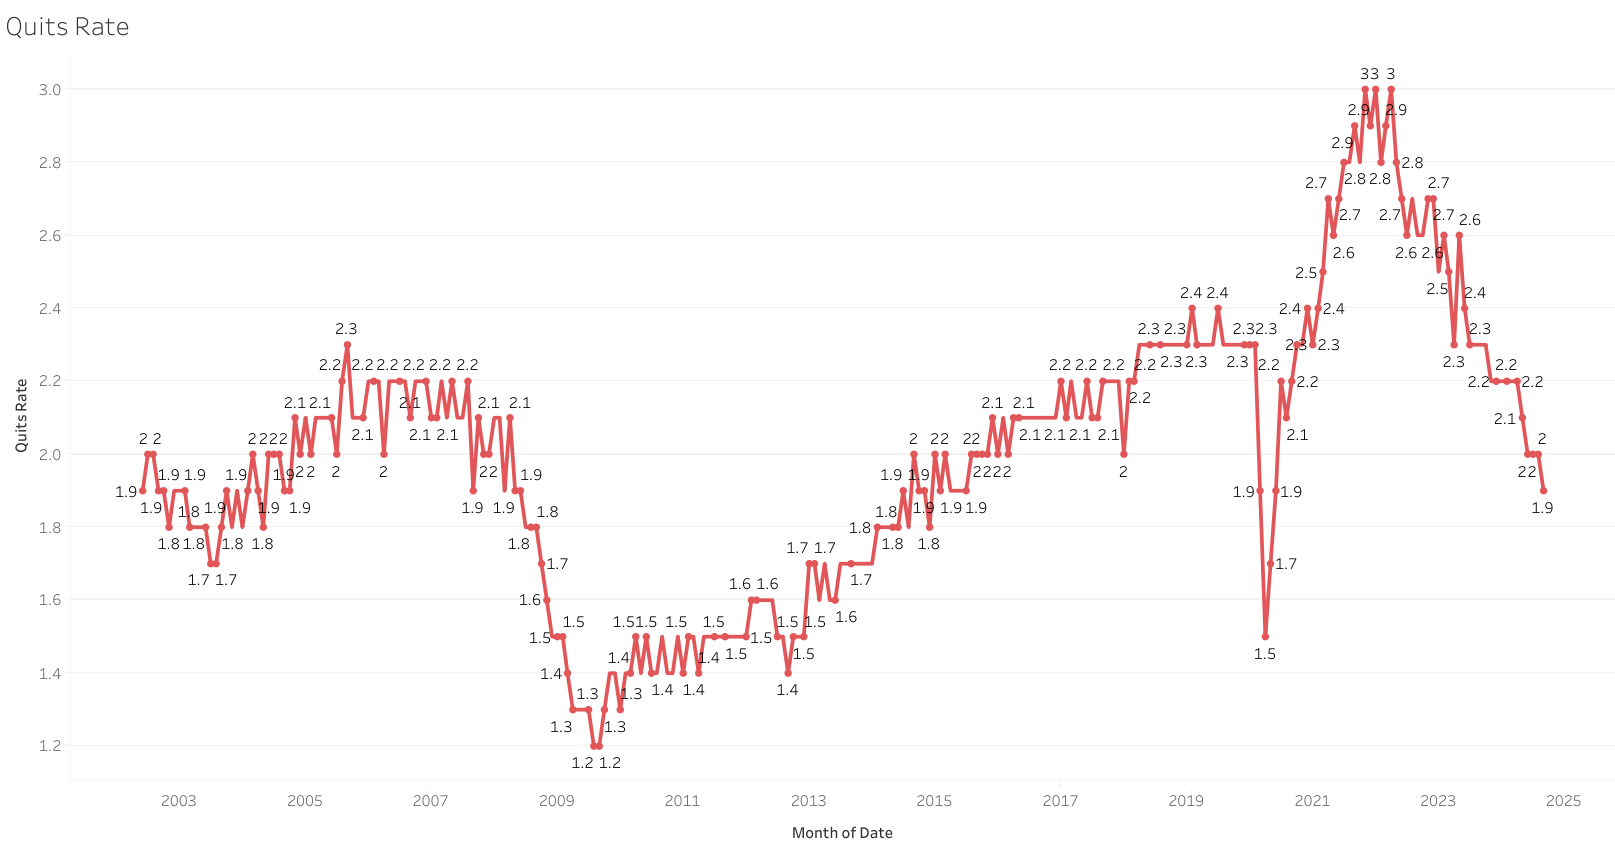
Quits (used to measure ability or easiness to change jobs) declined 132k, same trend of being below pre-pandemic levels.
Layoffs have been slowly increasing since lows in 2021/2022, but still below pre-pandemic levels.
https://www.bls.gov/news.release/jolts.nr0.htm
Even though this is a very volatile indicator, and these ups and downs are normal, with the downtrend still intact, and underlying data not really that strong, The market reacted negatively and pushed the probability of a rate cut in March lower, but with 6 cuts in 2024 still in place.

January JOLTS job openings down to 8.863M vs. 8.85M est. & 8.889M in prior month (rev down from 9.026M).
US is continuing on a downward path, but the rate of change is getting better for now.
Openings to Unemployed persons have been increasing a bit lately, still above pre-pandemic
Quits, indicating the easiness to change jobs, continue to decline, now below 2019 levels.
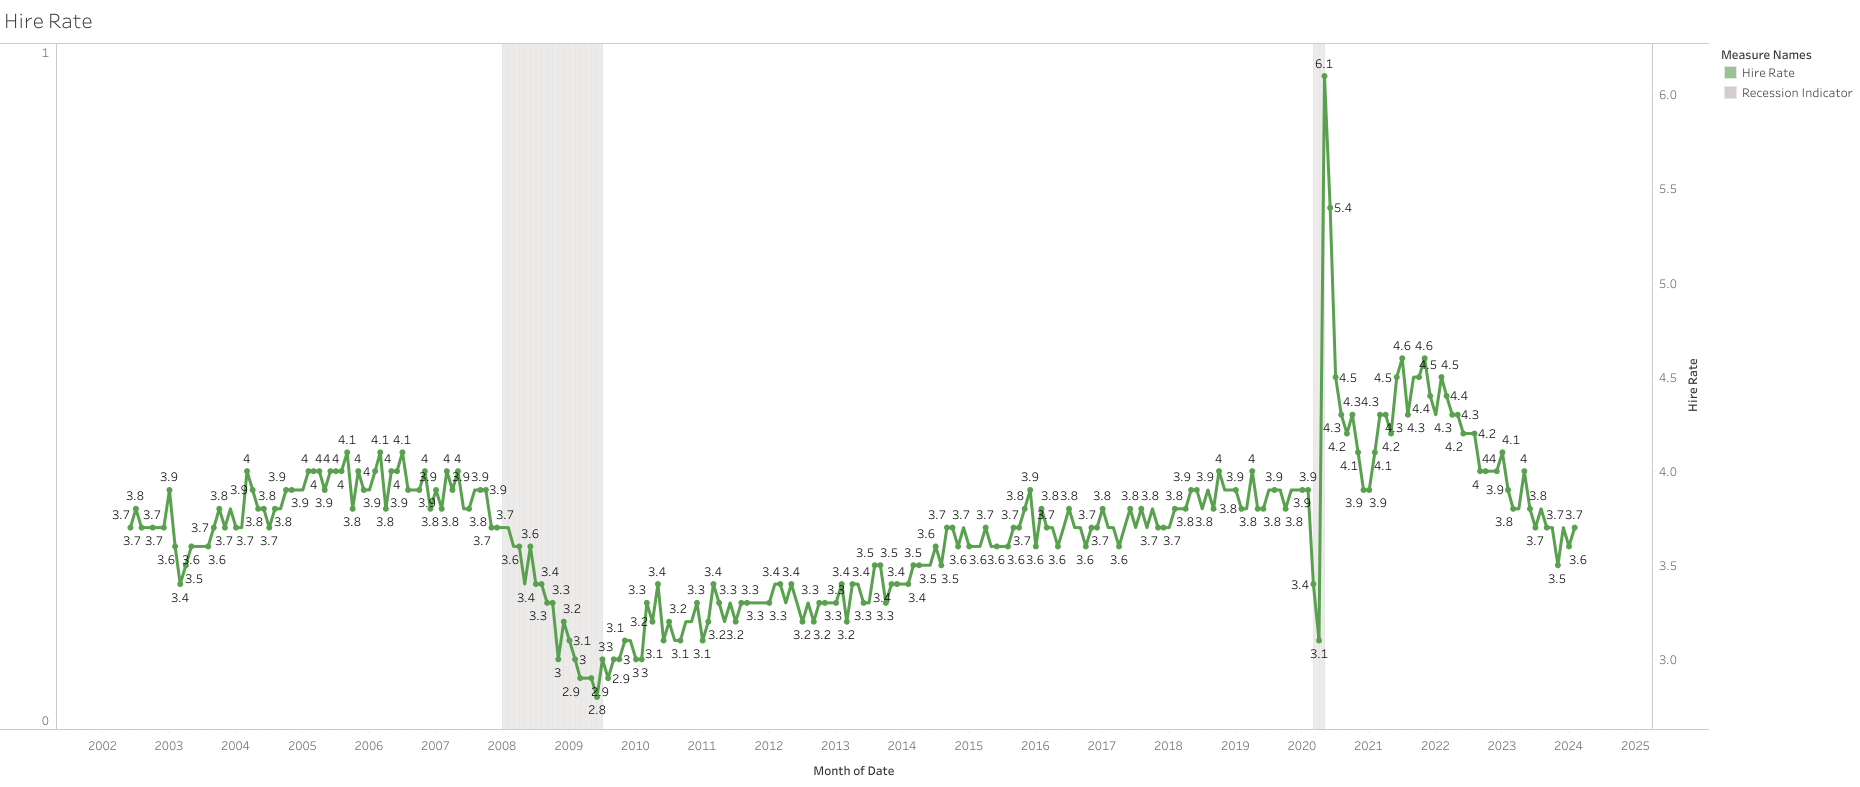
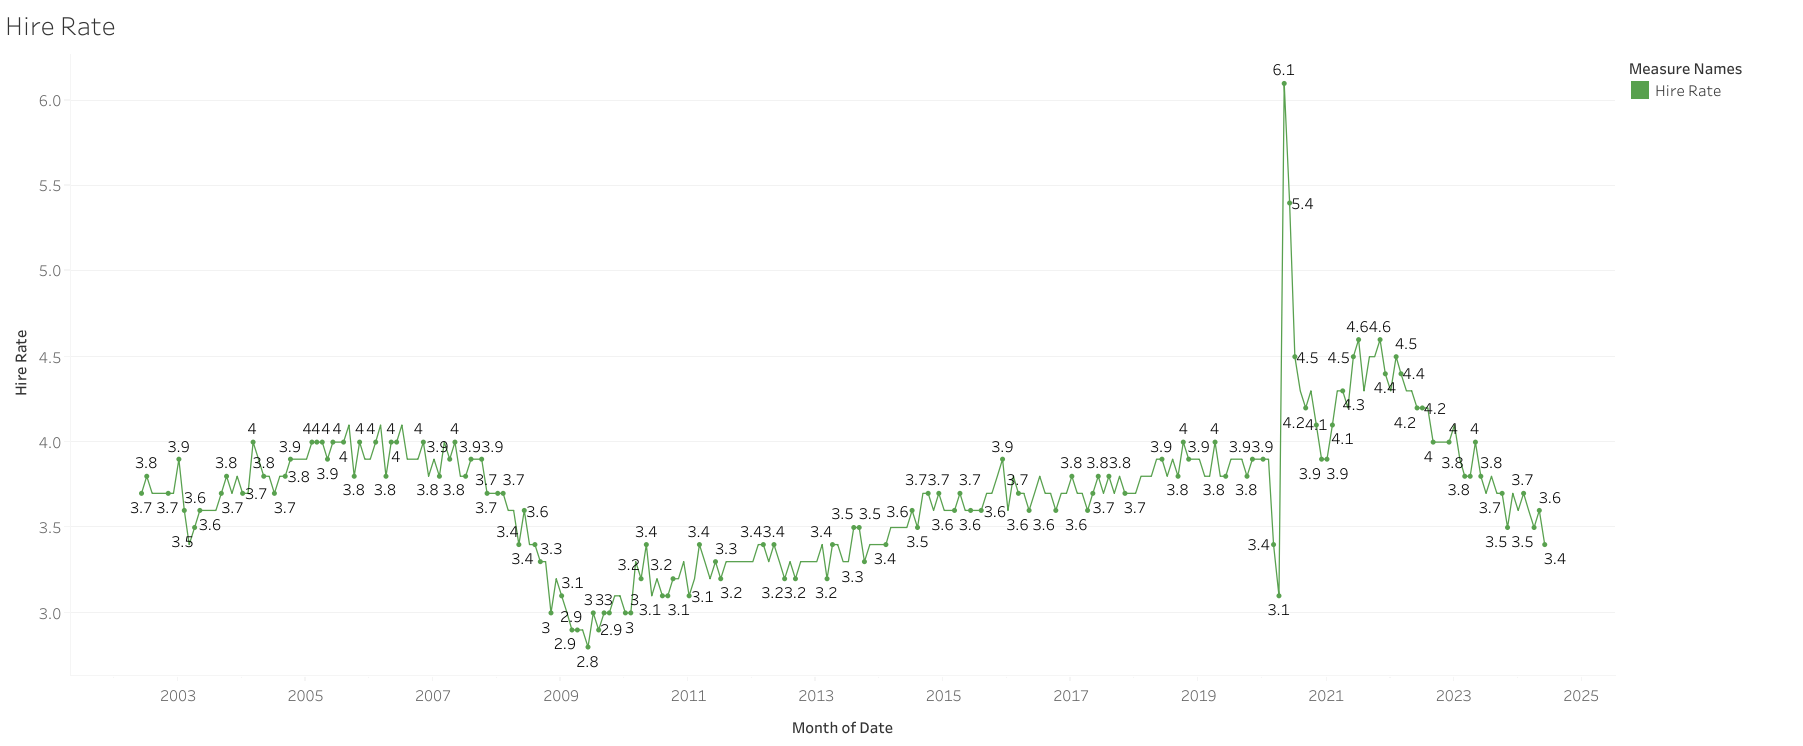
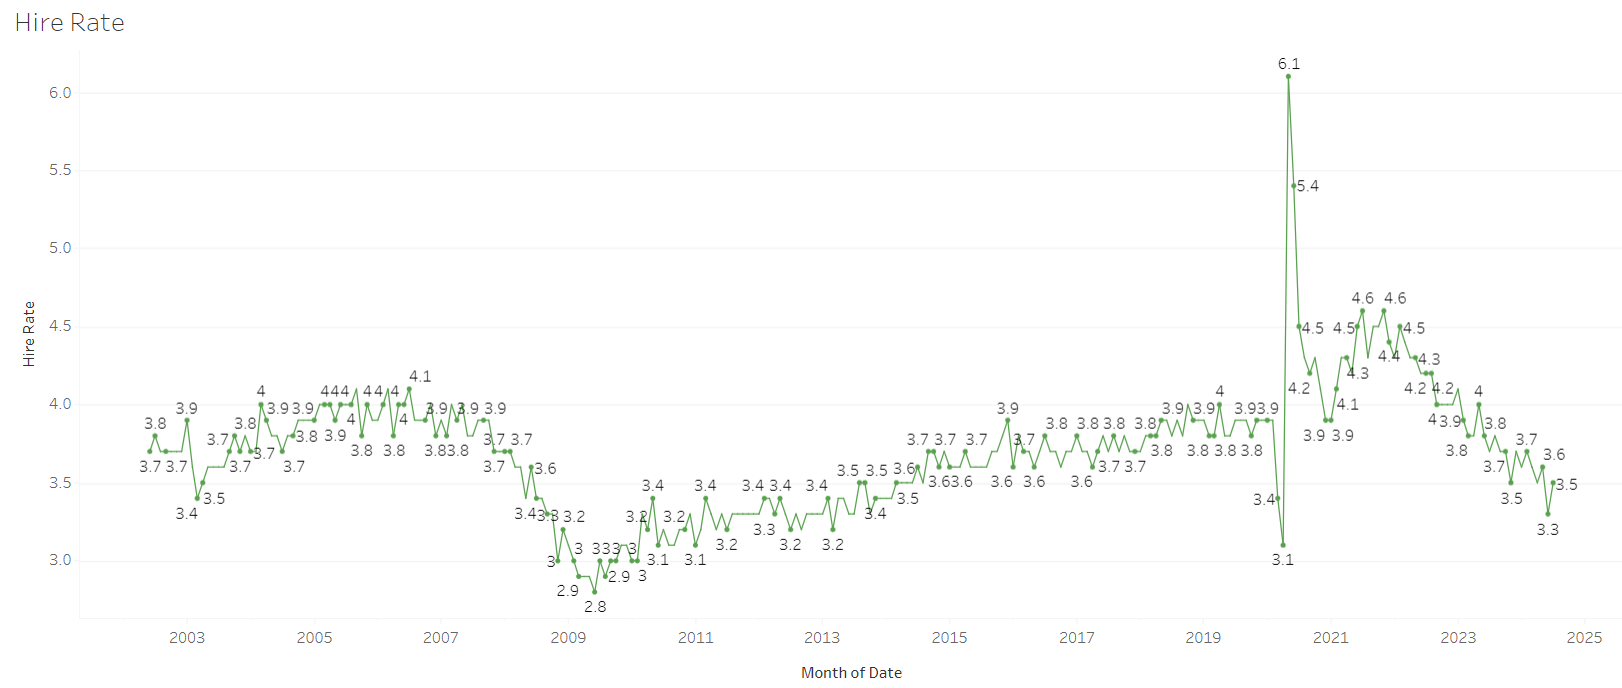
The hire rate is also continuing to slow.
There were negative revisions in all 2023, indicating that the labor market looked a bit weaker than originally published.
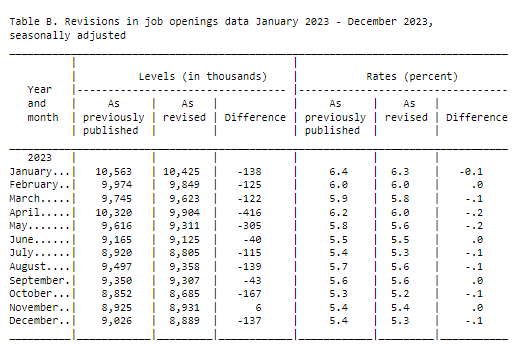
https://www.bls.gov/news.release/jolts.t01.htm
Are those time series displayed in our own tableau? Looks really cool.
Yes, I have the link in the description too. But I only started on it.
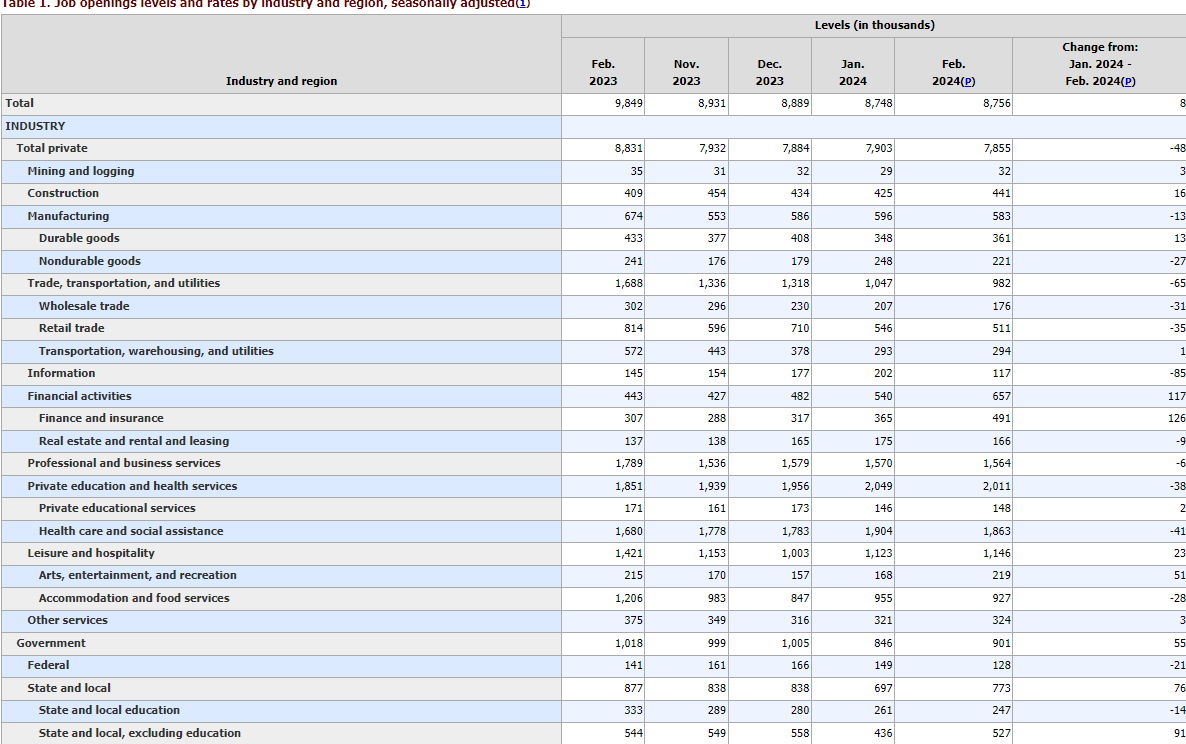
February JOLTS job openings 8.756 million vs. 8.73 million est. & 8.748 million in prior month (rev down from 8.863 million).
There is not much new in this report.
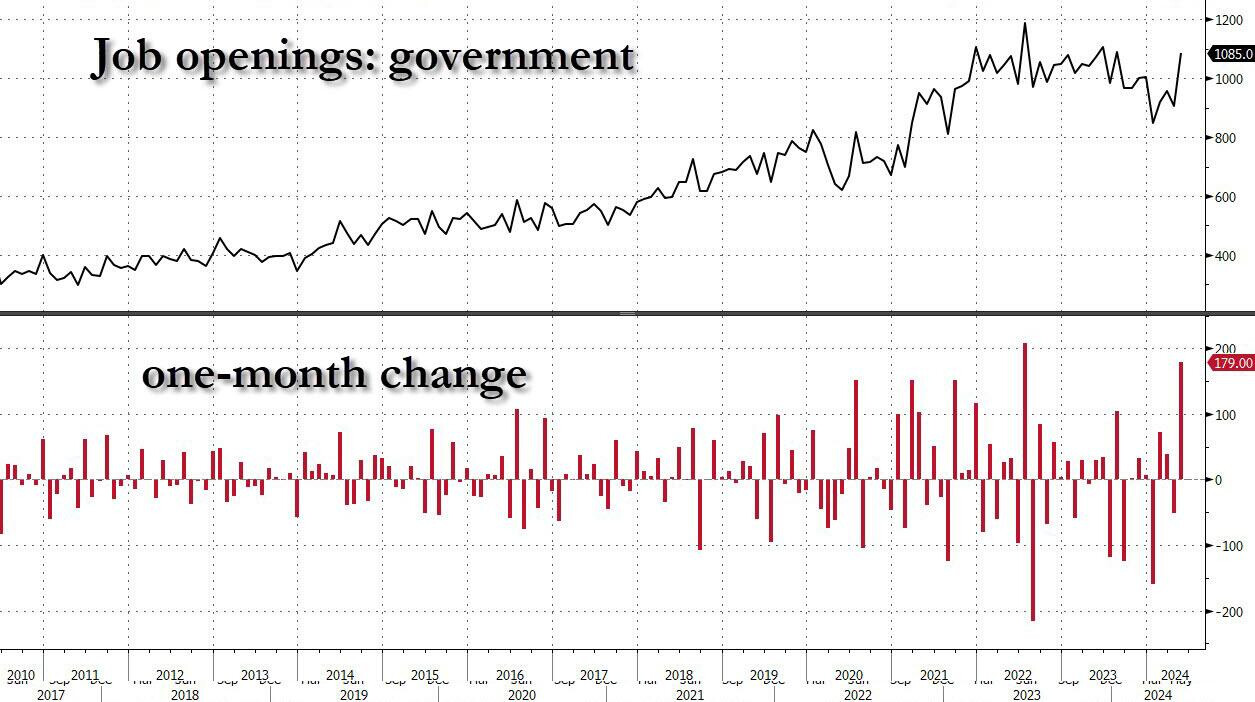
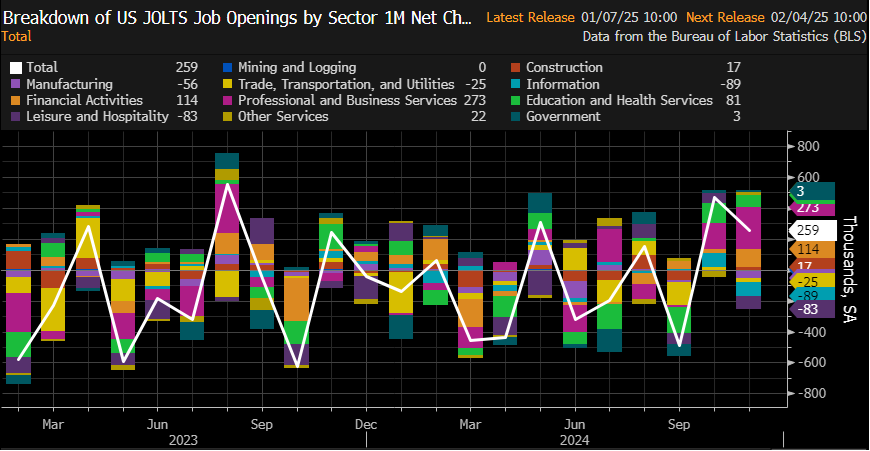
This month’s net increase came mostly from the government sector.
Job Openings per unemployed person declined due to last month’s increase in unemployment.
Hiring rate increased a bit, and quit rate was unchanged.
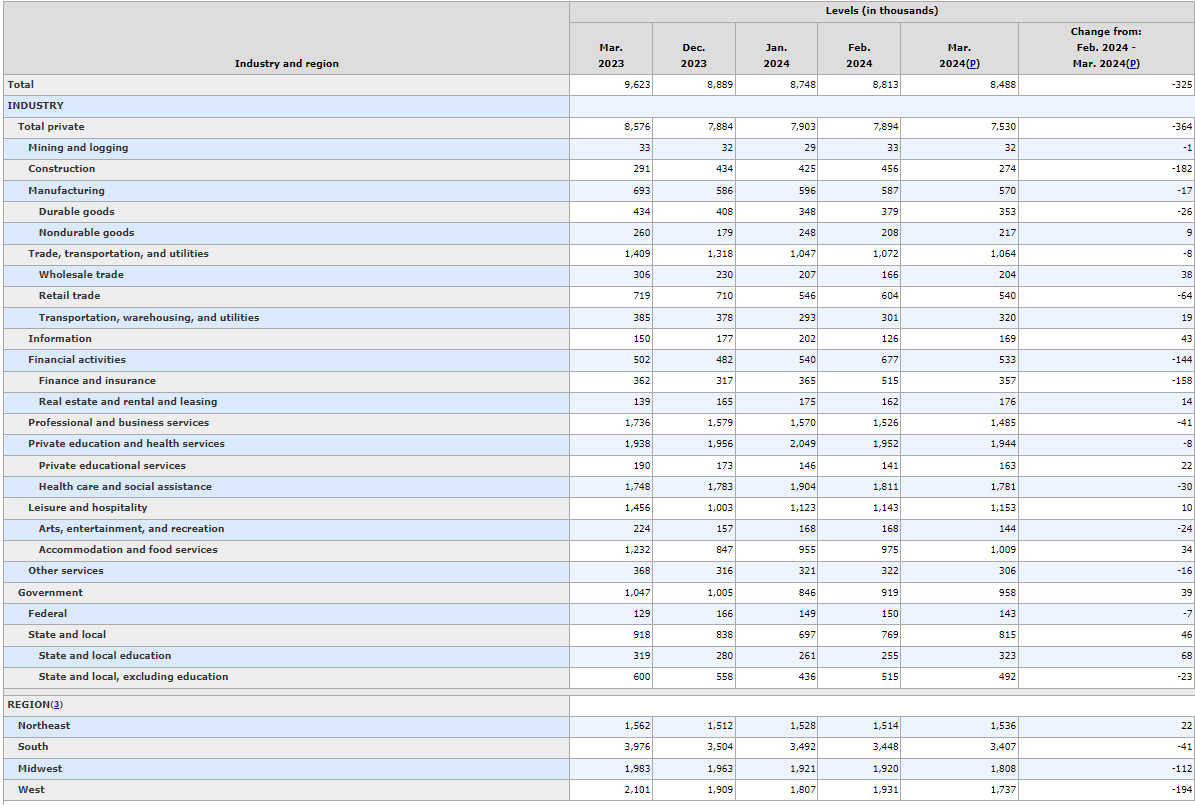
Weak report for Job openings in March 2023. Q1 2024 ends with 401k losses in job openings, similar to the -418K in Q4 2023.
The decline in job openings was concentrated in the construction and finance and insurance industries. Particular interest is the unprecedented decline in the construction sector, which, could potentially be an outlier, but it is worth monitoring given its significance as a key industry
Hires and quit rates remain lower than 2019 levels.
https://www.bls.gov/news.release/jolts.nr0.htm
Data: US Economic Data - Google Sheets
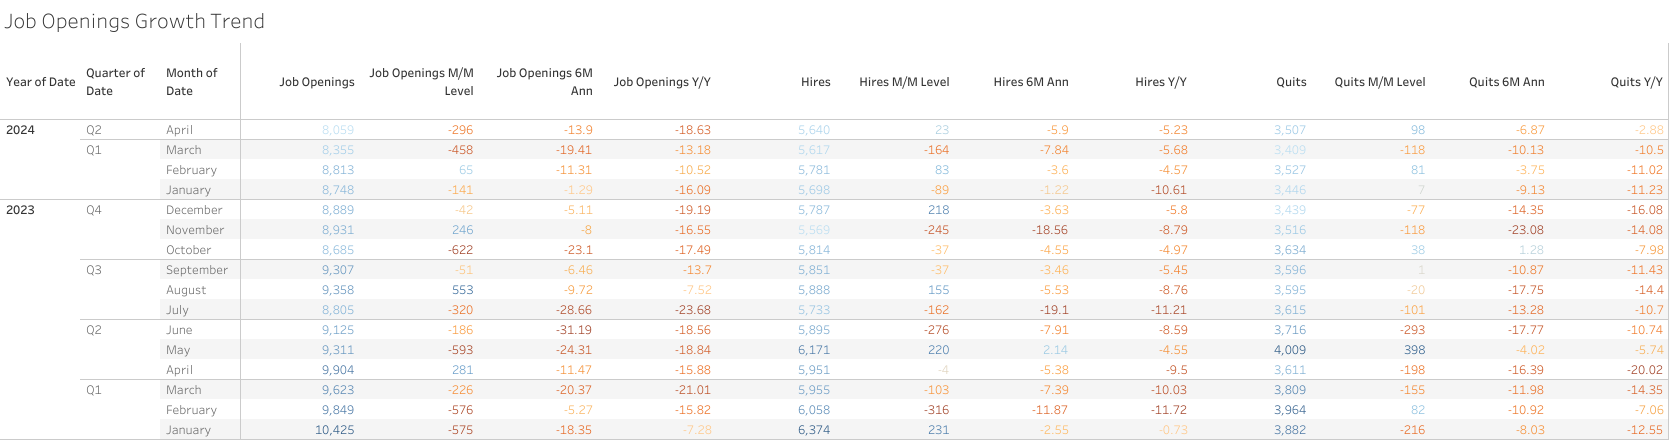
Job openings continue to cool down, with a rather big miss in April 2024.
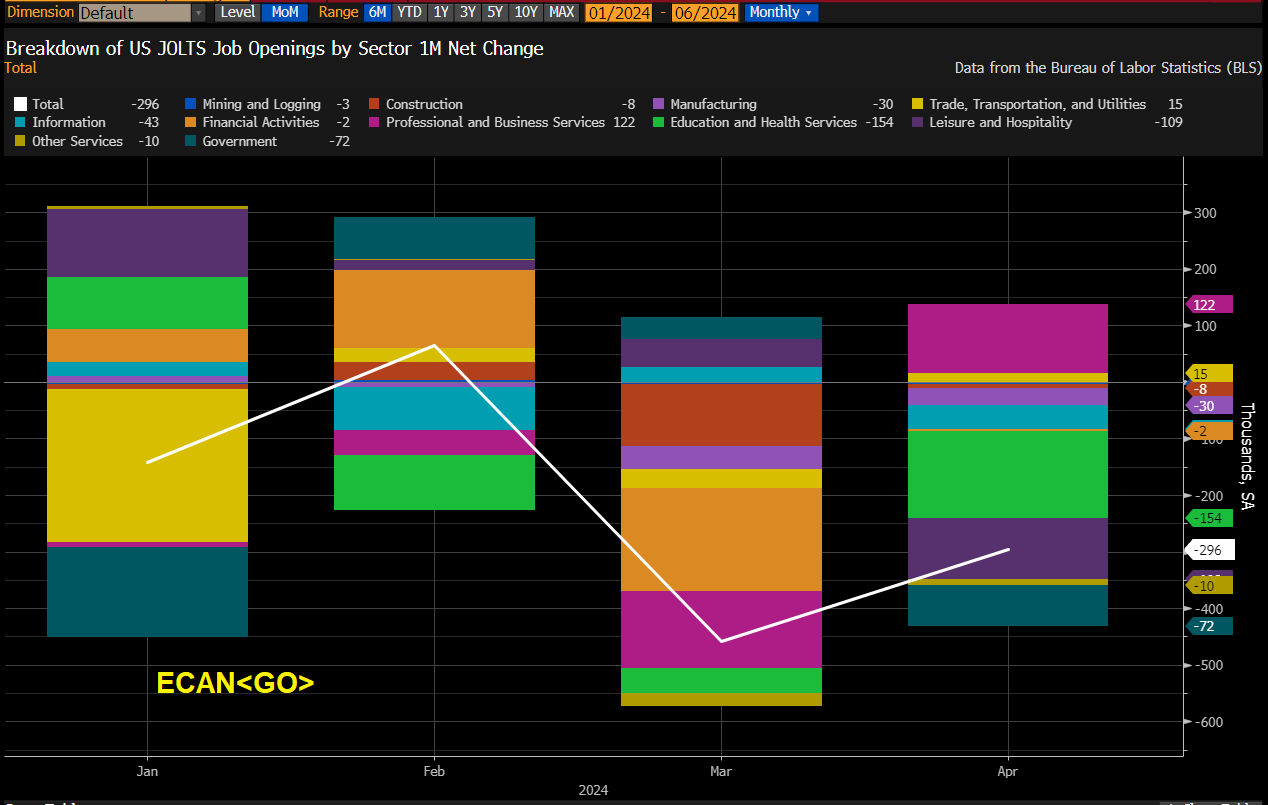
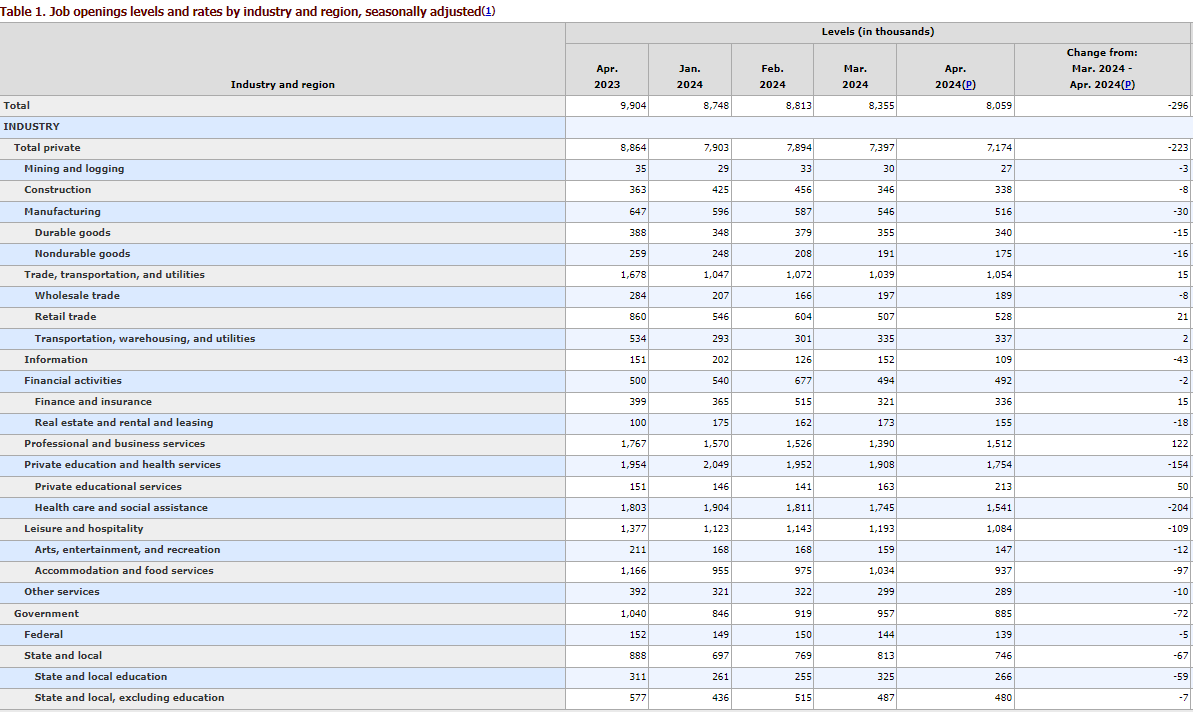
April job openings declined by -296K (-754K in the 2 recent months), they fell to 8.06M vs. 8.35M est. & 8.36M in the prior month. It is now the lowest since February 2021
March job openings were also revised lower from 8.488 million to 8.355 million.
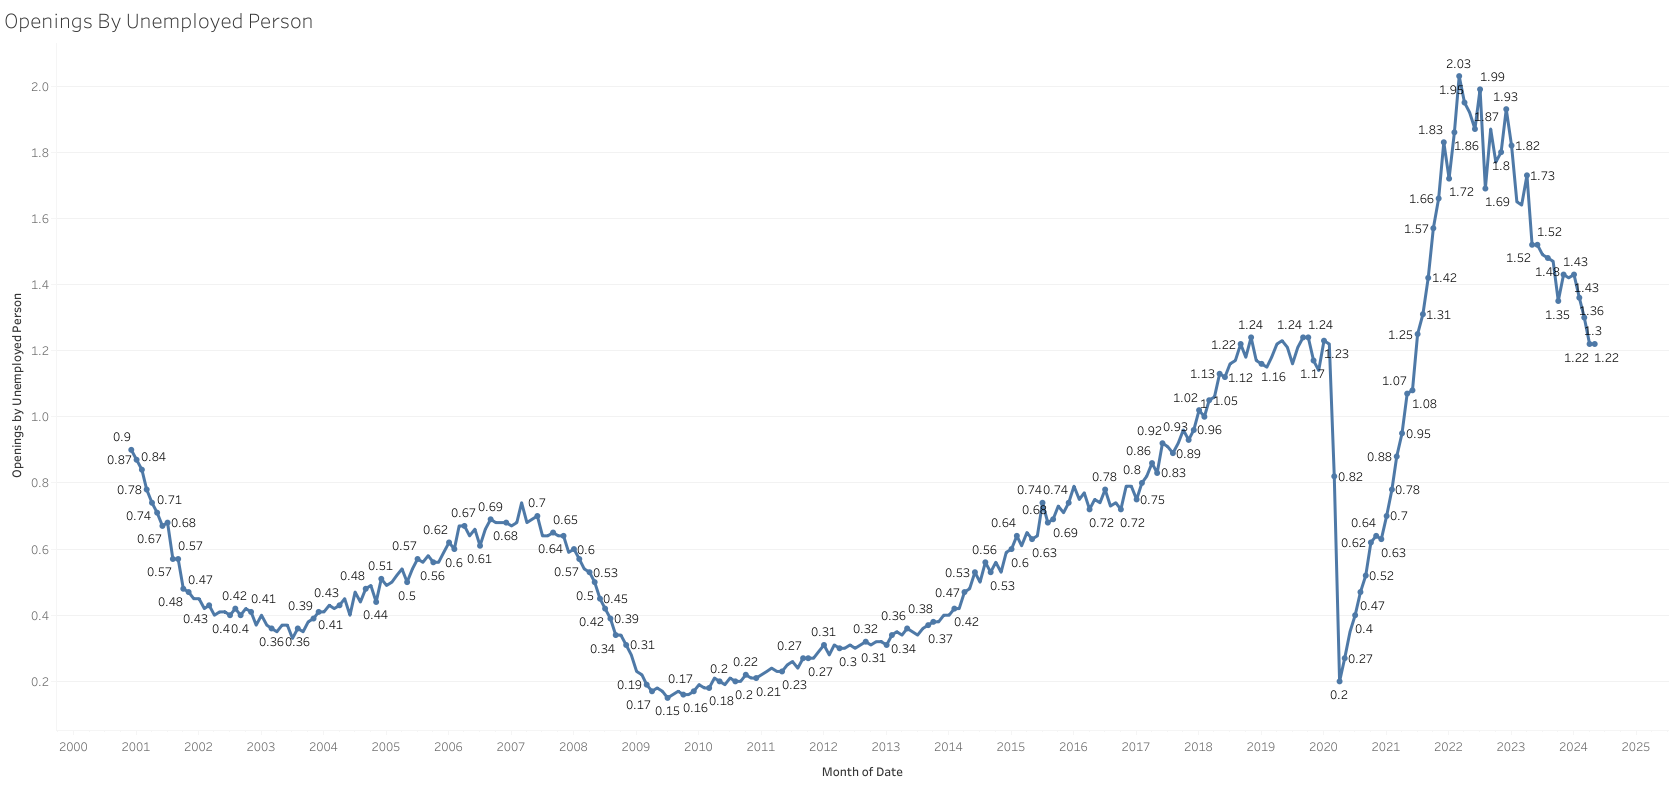
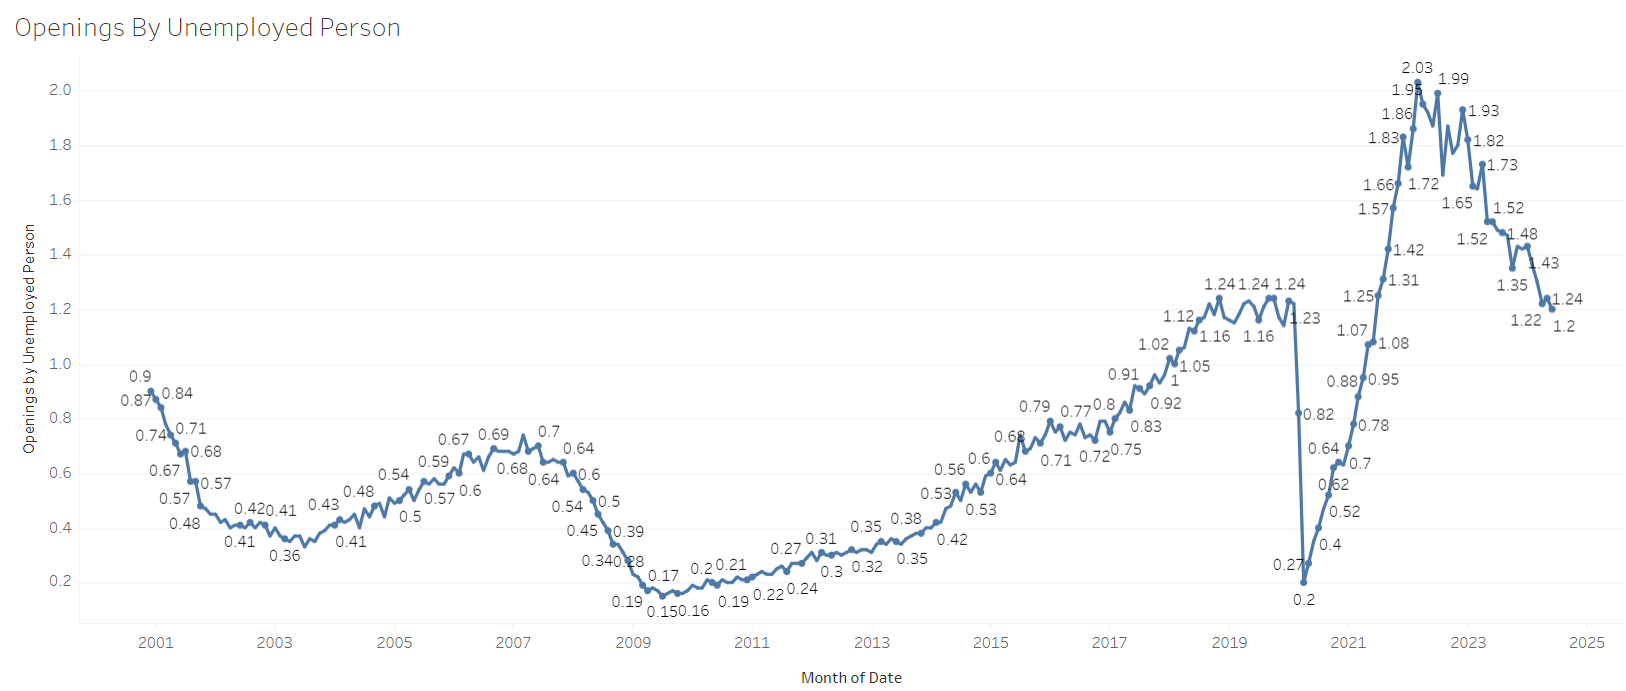
Job openings per unemployed person fall to 1.24, returning to pre-COVID levels.
The decline in openings was broad between sectors
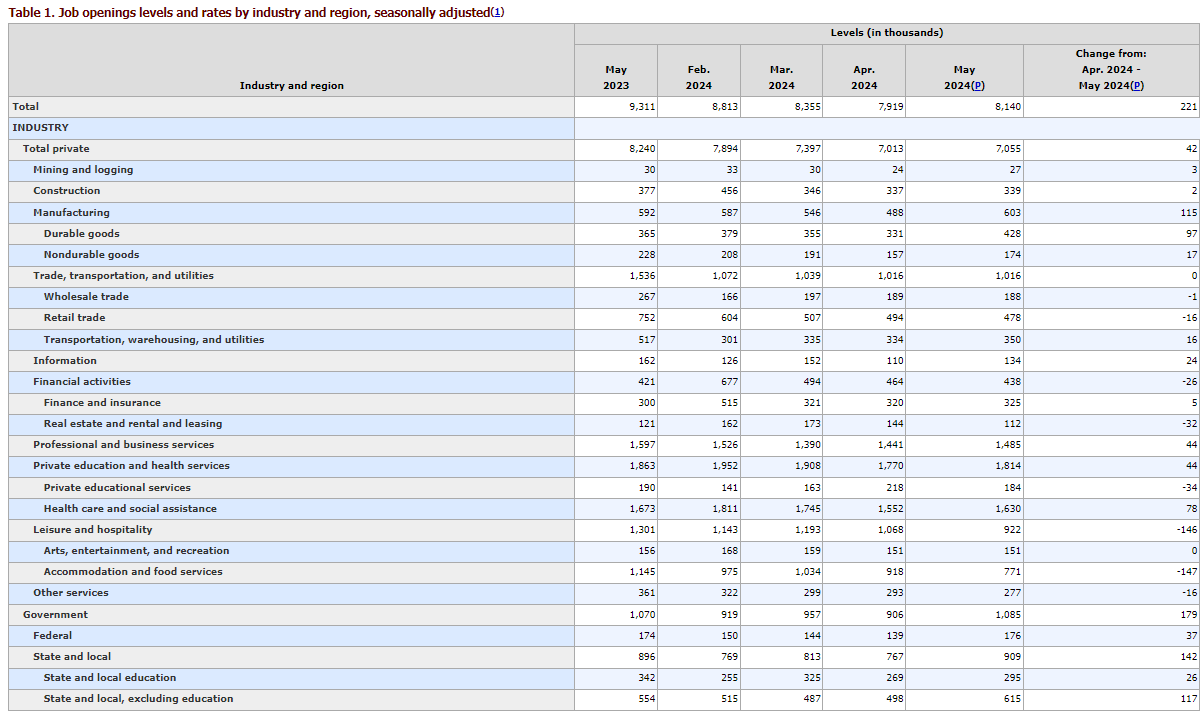
Job openings increased by 221k during May, but the April numbers were revised by 140k at the same time,so on net there are no significant changes, down over 12% Y/Y
Openings per unemployed remained the same at 1.22, back to pre-pandemic levels
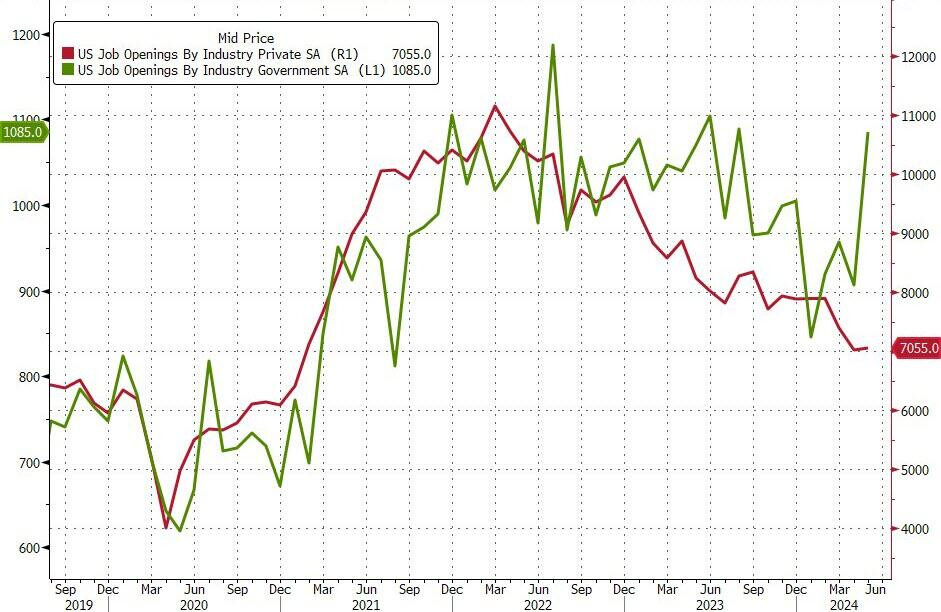
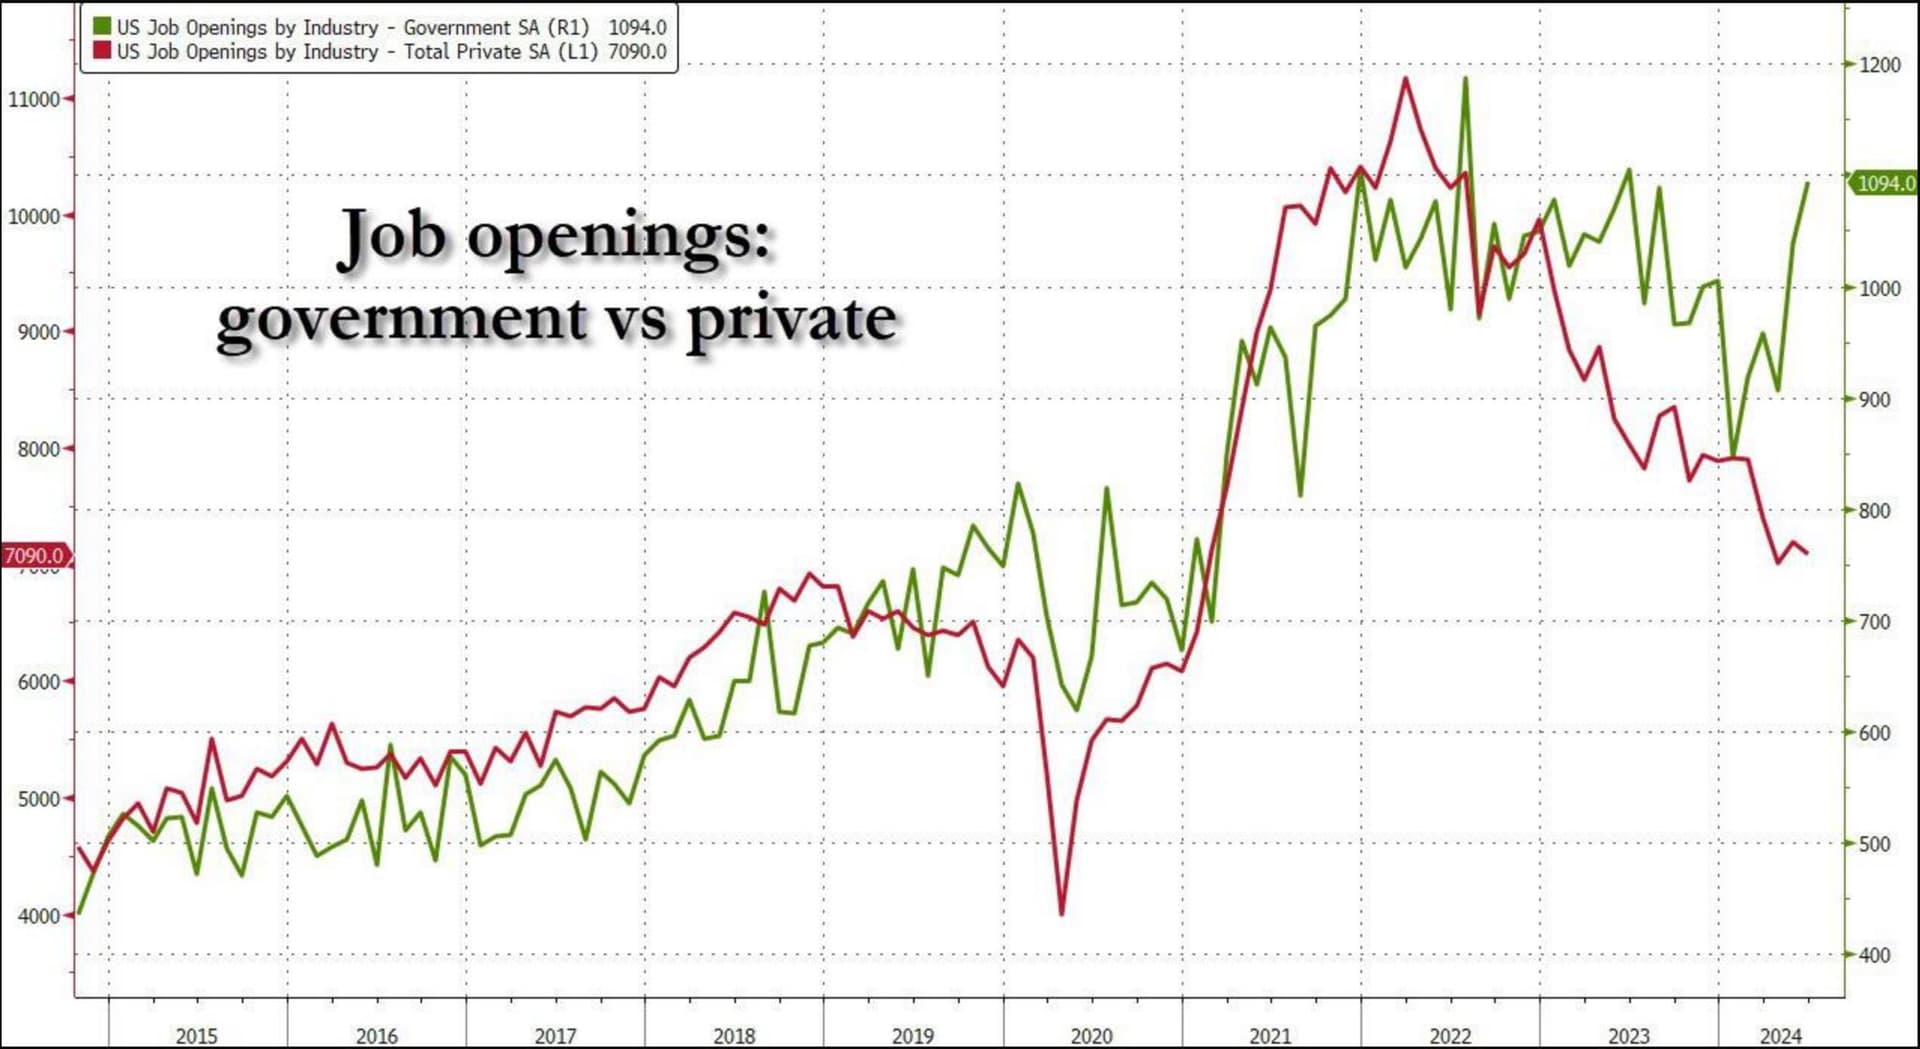
The majority of the openings during May came from government and manufacturing, however private industries on net only added 42k during May.
Sources:
News Release
Data
Tableau
The cooling of the labor market continues to be concentrated mostly on a significant slowdown in hires and quits (falling further below 2019 levels. Hires biggest decline since Feb 2023), without many layoffs yet.
A sustained decline in hiring, coupled with a growing labor force, will also result in a higher unemployment rate.
Job openings per unemployment fell further to 1.2 in June 2024.
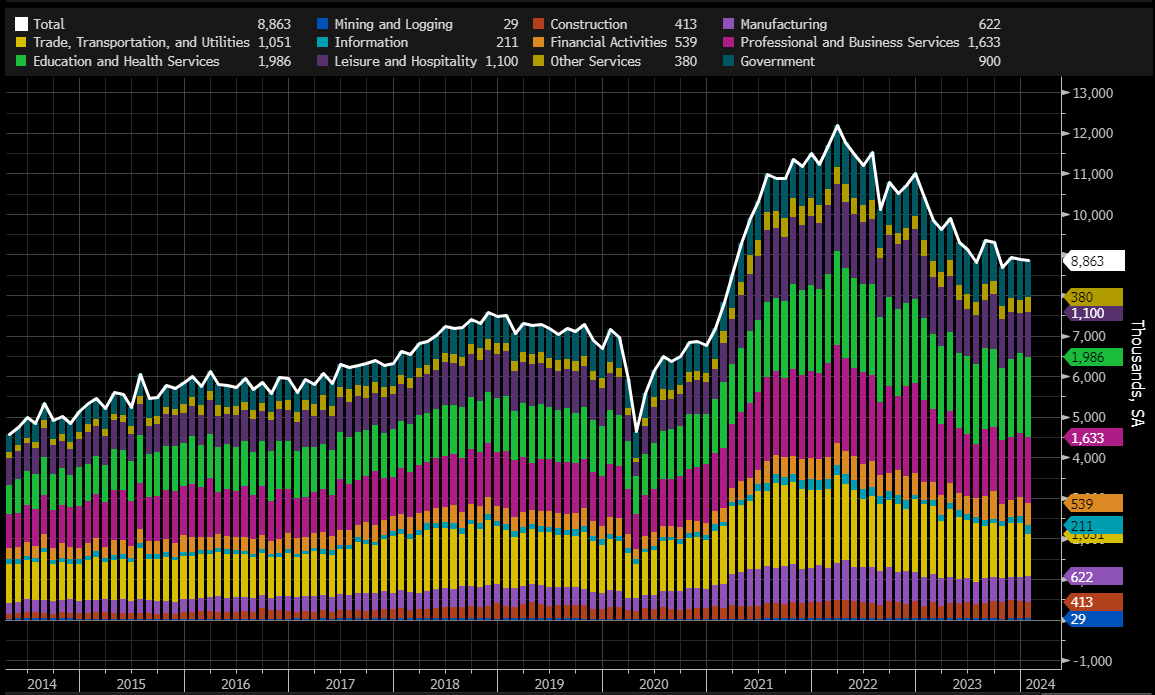
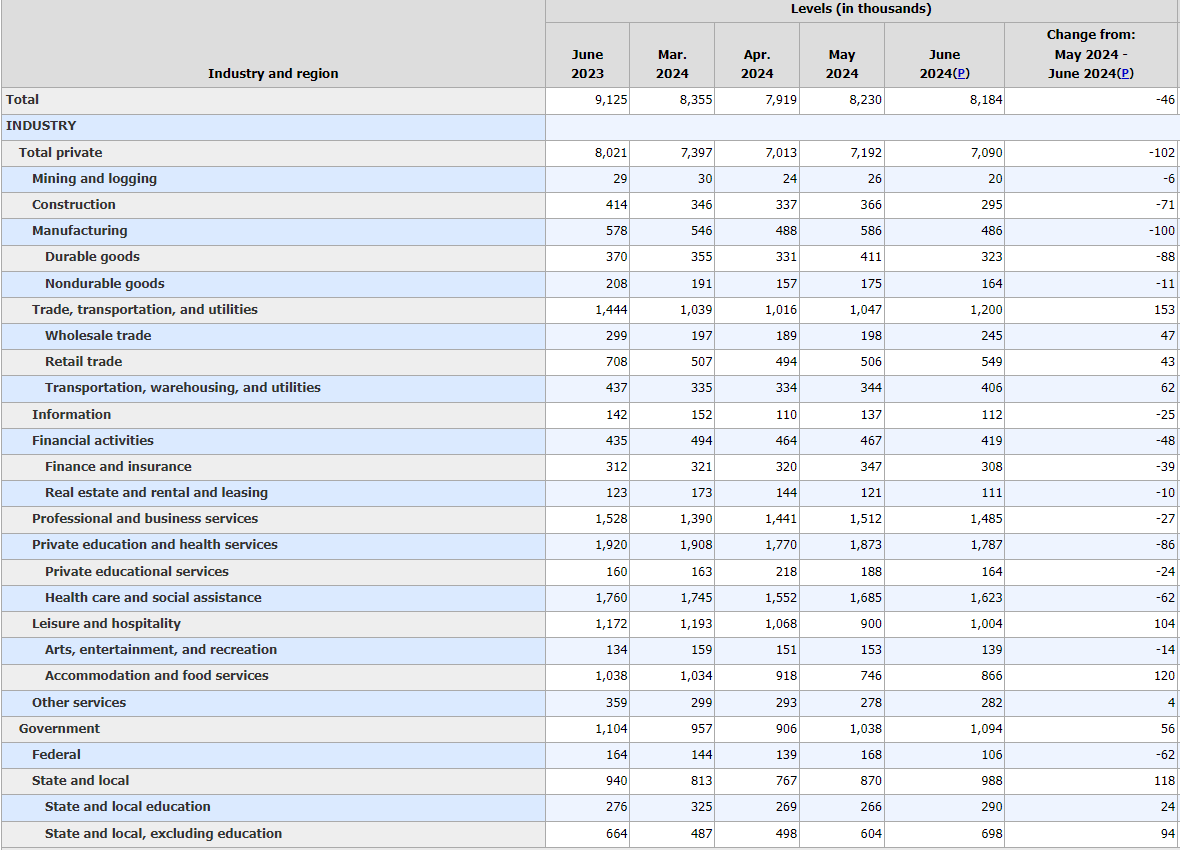
Openings by Industry
The labor market as of today is looking less tight or weaker than it was before the pandemic in 2019 (2019 was not a particularly strong economy either)
Markets are once again very unsure of 50bps or 25bps cuts in September.
My guess is that Friday’s jobs report will be key to determining this.
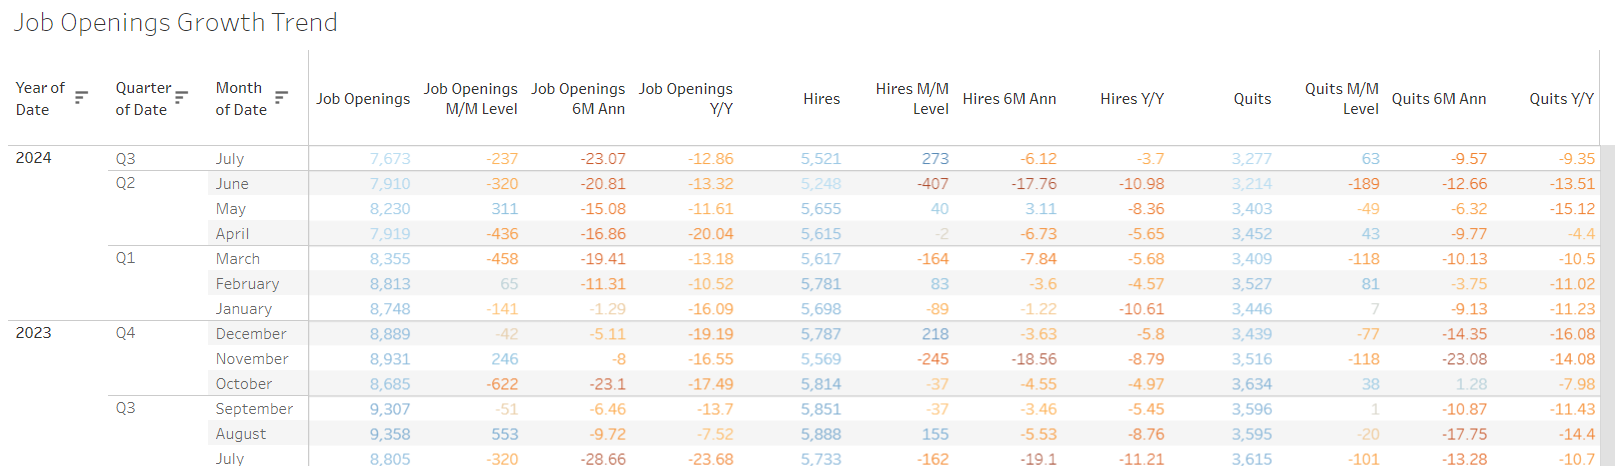
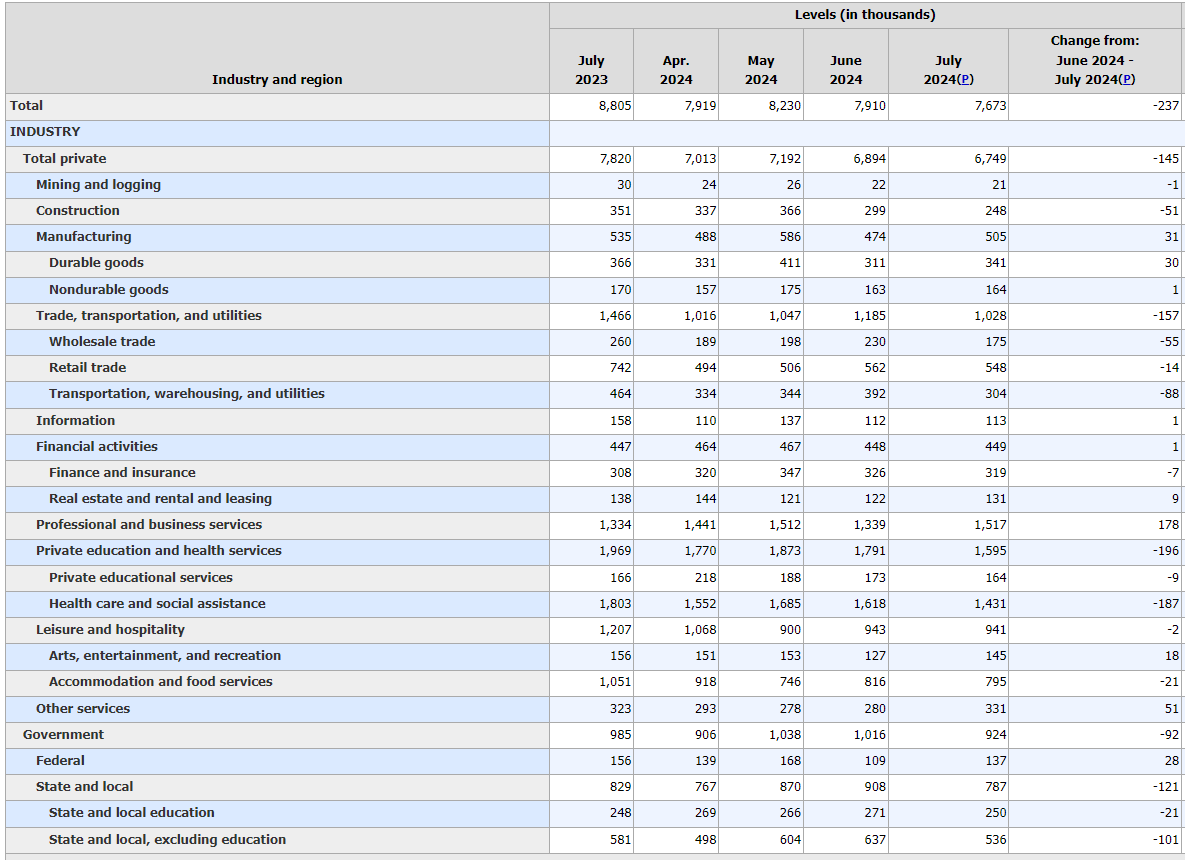
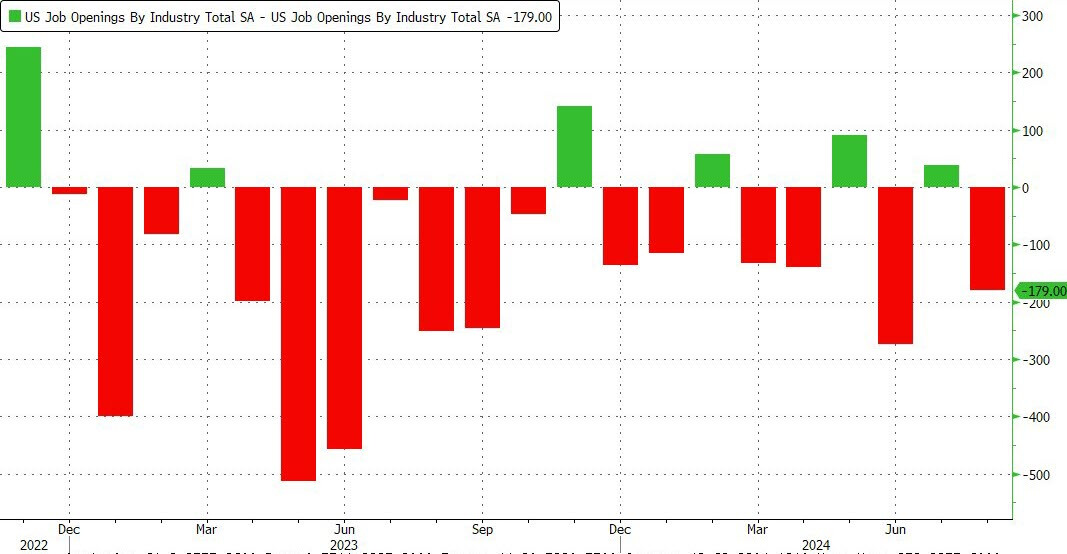
Job Openings declined by 230 to 7.673 Million in July 2024, missing expectations for 8.10 Million.
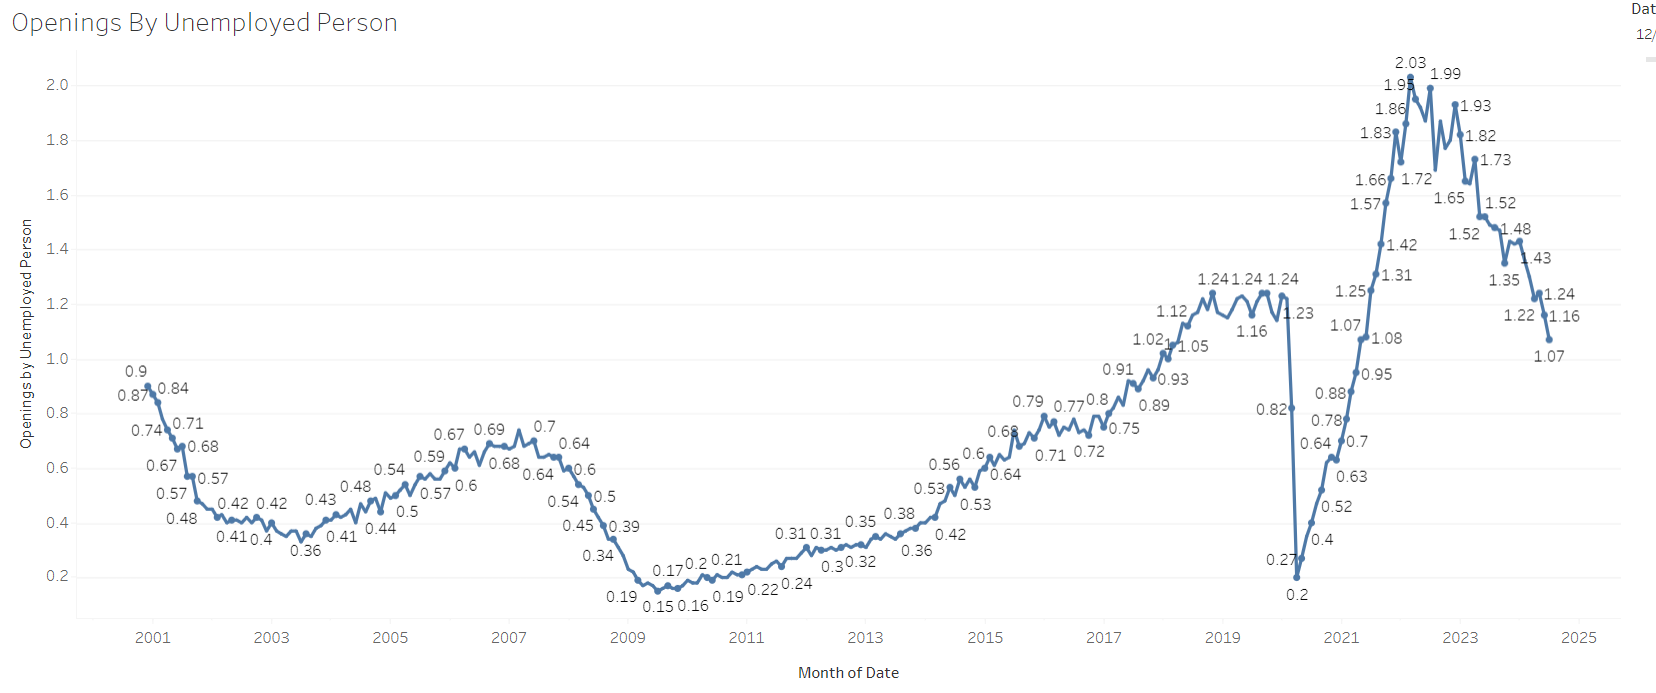
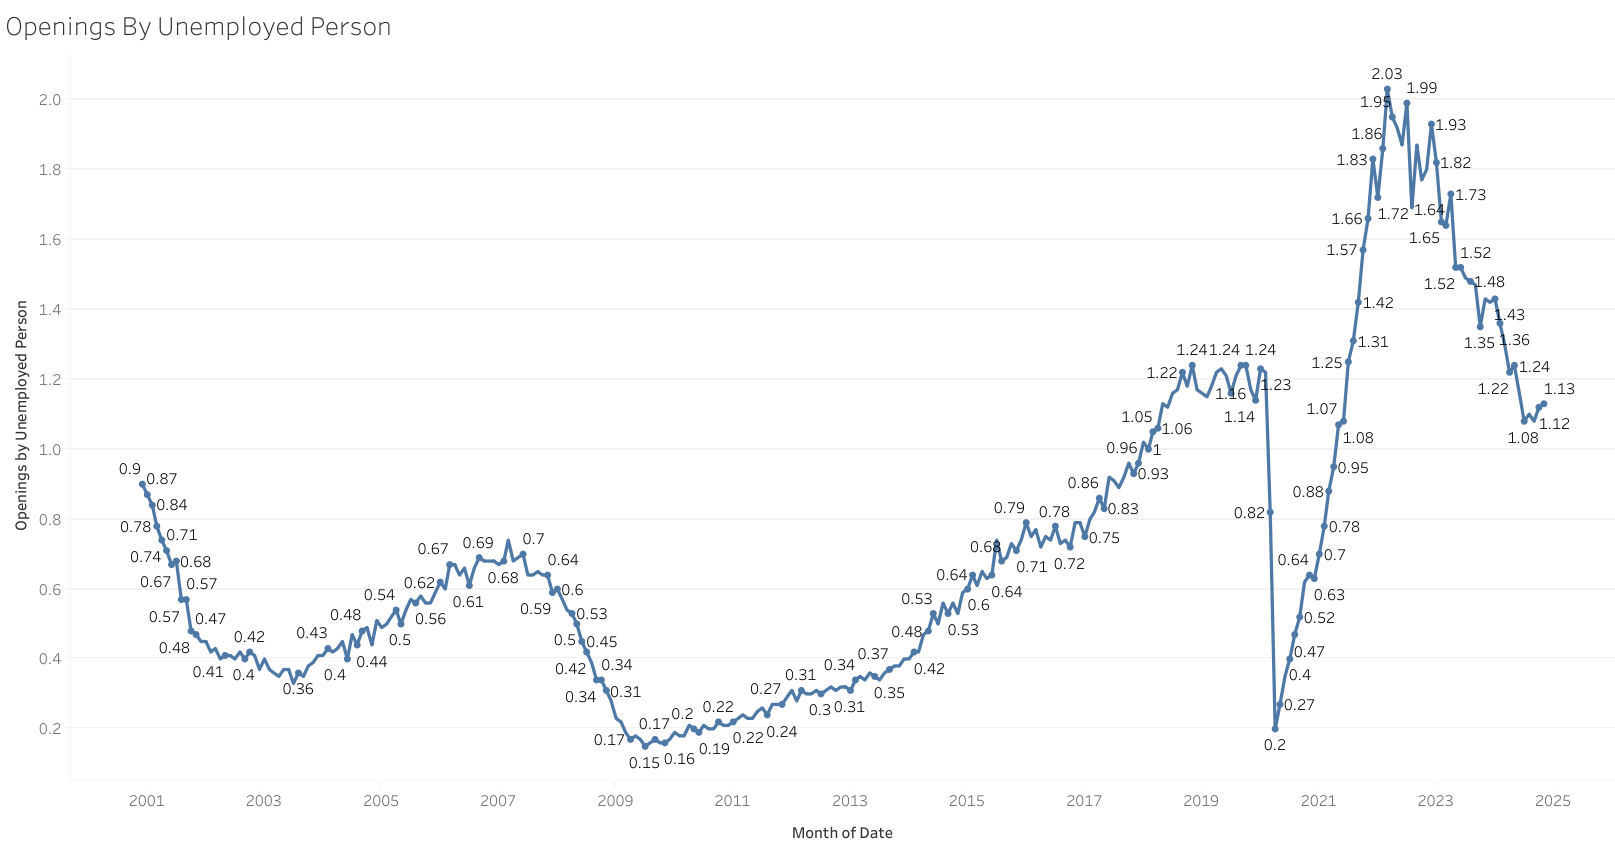
The job openings per unemployed person fell to 1.07, the lowest level since April 2018
The quits rate and hires rate remain below pre-pandemic levels.
Openings per category.
Particularly, construction job openings are looking pretty bad, which is not surprising due to the depressed levels of activity in the sector.
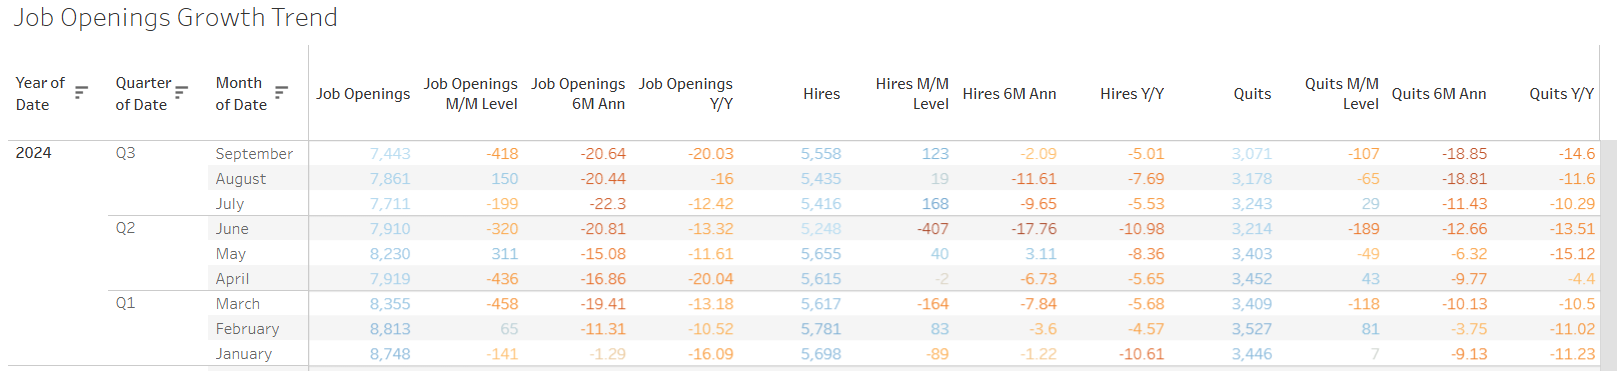
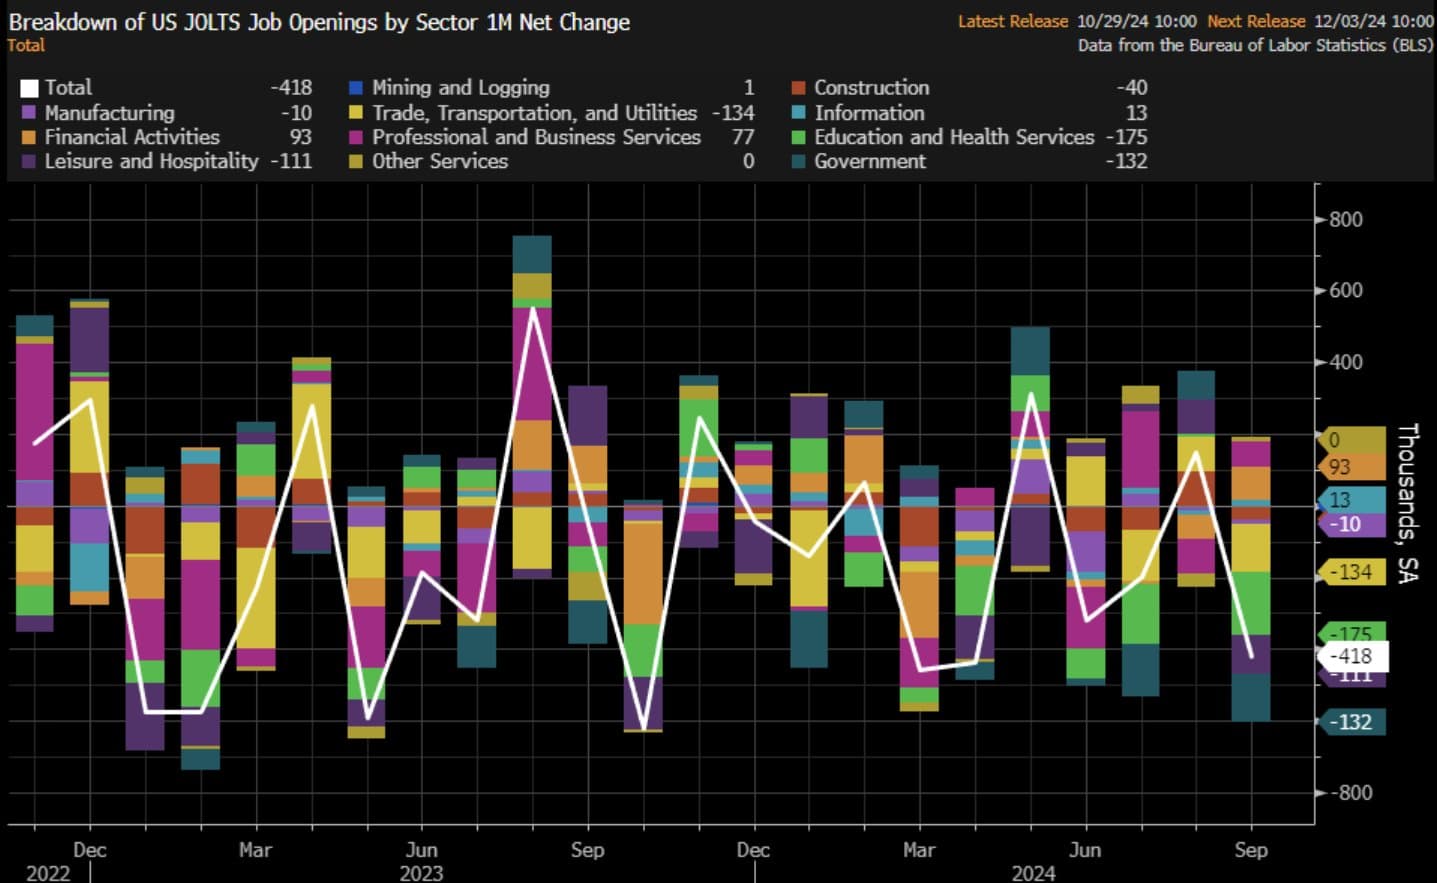
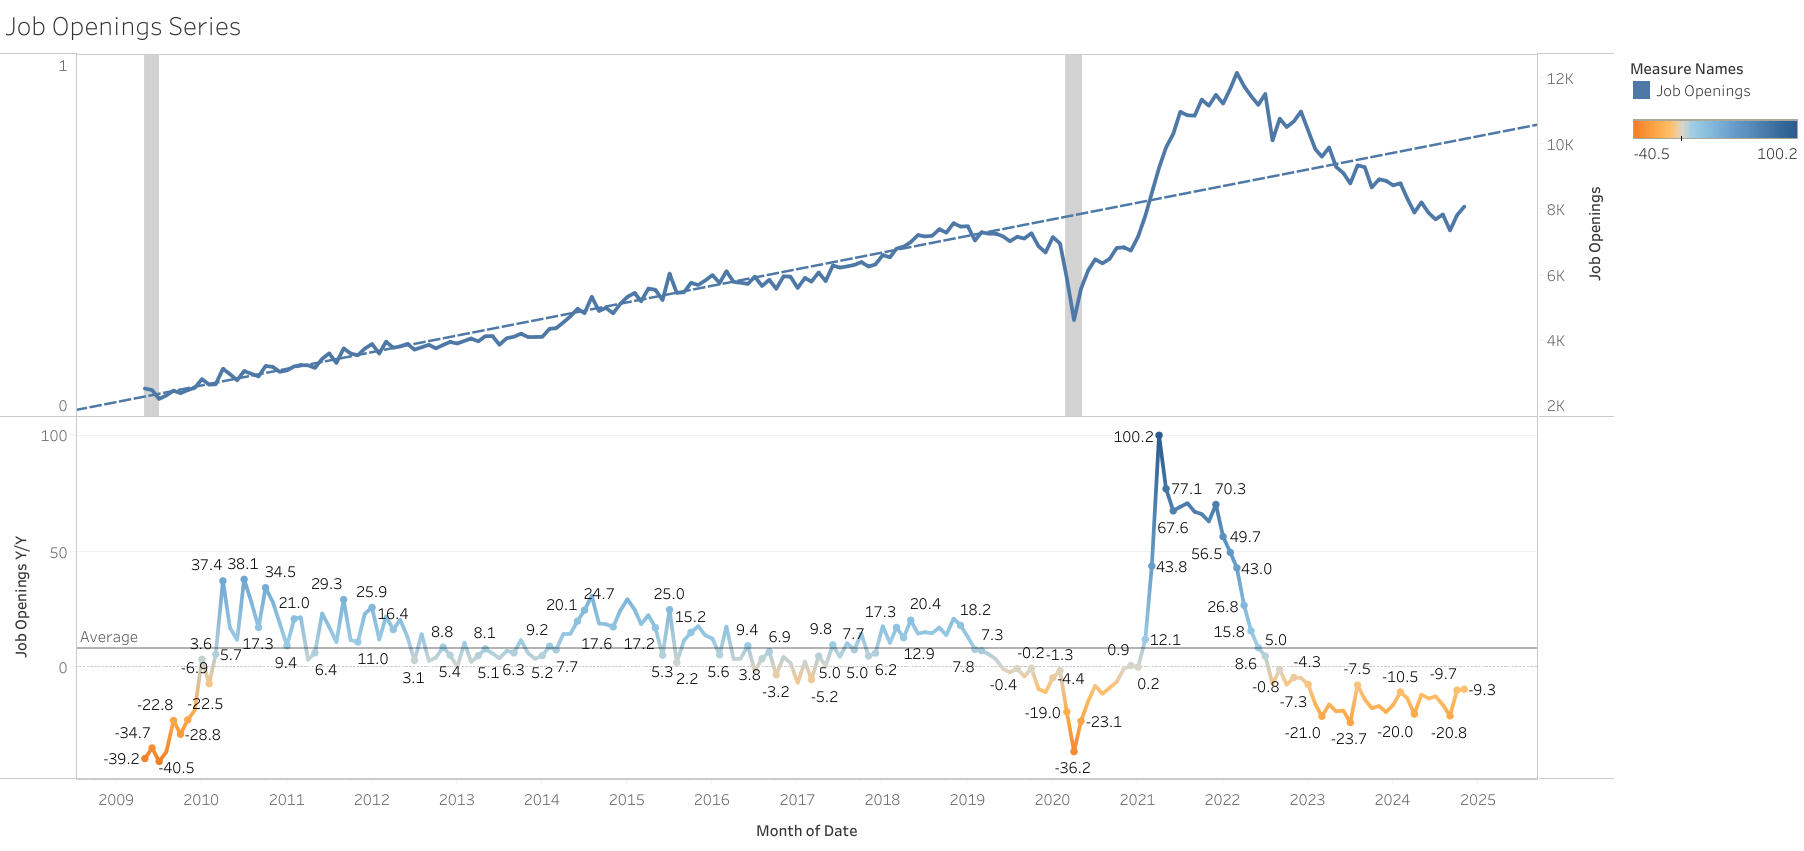
Job Openings decline 467k in Q3 (445K in Q2 2024), meaning a -5.90% Q/Q.
Openings per unemployed person are still at a 1.1 ratio, below prepandemic levels.
Hiring rate and quits rate also continue to be weaker than 2019 levels.
The decline continues to be broad base.
Unsurprisingly, job openings is another government data indicator with constant revisions.
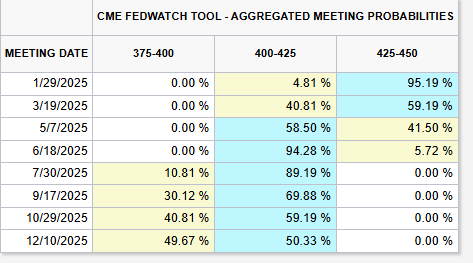
The recent increase in job openings over the past two months, coupled with the ISM Services PMI data, particularly the ‘prices paid’ component reaching its highest level since February 2023, has led markets to price in lower odds of the Federal Reserve cutting rates.
While I believe the market’s reaction may be somewhat exaggerated, this data aligns with the Fed’s latest projections and conference, which emphasized a lower downside risk to labor market, but increased inflationary pressures. Consequently, it supports a more cautious stance on rate cuts moving forward.
The data wasn’t all good either:
What exactly is hiring here? Do you have a definition somewhere of its methodology and what it is measuring?