Ed Yardeni

Ed Yardeni is the highly reputable and experienced founder of Yardeni Research.

He regularly shares his views about the economy and his company publishes insightful data with a focus on S&P 500 earnings.

I loosely followed Ed Yardeni for many years and never witnessed any incorrect assessment or prediction. (But my knowledge about him is still somewhat limited)

His overall stance is optimistic and bullish (which has been correct so far).

More Infos about him here.

Ed Yardeni’s current take on the economy.

Interestingly enough he continues to close watch the risks of a wage-price spiral and commercial real estate while having a positive outlook.

Sectors he likes are IT and financials (continued slow economic growth and decreasing inflation), Industrials (fiscal stimulus aimed at infrastructure spending and onshoring), and energy and materials (bet that the economy is not going into recession).

Has he ever been bearish?

Ed Yardeni April 22, 2008:

Edward Yardeni of Yardeni Research is one of many economists who expect a short, shallow recession during the first half of the year with a recovery starting by fall, and he projects that S&P 500 operating earnings will rise 7% for the year. Yardeni also notes that the price/earnings ratios of big value stocks are quite low and that growth stocks are the cheapest they’ve been in more than a decade.

https://money.cnn.com/2008/04/21/pf/mad_market.moneymag/index.htm

Fair point. Did he change his assessment closer to September when Lehman was collapsing?

It would have been very easy to just change the assessment close to the fact. But will look for it.

I also found Sep 21, 2001, the market continued its rapid decline after this date, bottom was Sept 2002.

Ed Yardeni Says It’s Up from Here
The veteran market sage’s key indicators tell him the market hit bottom on Sept. 21, and history says the next 12 months should see a surge

https://www.bloomberg.com/news/articles/2001-10-23/ed-yardeni-says-its-up-from-here

And he was awfully bullish at the end of 2021:

Some of Yardeni’s forecasts:

Forward earnings per share will be end up this year at $220 (up from $217 currently) and rise to $235 at the end of 2022 and $250 at the end of 2023
The S&P 500 is set to end 2021 at 4,800, 2022 at 5,200, and 2023 at 5,500
The forward P/E will remain high around its current level amid an earnings-driven rally
Ed Yardeni Says Earnings-Led Stock ‘Melt-Up’ Has Staying Power - Bloomberg

I guess a perma bull will always be correct until they are not, especially in the last decade.

In my opinion, it requires a lot of skill to be constantly correct and find the right call over a sustained period of time which Yardeni managed to achieve.

While the right call in the last decade has been constantly to be bullish that does not necessarily mean it was always easy to find that correct bullish call. (E.g. I was very unsure in 2020 after Corona started how equities would perform and partially failed to take advantage of very attractive March 2020 levels)
Any person who has been bearish over this decade missed out completely and any investors who turned partially bearish (like me) missed out in part.

Yardeni is certainly not one of the persons who are blindly bullish. (like e.g. many crypto youtubers)
His S&P predictions are very specific, data-based, and reasonable, and if look up his old comments on Linkedin you see him worrying about FOMC minutes released at the beginning of January 2022 that signal the start of QT. He also states in Jan 2022 that the FED can’t back off as inflation is at 7% and it needs to restore it’s credibility.
After the start of the Ukraine war, he discusses the inflationary effects of it (coming from deglobalization and higher oil prices), shares his prediction of stagflation and consequentially adjusts his S&P price target.

Both predictions came way before we reached the same conclusion and if you read his arguments you will find that they are sophisticated, knowledgable and take a variety of very important considerations into account. (Basically the same factors we are exploring as well)

On the question of how early one should be able to predict that problems are coming, I shared my view about difficulties here. You can see that the S&P only starts to break down one week after the collapse of Lehman as the majority of investors only realized the problem then. So I am not sure if it is feasible to predict it already in April 2008. (Imo we should be careful about the real estate topic as well right now. See: Real Estate - #2 by moritz)

While I do not understand the specifics of the situation in 2001 I think it is a bit difficult to judge someone based on an opinion from 20 years ago.
Additionally, it appears the market hit a local button in Sep 2001 and surged strongly in the next couple of months and has been up for an additional half a year after he made his prediction.
So we would not know if he changed his opinion at one point after Oct 2021 and not even if the decline in Sep 2002 was fundamentally justified.

I also recommend looking up Yardeni.com to form an opinion.
It offers a trove of data that we should leverage more often in our research going forward.

You did not need FED minutes/Ukraine war to realize inflation was going to be a problem, there were economist I was following already in mid 2021 talking about inflation not being transitory, the effects of huge fiscal stimulus, and hence the mistake the FED was doing.
I really don’t understand how someone can be so extremely bullish in November 2021, against this already obvious inflation problem. (Not sure if you really see something reasonable in this)

Some articles from an economist I know you respect:

Ed adjusted his targets when deveryone else was starting to do so too, because it started to be obvious, when the FED started hiking that month. Not sure, if one should call that being early.
And he started to call the bottom since July 2022, but I guess you will call this being right because of the rally that happened before the actual bottom.

Imo, we would also have been able to see the inflation problem early, but we were only starting working together. I had lost track of the economy for months when I started with you, and you were not than interested in macro.

About 2008, yes probably to have high confidence that we were going to have a financial crisis was really difficul to have. Though some were able to do it (Eg. Ray Dalio)
But was really in April 2008 a short/shallow recession and a recovery in the fall the most plausible outcome against the data that was already coming in?

From the data I have seen even since 2007, you could have already some scenarios that a very significant recession was going to occur, and most so in April, after Bear’s collapse.

And right now 2023, Ed is betting in a soft landing, and I have not heard from him any good argument to base this assumption tbh against numerous data that says otherwise.
IMO you don’t need to have certainty of a horrible economic crisis, but again is really a soft landing the most plausible outcome against the data?

I am not saying he is a bad analyst, he clearly gives very insightful data and commentary, but he also has a clear bullish bias, that have made his economic view wrong more than once in downturns, and should be recognized.

From my point of view, he is always bullish/optimistic, unless a shock happens that makes him change his initial assessment, and he is deemed as “correct” because for his fortune, the markets also have this behavior to react only with the bad already happened.
That’s ok if that’s the type of analyst you prefer to follow.
You will have more than enough time to react.

But as an economist, and trying to understand the most likely economic path with anticipation, definitely not my go to option.

Btw, I am being pushy about this because you said you never experienced any incorrect assessment or prediction from him, which I was highly exceptical.
Not because I have something against Ed, I barely know him tbh.

And even the economists I follow, I recognized they do make mistakes in timing or assessment sometimes, because as you said is very difficult to predict something as irrational as the markets/economy correctly, and also because the markets and the economy can follow a different path longer than expected too.

I don’t think one should be a bear or bull permanently, I think you should be realistic with the data in either direction.
Your opinion could materialized or not, but I least your arguments were well backed by the data available.

I think it is always very good to challenge any thought or idea you don’t agree with.

That should be core to our culture and will allow us to continuously improve.

In fact, challenging my statement made me also spend more time with some of Ed Yardeni’s assessments. I also edited my first msg to indicate that my knowledge of him is limited as I followed him loosely but have not been a close scholar of his work.

As an example, I currently do not know to which degree he regarded inflation as problematic before Jan 2022 (I only scrolled back on Linkedin until this date) but think we should look up something like that at a later stage after the current earnings season.

Ed’s bias is clearly bullish but stays in reasonable territory IMO. (No moonshot price targets. The current S&P year-end price target has been 4600 for quite a while)
Here are their latest newsletter publications. While i did not have time yet to look into all arguments in detail I think this article about economic worries and counter-arguments to them looks very interesting and sophisticated. I also like that they discuss earnings and assign probabilities to different scenarios.

Overall I believe it is good if we follow analysts with different biases (bearish, neutral, bullish) as long as they are sophisticated, offer new data support insights (and preferably provide their underlying data) and most of their arguments prove to be solid both after reflecting upon them and following how events play out.

The one prediction that makes me think he is not being realistic with the current circumstances from him is this one because this would mean an incredibly good economic recovery going forward, avoiding any contraction whatsoever in 2024 or 2025.
And I do think is most likely than not he will have to adjust these expectations.

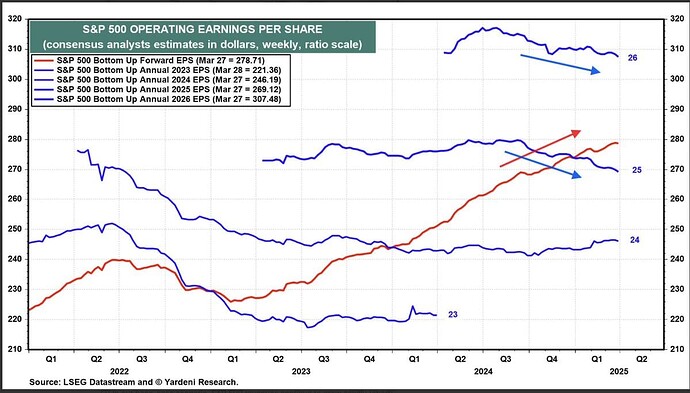
Yardeni expects S&P 500 earnings to hit $270 per share by 2025, and for the blue-chip index to trade between 17.8 and 20 times forward earnings by the end of 2024. For reference, the 10-year average forward price-to-earnings ratio for the S&P 500 is 16.9, and Wall Street’s consensus earnings estimate for 2025 is $275 per share—so these aren’t outlandish forecasts.

I also agree is good to follow different analysts because not all people specialized in the same topics. And to be honest I don’t get carried away too much anymore by anyone’s opinions (obv I also have a bias to trust more the people I know, but I try to avoid it), I just try to listen to their arguments as topics that could be interesting to look at, and that’s why I even listen to less known people because sometimes they have good ideas to research too

I like this format from ED to be honest, going through his charts, and explaining what he thinks makes me understand him better.

Some points from him currently:

  • The yield curve is des inverting due to higher yields in the long bonds. This according to him is the not so good desinvertion, because can cause additional stress in the banking system, credit markets, housing market, and CRE.
  • Yields are going higher not only because of uncertainty about the FED path, but also because the bond market is starting to be concerned about fiscal deficits, we are seeing exploding deficits in a non-recessionary environment, which for Ed is a valid reason for concern. Deficits in a recession are not concerning.
  • Supply and demand for bonds also don’t seem right balance, at the moment FED is doing QT, banks are reducing their securities portfolio, and foreigners are not buying as before.
  • The uncertainty these higher yields create is what is holding up the stock market. He thinks the market could have topped for now, and we will move to a sideways or correcting environment (10%) for some time.
  • The positive he sees is inflation coming down, which could be enough for the FED to cut rates at some point, and calm the bond market. For now, he thinks the market is not focused on this.
    https://www.youtube.com/watch?v=qpfJwzu0Hk8
1 Like

Some of Ed recent opinions:

  • The bond market is now for a long time caring about supply-demand of treasuries, and the recent surge in yield is mostly due to this
  • He is hoping yields stay 4-5%, because he doesn’t think the economy/markets can handle higher yields than these levels
  • For him the last years of low rates is abnormal, and 4-5% rates are just coming back to a normal environment, and that is why maybe the economy can handle it for longer
  • He now thinks the economy is going to slow down somewhat but not to the point of an economic-wide recession. He still sticks with only a rolling recession.
  • Despite the housing market freeze happening, construction employment is high due to all the government spending on infrastructure
  • Interest income that the consumers (the ones that have securities) are getting is at record highs. Government interest expense is stimulative in this aspect. This is supporting income still.
  • Household net worth is still really high, and half of it belongs to baby boomers, who are beginning to spend it and will continue to do so.
  • On the other hand, corporates are also getting a significant amount of interest income, while they refinanced at very low rates before. Their cash flow is near ath still.
  • He thinks 2024 earnings are realistic at $250 EPS, no reason given, probably his outlook that there is not going to be a broad recession, and inflation coming down.
1 Like

Reason to remain bullish in 2024 according to Ed Yardeni

SP500 Forecasts:
2024: 5,400
2025: 6,000

Economy Outlook: The economy remains resilient but inflation continues to fall closer to the Fed’s 2.0% target next year

Arguments:

  • Fed hasn’t been tightening monetary policy so much as normalizing it to the old normal
  • Consumers have purchasing power: unemployment is low now (i.e., below 4.0% since February 2022), and real average hourly earnings is rising once again along its 1.4% annualized trendline that started in 1993
  • Households are wealthy and liquid: The net worth of American households totaled a staggering record-high $151.0 trillion at the end of Q3-2023.
  • Demand for labor is strong
  • Onshoring boom is boosting capital spending
  • Housing is all set for recovery due to the recent decline in yields
  • Corporate cash flow is at a record high
  • Inflation is turning out to be transitory
  • The High-Tech Revolution is boosting productivity
  • Leading indicators are mostly misleading: There has been a rolling recession in the goods sector, but it has been more than offset by strength in services, nonresidential private and public construction, and high-tech capital spending.
  • The rest of the world’s challenges should remain contained
  • The Roaring 2020s will broaden the bull market: the bull market was narrowly based, but it since has been broadening to include more sectors and industries

https://www.linkedin.com/pulse/dozen-reasons-remain-bullish-2024-edward-yardeni-w5mwe%3FtrackingId=reBHOscYQvSS%252BgmGz7vsKg%253D%253D/?trackingId=reBHOscYQvSS%2BgmGz7vsKg%3D%3D

1 Like

These are Ed Yardeni Current opinions as of Q3 2024

Ed Yardeni still thinks the highest probability scenario is a 1920s-style Roaring 2020s due to productivity increases

He currently thinks the FED cutting more than what the economy needs is increasing the probability of a stock market melt-up because these cuts could overheat the economy.

He acknowledges that the current risk with this scenario is that valuations are not cheap anymore

In a melt-up scenario, the S&P 500 could soar to above 6000 by the end of this year. While that would be very bullish in the near term, it would increase the likelihood of a correction early next year.

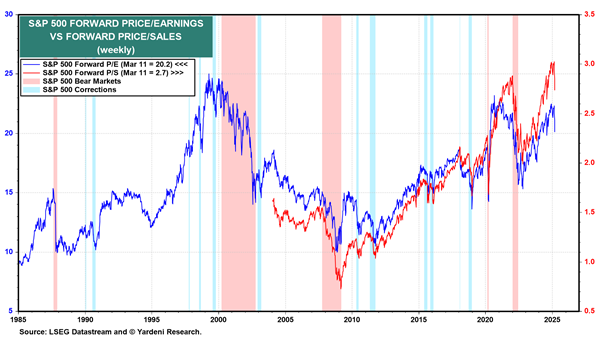
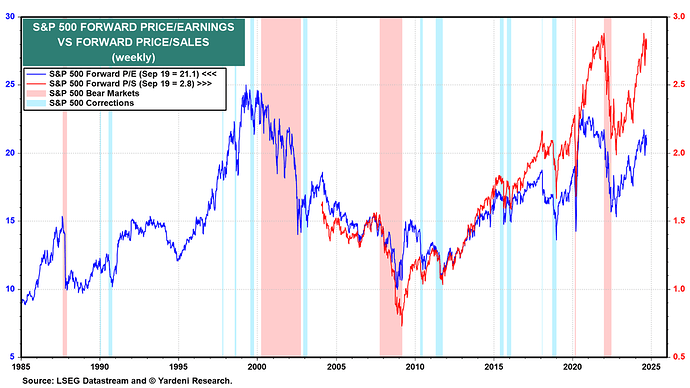
The problem is valuation. Warren Buffett has been raising cash probably because his Buffett Ratio (measured as the S&P 500’s price index to forward sales) is in record-high territory, at 2.83 during the September 19 week

S&P 500’s forward P/E (chart). It’s elevated at 21.1. But it isn’t in record territory, yet. Its divergence with the S&P 500 forward price-to-sales ratio is attributable to the index’s rising profit margin causing earnings to rise faster than sales.

His scenarios with probabilities:

  • 1920s-style Roaring 2020s: 50%
  • A reprise of the 1990s stock market melt-up: 30%
  • Reprise of 1970’s with geopolitical shocks causing oil prices and inflation to spike: 20%

His targets:

  • S&P 500 forward earnings projections for the ends of 2024, 2025, and 2026 remain at $275, $300, and $325.
  • S&P 500 targets of 5800, 6300, and 6800 for 2024, 2025, and 2026.

He also currently thinks the neutral rate of the economy is higher at ~4% or higher, and that’s why the economy has not significantly weaken on the face of rate hikes

As mentioned above he think if the Fed continues to lower the federal funds rate, monetary policy will most likely stimulate an economy that doesn’t need to be stimulated. The result could be rebounds in both price and asset inflation rates.

  • The economy has continued to grow in the face of monetary tightening. In other words, the resilient economy is demonstrating that if there is such a thing as the neutral federal funds rate, we are there.
  • Productivity growth seems to be making a comeback, as we’ve been expecting. It is up 2.7% y/y through Q2-2024, exceeding the average of 2.1% since the late 1940s
  • Better-than-expected productivity growth also boosts real economic growth at the same time that it’s keeping inflation contained
  • Large fiscal deficits have boosted economic growth and offset the recessionary impact of the tightening of monetary policy. Again, the conclusion must be that the neutral interest rate has been increased by the current administration’s fiscal policy.


Yardeni has increased his SP500 targets

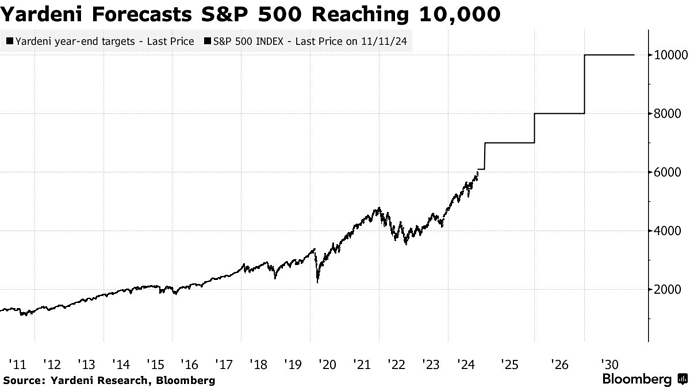
Yardeni lifted year-end targets to 6,100 for 2024, 7,000 for 2025 and 8,000 for 2026

According to him, the “animal spirits” being set loose by the economic policies of President-elect Donald Trump will send the S&P 500 to 10,000 by the end of the decade, which would represent a 66% surge by 2030.

“Stock investors are also thrilled by the regime change to a more pro-business administration promoting tax cuts and deregulation,” he wrote in a note on Monday.

Following the very weak Q1 2025 GPD forcast by the Atlanta Fed:

Yardeni Research released a super interesting analysis which appears to be very knowledgeable and well done to me on LinkledIn. (It feels to me this is the level we want to eventually reach which includes analysis of correlations & deep knowledge of what is important. For now instead of producing the research ourselves our job is to find great research like this).

In order to preserve it’s content I copy posted it here.

@Magaly do you see any obvious mistakes or false considerations in it?

Negative GDP Math Doesn’t Add Up


Edward Yardeni

Edward Yardeni

President of Yardeni Research

This is an excerpt from Yardeni Research Morning Briefing dated Monday, March 3, 2025.

The latest economic indicators aren’t supporting our resilient-economy thesis. Nevertheless, we are sticking with it for now. Consider the following:

(1) Atlanta Fed’s GDP Now & CESI. The Atlanta Fed’s GDPNow tracking model lowered the estimated growth rate of Q1’s real GDP from 2.5% (q/q, saar) to -1.5% on Friday and then further to -2.8% on Monday (Fig. 3). Friday’s downward revision was attributable to a huge increase in imports during January and to a significant drop in consumer spending during the month. Monday’s downward revision was attributable to weak construction data in January and to a drop in the new orders index of February’s M-PMI.

The Citigroup Economic Surprise Index (CESI) has turned negative over the past few days and was -16.5 on Friday (Fig. 4).

(2) Purchasing managers surveys. Monday’s M-PMI report for February was weaker than expected at 50.3, down from 50.9 in January (Fig. 5). Those were the first back-to-back readings above 50.0 since late 2022. However, the new orders index (48.6) and employment index (47.6) were both below 50.0 last month.

We’ve previously observed that the correlation between the M-PMI and the quarterly growth rate in real GDP of goods isn’t very high, especially of late (Fig. 6). While the former has been mostly below 50.0 since late 2022, the latter has been mostly positive.

The same can be said about the correlation between the NM-PMI and the quarterly growth rate of real GDP of services (Fig. 7). Neither the M-PMI nor the NM-PMI is particularly useful for assessing the current growth rates of goods and services in real GDP when the economy is expanding. They are more useful for that purpose when they fall significantly below 50.0, signaling a recession.

February’s NM-PMI will be released on Wednesday. Stock investors were spooked on February 21 when the S&P Global “flash” estimate showed a sharp drop to 49.7 from 52.9 in January (Fig. 8). We don’t expect a similar drop in Wednesday’s report from the Institute of Supply Management.

In any event, the Atlanta Fed and the financial markets may be giving both the M-PMI and NM-PMI more weight than they deserve. Nevertheless, we will continue to track the regional business surveys conducted by five of the 12 Federal Reserve district banks for insights into the national M-PMI (Fig. 9). The former misleadingly indicated a stronger national M-PMI in February.

We will also be monitoring the prices-paid and prices-received indexes in the regional and national business surveys. February’s M-PMI prices-paid index jumped to 62.4, the highest reading since June 2022 (Fig. 10). The bond yield fell as investors focused more on the “stag” than the “flation” in the stagflation scenario that’s been gaining credibility.

(3) Construction. Following the release of Monday’s construction report for January, the GDPNow model slashed the residential construction component of Q1 real GDP from 1.4% to -4.9% y/y and lowered the nonresidential structures component from -2.0 to -2.5% y/y (Fig. 11). January’s actual m/m changes in these two categories were -0.4% and 0.1%.

(4) Imports. Following the release of the advance report for January’s merchandise trade data, imports growth in Q1’s real GDP was boosted from 5.4% to 29.7% y/y (Fig. 12). That remarkable jump was attributable to importers front-running Trump 2.0 tariffs.

Real GDP is basically a measure of domestic production that is calculated by adding up the sources of domestic demand and adding exports (which are not included in domestic demand, but boost domestic production), while subtracting imports (which need to be subtracted from domestic demand to calculate domestic output). So soaring imports depressed GDPNow’s real GDP growth estimate for this quarter significantly. Some of that surge was attributable to imports of gold.

Imports are likely to have fallen in February and to fall again in March, which would boost Q1’s real GDP in the GDPNow tracking model.

(5) Personal income, consumption & saving. Personal income jumped 0.9% m/m during January (Fig. 13). Total wages and salaries rose only 0.4% m/m. Total personal income was boosted by a 1.8% increase in government social benefits and a 1.2% increase in nonlabor income (from dividends, interest, rents, and proprietorships).

Despite the jump in income, personal consumption fell 0.2% m/m, resulting in a 32% increase in personal saving. The personal saving rate jumped from 3.5% during December to 4.6% during January (Fig. 14). We attribute the weakness in January’s consumption to inclement weather. It was the coldest January since 1988. In addition, December’s m/m rate in consumer spending was revised up from 0.7% to 0.8%.

In the GDPNow tracking model, Q1 real consumption growth was lowered from 2.2% to 1.3% y/y after the release of the personal income report on Friday. It was lowered again to 0.0% on Monday. We aren’t sure why, so we submitted an inquiry.

In any event, we are reasonably sure that consumer spending will rebound in February and March.

(6) Q1’s GDP. Our bottom line is that we expect to see real GDP increase during Q1 between 1.5% and 2.5%. We are betting on the economy’s resilience. We are keeping the stagflation scenario in our what-could-go-wrong bucket with a 20% subjective probability.

1 Like

ED Yardeni becoming a bit more cautions as of late due to all the Trump Uncertainty


https://x.com/SethCL/status/1899058517421535327/photo/1

1 Like

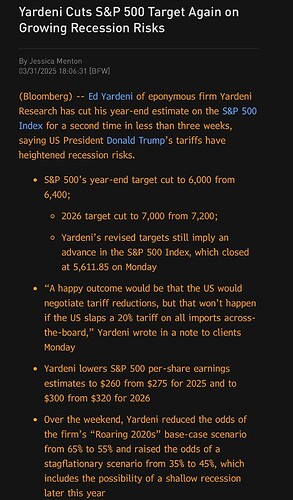
Yardeni Lowered Market 2025 and 2026 Targets

We lower “our S&P 500 targets for the end of 2025 and 2026 to 6400 and 7200 from 7000 and 8000. We aren’t cutting our earnings outlook yet, but recession fears caused by Trump Turmoil 2.0 are already causing the forward P/E and forward P/S of the S&P 500 to tumble, led by the valuation multiples of the Magnificent-7 (chart).”


https://x.com/neilksethi/status/1900142796897738845/photo/1

1 Like

Yardeni Comments about the rotations out of US stock recently

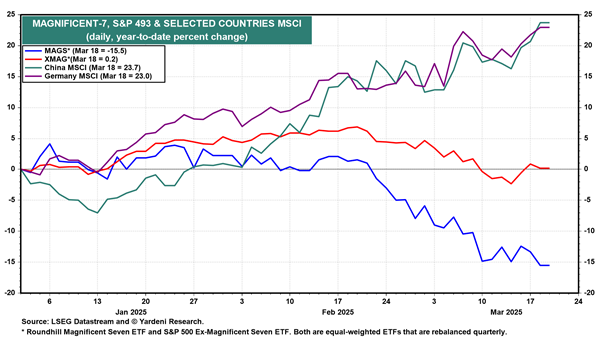
“Trump has declared that April 2 is ‘Liberation Day for America.’ Stock investors aren’t buying it…The rotation out of US and into foreign stocks suggests that global investors have been mostly selling the Magnificent-7. Rather than buying the S&P 493 (as we’d expected), they’ve been buying foreign stocks with lower valuation multiples, especially Chinese technology and German industrial stocks (chart). In addition, thanks to Trump Tariff Turmoil 2.0, recession fears are more widespread in the US than in China and Germany, because the latter two are stimulating their economies.”


https://x.com/neilksethi/status/1902310329645957562/photo/1

1 Like

Yardeni is also not entirely convinced the bottom is in yet, despite the very bearish sentiment already

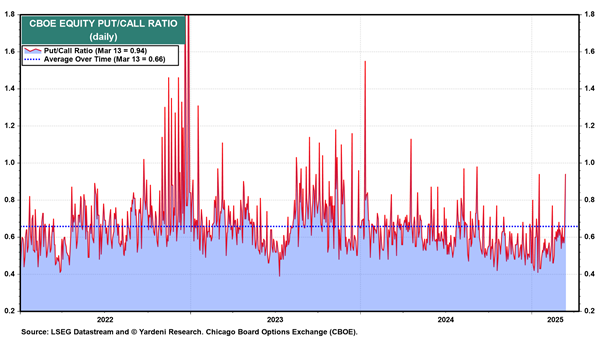
We will be more inclined to call a bottom when we see the stock market move higher on a day or days when Trump blusters about tariffs again…We thought that the stock market would be choppy at the beginning of the year before heading back to record high territory later this year. It’s been choppier to the downside than we expected. For now, sentiment indicators are very bearish, which is bullish from a contrarian perspective.

  • CBOE Put/Call Ratio rose sharply to 0.94 Thursday, above its 0.66 average.
  • Investors Intelligence Bull/Bear Ratio fell to 0.80, historically bullish below 1.00, but can remain low before markets bottom.
  • They suspect that the stock market hasn’t fully discounted what’s coming on April 2, when the US will tag America’s trading partners with effective tariff rates matching partners’ average tariffs plus implicit nontariff barriers.


https://x.com/neilksethi/status/1901242047857938451

1 Like