I just saw this interesting point which I haven’t thought about before in this way, or connected this way.
The FED is supposedly doing QT to reduce bank reserves, and hence create additional tightening this way reducing liquidity in the system.

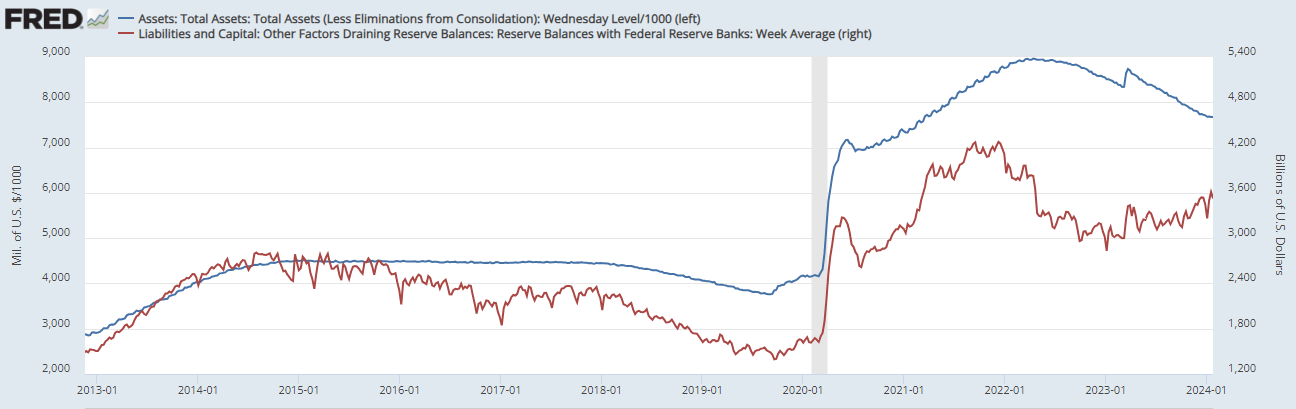
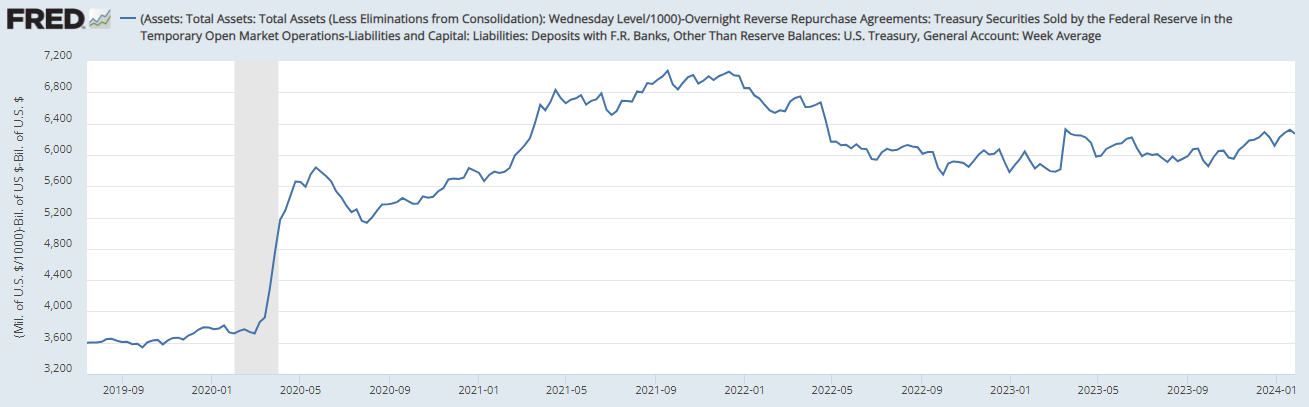
However, this time it has not completely worked this way, especially since March 2023, the transmission has been neutral. The FED has reduced its balance sheet by ~1.3T since the FED started QT , but bank reserves are only down by ~450B. The relationship is better explained if divided by 2 periods:
-
From March 2022 to March 2023 FED Balance sheet declined by ~625B, reserves by ~1T (the expected relationship), and reverse repo was unchanged. In March 2023 we had the regional banking crisis due to liquidity issues, and throughout 2022/1H 2023 was when the economy was looking weaker in some areas.
-
From March 2023 to January 2024, the FED balance sheet has declined by ~665, but reserves have actually increased by ~550B. This Could be the reason liquidity has remained relatively positive after 2H2023, not creating huge issues in the economy or financial market, with the economy actually improving in some aspects and risk assets ripping higher.
This is happening because the treasury has decided to increase its T-Bills insurance instead of long bonds after the debt ceiling was resolved, so mostly MMF has used the money in the reverse repo facility to absorb the additional government supply after April 2023.
The drain of the reverse repo is thought to be positive for liquidity.
The amount of Treasury bills outstanding has swelled to $5.676 trillion as of the end of December, a $1.7 trillion increase since the government suspended the debt ceiling in mid-2023. That’s about 21.5% of total debt outstanding and above the 15% to 20% threshold recommended by the investors, dealers and other market participants who make up the Treasury Borrowing Advisory Committee.
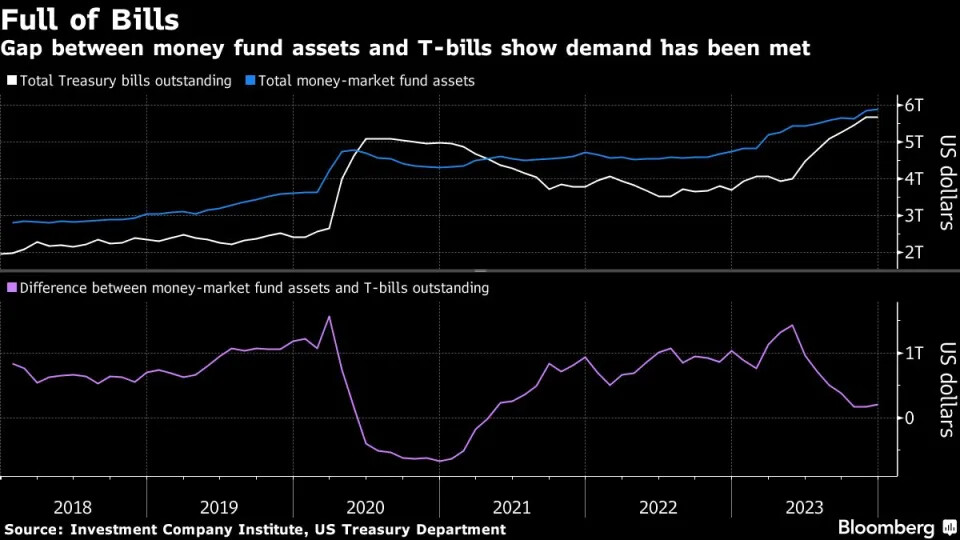
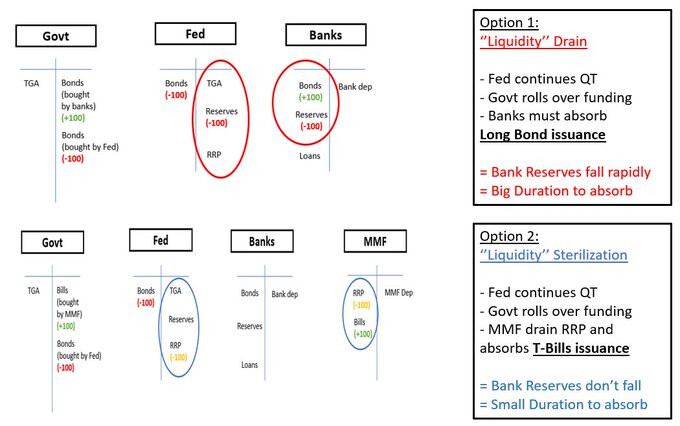
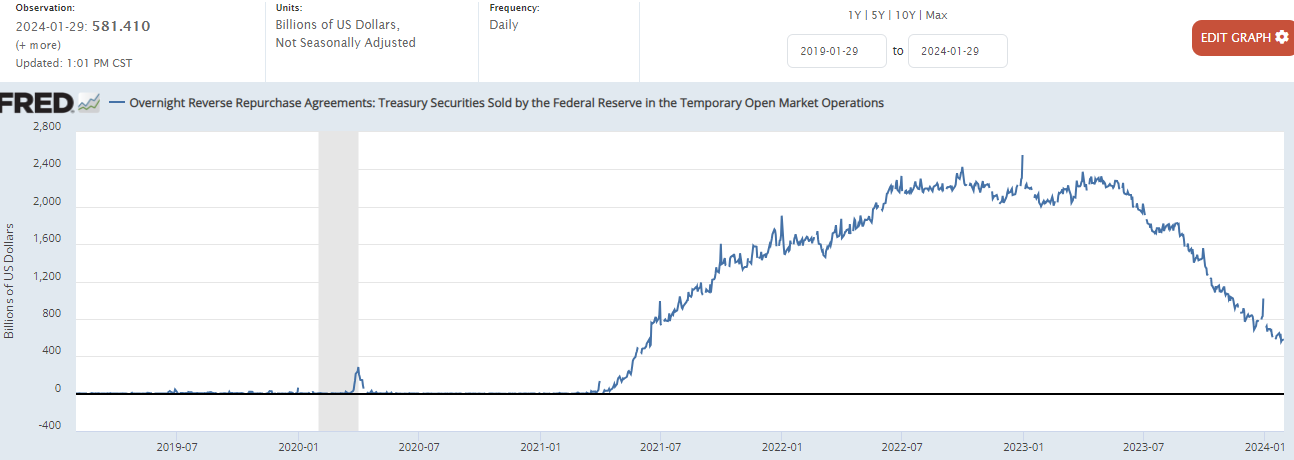
The reverse repo facility is currently down to below 600B from ~2.3T in April 2023. The question now is what will happen with liquidy when completely drained sometime in the 1H2024, especially with the increasing fiscal deficit and hence treasury issuance. Because banks will be forced to absorb an additional supply of treasury bonds, and hence their reserves could start to decline again.
FED Net Liquidity ( Fed balance sheet -TGA - Reverse Repo) has increased since March 2023, by ~450B, or 8.3%. But is not expected to remain this way after the run-off of the reverse repo.
I have seen lately a lot of analysts say the FED will taper QT when this happens because they will not allow the repo market or the treasury market to have an accident. But the FED has not given officially any confirmation this is what will indeed happen, next FED meetings are probably very important.
Is also important to note that the levels of reserves and liquidity that caused problems in March 2023 were still way higher than 2019 levels, so I don’t think we will ever see those levels again.
Christopher Waller (FED governor), recently said balance sheet run-off could start to slow when bank reserves get to 10-12% of GDP, this would mean ~2,75 -3.4T reserves, currently at 3.52 T. So not much run away really.
In March 2023, when liquidity issues started in some banks, their reserves were at ~3T, and got as low as 2.83T in January 2023.
“We’ll start slowing as we approach maybe reserves being 10% to 11% of GDP,” Waller said at a Council of Foreign Relations event in New York. “And then we’ll kind of feel our way around to see where we should stop.”
https://www.reuters.com/markets/us/fed-can-likely-slow-runoff-bank-reserves-near-10-11-gdp-2023-01-20/
2019 Repo Crisis
Another example of QT and low reserves creating a financial accident was in 2019. From October 2017 to September 2019, both balance sheet and reserves were down ~1T. In September 2019, the repo crisis happened, resulting in the FED ending tightening cycle completely, doing QE again, and hence reserves increasing again.
Strains in money market in September occurred against a backdrop of a declining level of reserves due to the Fed’s balance sheet normalization and heavy issuance of Treasury securities.
Aggregate reserves reached a multi-year low of less than $1.4 trillion in mid-September due to tax outflows and net issuance of Treasury securities, which drained more than $100 billion of reserves from the system over two days. While it is not uncommon for reserves to fall as much as $100 billion over a day or two, such a drop had not occurred at such a low level of aggregate reserves previously.
I will be creating a separate article to explain this whole event