This topic discusses the state of real estate.
Current assessment: To be written.
This topic discusses the state of real estate.
Current assessment: To be written.
After discussing how easy it would be to recognize problems in the real estate market many months before they are appearing, I started wondering if we are complacent when it comes to it.
Similarly to 2008, we are seeing record real estate prices, rising interest rates, problems in commercial real estate and first banks collapsing. (although due to another cause)
Surprisingly house prices held up so far esp. in the U.S.
Do we currently know which percentage of people have mortgages on their houses, the total size of those mortgages, how those mortgages compare to the values of homes, and when those mortgages have to be refinanced?
I continue to see a large risk that people might get into trouble with refinancing and will be forced to sell which could trigger a price spiral and ultimately get banks who gave out those mortgages into trouble. (In the united states mortgages are only secured by the value of the home, not by people and ultimately their total income/wealth)
@Magaly do you have a take on that topic?
My current take on housing is that we are not witnessing the same weakness that we saw in 2008, especially in the credit quality of borrowers. From my understanding delinquencies/defaults are still not rising compared to the increase we started to see even before 2008, at least for now, this could change at some point. Delinquency Rate on Single-Family Residential Mortgages, Booked in Domestic Offices, All Commercial Banks (DRSFRMACBS) | FRED | St. Louis Fed
However worth mentioning that foreclosures are increasing significantly, but still not at alarming rates or levels.
Foreclosure Activity In First Half Of 2023 Ticks Upwards | ATTOM.
Foreclosures Are Rising: Here’s What Experts Say It Means for the Housing Market
Also, banks have not participated in the same practices as before, supposedly. We don’t know about non- bank lending.
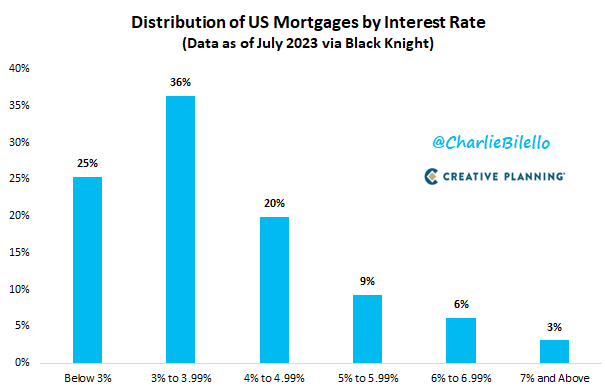
Also, apparently, most borrowers refinanced their mortgages when rates were extremely low, which could mean 2 things:
However I see seen some significant risks mentioned, but I have not researched them myself either:
All of these together could mean a significant increase in supply that could create a shock. Seems the amount of supply needed to come in to be able to cause a price shock, while demand is decreasing, is low compared to the whole stock of homes.
Currently, I think that even if there is a crash in housing prices, I think a correction will most likely happen, it will be pretty dramatic for the economy (more tightening credit standards), but not close to the extent we saw in 2008, especially because banks supposedly reduced their risk. But I could be wrong on this because this is a topic, I have done very little research myself, and not sure how significant those risks actually are, or even if there are more that I don’t even know about.
Interesting to see that delinquencies and foreclosures are still doing fine.
I just scanned through some of our old research from one year ago and the following things stand out to me
To me one of the most important open questions remains when maturities come due and what will happen then. (It could happen at the same time as the economy is weakening and people have less income.)
If vacancies in Airbnbs are high that might conflict with data that we have on the broader leisure industry and might be a relevant data point for the Sixt investment.
Just to add updates to that data I quickly found:
Maturity data is not something I have found for now.
A post was merged into an existing topic: German Real Estate Market
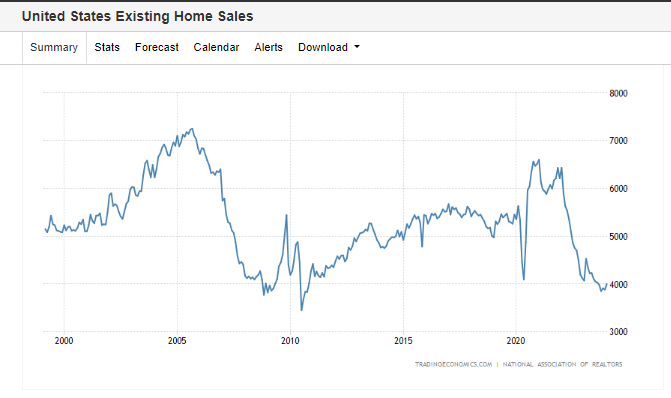
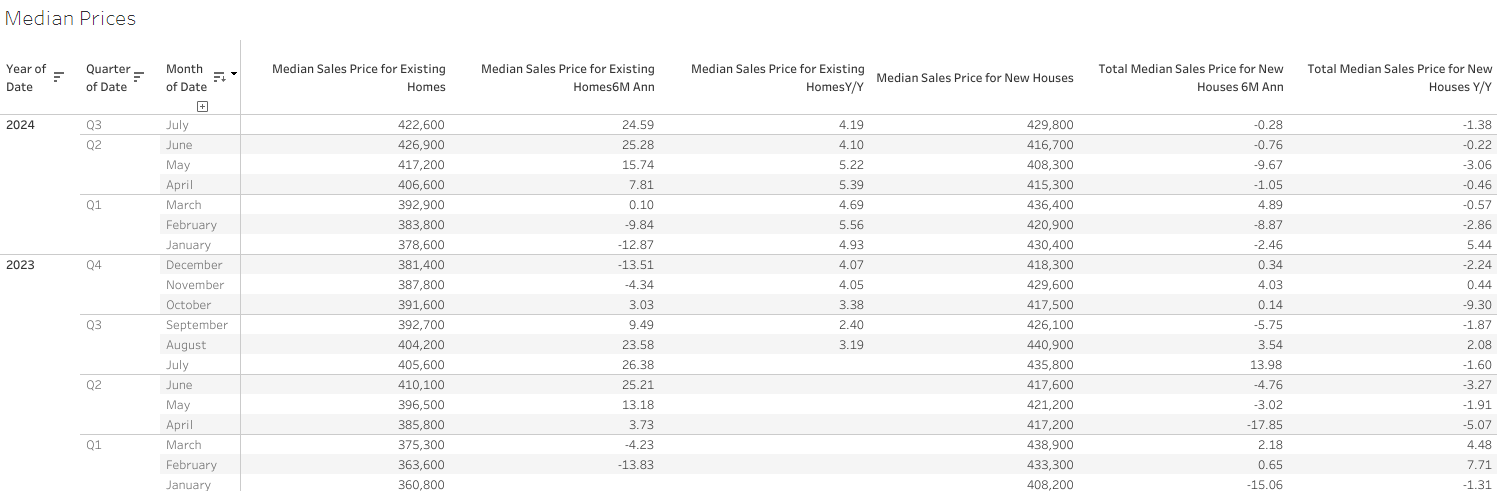
The existing home market continues to be very frozen, and the bit of rebound that happened has been now almost completely erased. Due to this existing home sale prices continue to increase.
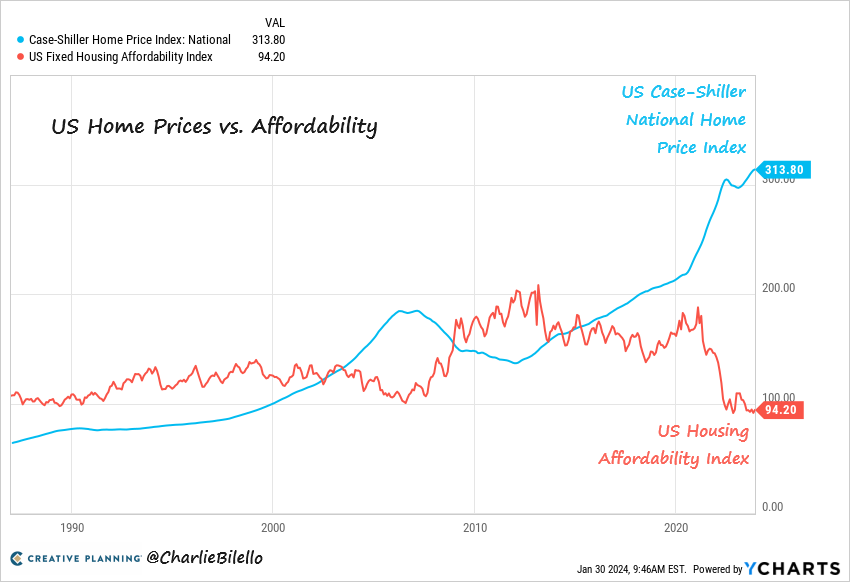
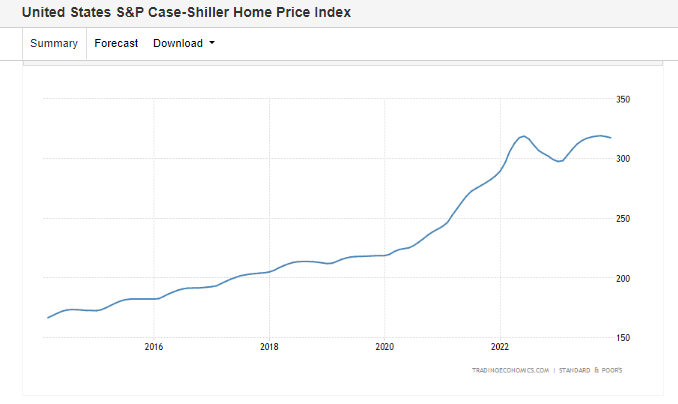
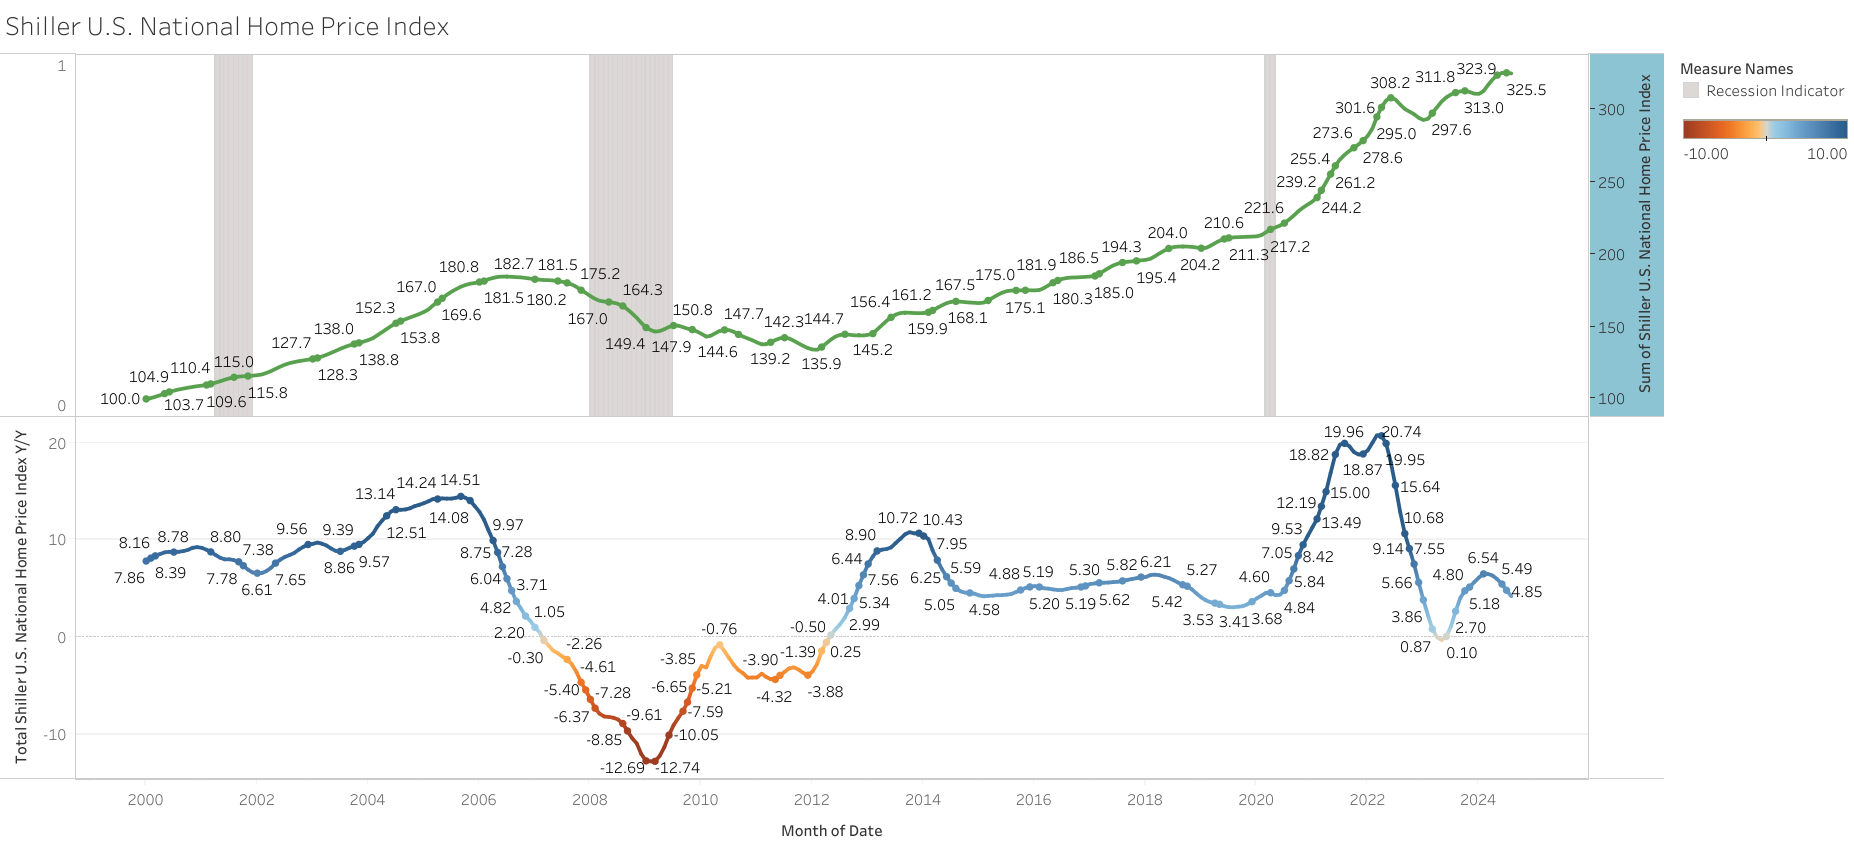
Housing prices continue to increase, back to peak levels. One of the not-so-good developments mentioned by Powell.
“June is the fifth consecutive month in which home prices have increased across the U.S. With 2023 half over, the National Composite has risen 4.7%, which is slightly above the median full calendar year increase in more than 35 years of data. We recognize that the market’s gains could be truncated by increases in mortgage rates or by general economic weakness, but the breadth and strength of this month’s report are consistent with an optimistic view of future results.”
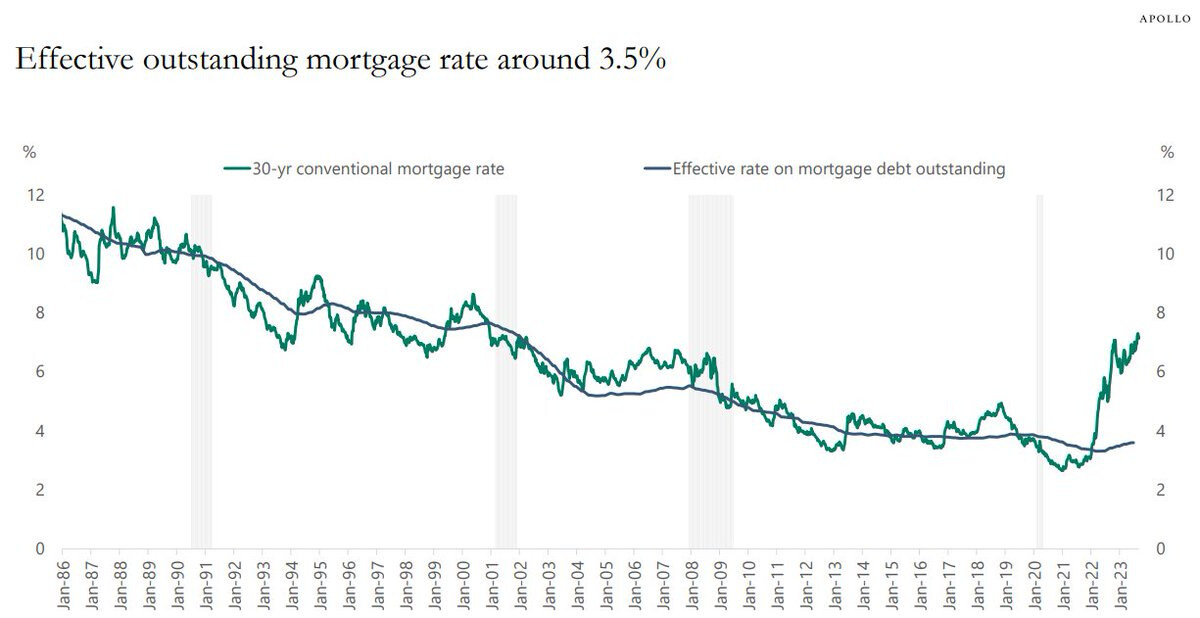
1 of the reasons supply of existing homes collapsed is that most homeowners have a low-rate mortgage. Dont think this will change as long as rates remain low.
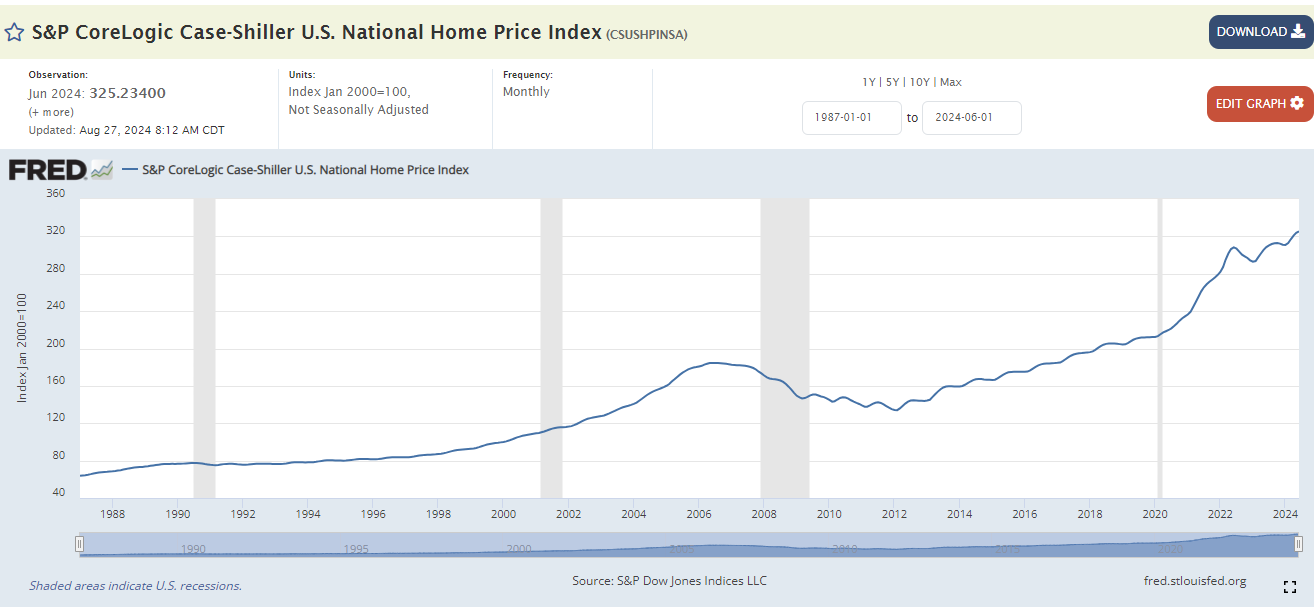
Housing prices continue to climb, incredibly they reached a new peak in July 2023. Very low supply and sales of existing homes are creating this.
"We have previously noted that home prices peaked in June 2022 and fell through January of 2023, declining by 5.0% in those seven months. The increase in prices that began in January has now erased the earlier decline, so that July represents a new all-time high for the National Composite. Moreover, this recovery in home prices is broadly based. As was the case last month, 10 of the 20 cities in our sample have reached all-time high levels. In July, prices rose in all 20 cities after seasonal adjustment (and in 19 of them before adjustment).
“On a year-to-date basis, the National Composite has risen 5.3%, which is well above the median full calendar year increase in more than 35 years of data. Although the market’s gains could be truncated by increases in mortgage rates or by general economic weakness, the breadth and strength of this month’s report are consistent with an optimistic view of future results.”
S&P CoreLogic Case-Shiller U.S. National Home Price Index (CSUSHPINSA) | FRED | St. Louis Fed
S&P CoreLogic Case-Shiller Index Continues to Trend Upward in July - Index Announcements | S&P Dow Jones Indices
This is so unsustainable. I don’t see median income really increasing, so due to it, I think a big correction in housing prices is probably needed if rates stay high.
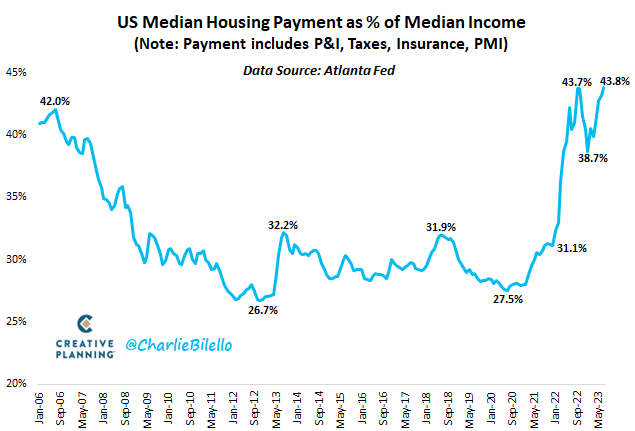
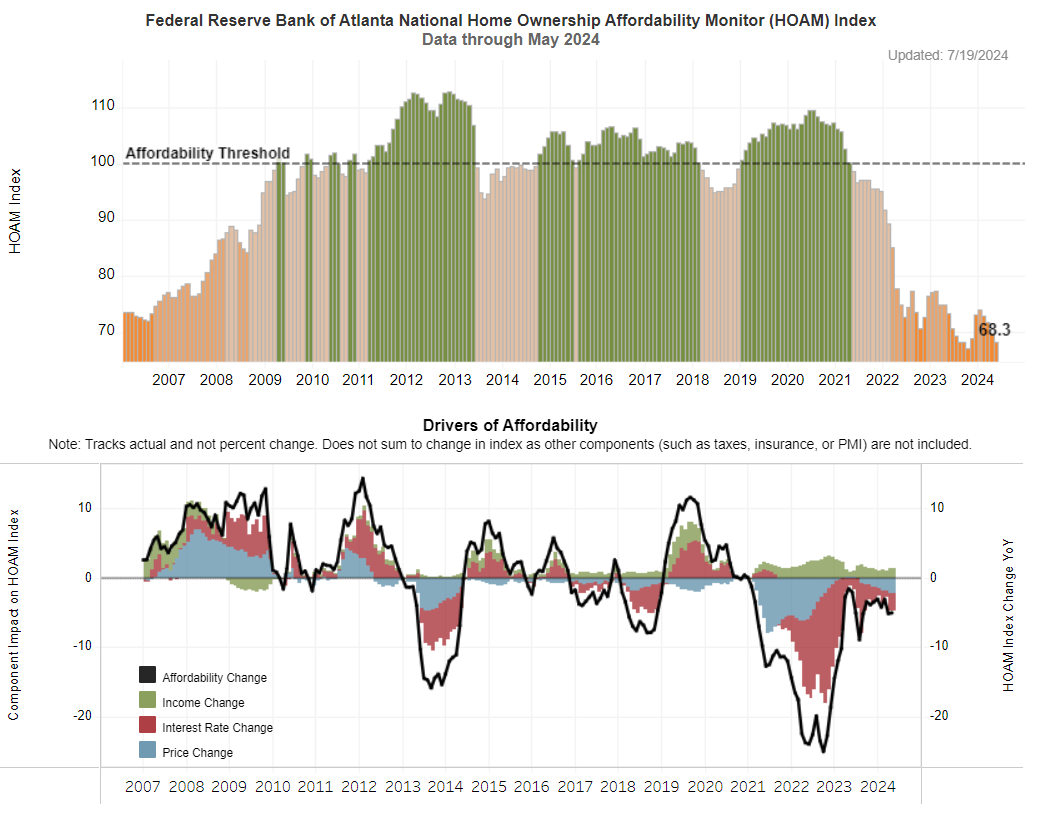
Housing prices continue to be at all-time highs again, with mortgage rates above 8% now, the affordability issue becomes greater each month.
“One measure of the strength of the housing market is the relationship of current prices to their historical levels. On that dimension, it’s worth noting that the National Composite, the 10-City Composite, and seven individual cities (Atlanta, Boston, Charlotte, Chicago, Detroit, Miami, and New York) stand at their all-time highs. Observing the breadth of price changes provides insight into another dimension of market health. On a seasonally adjusted basis, prices increased in 19 of 20 cities in August (and Cleveland only missed by a whisker); before seasonal adjustments, prices rose in 13 cities.
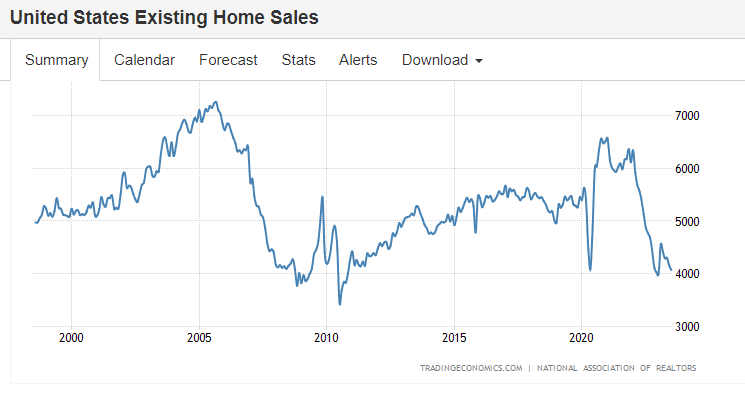
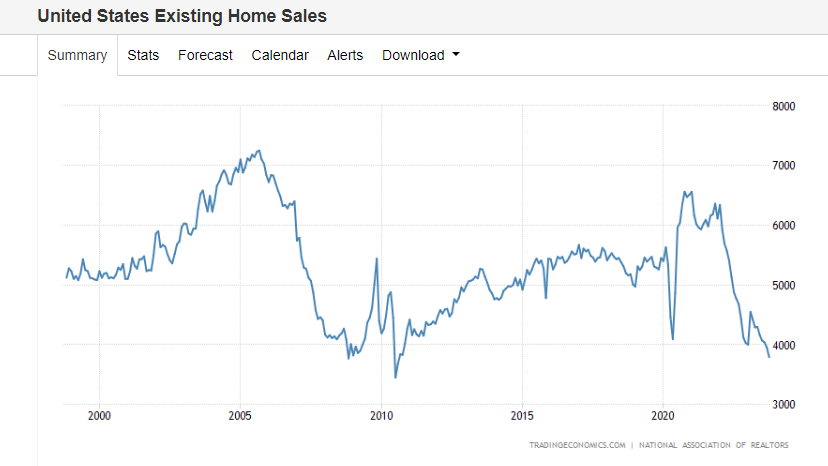
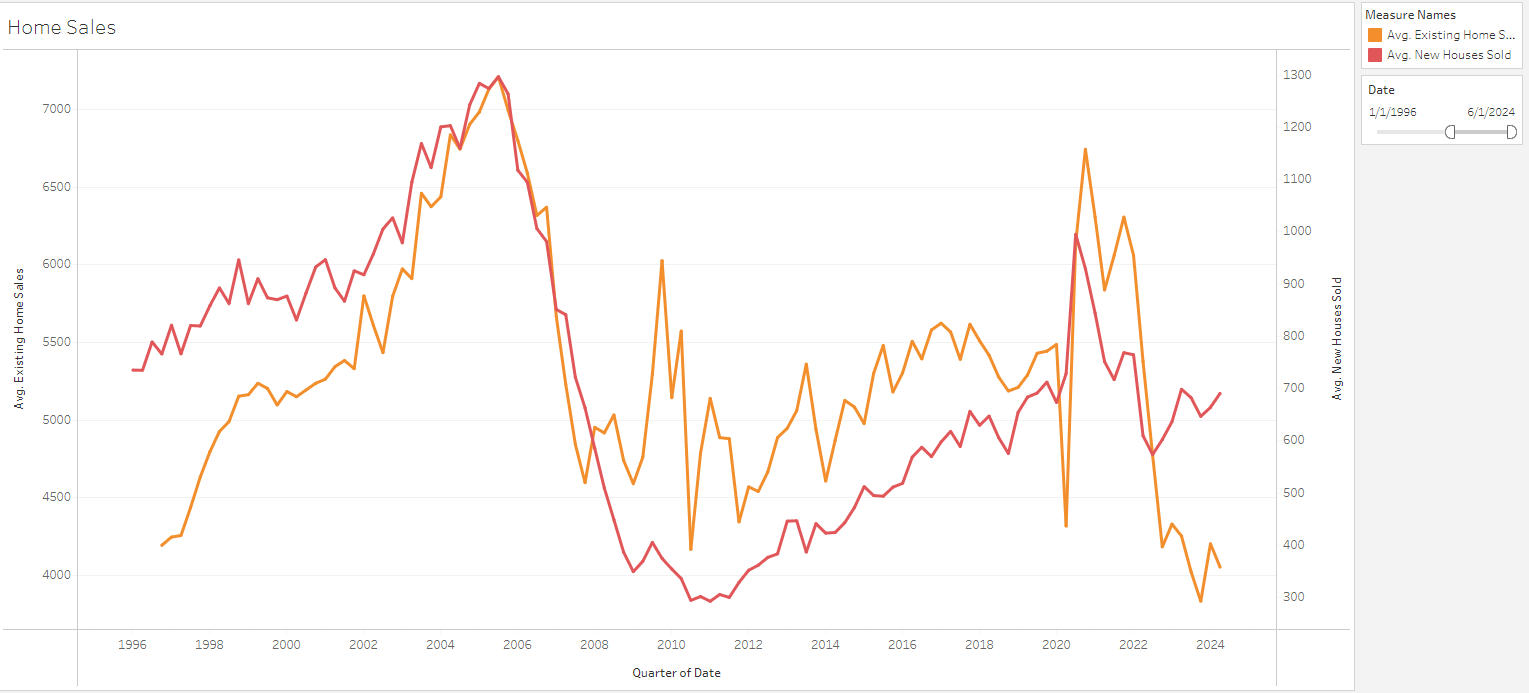
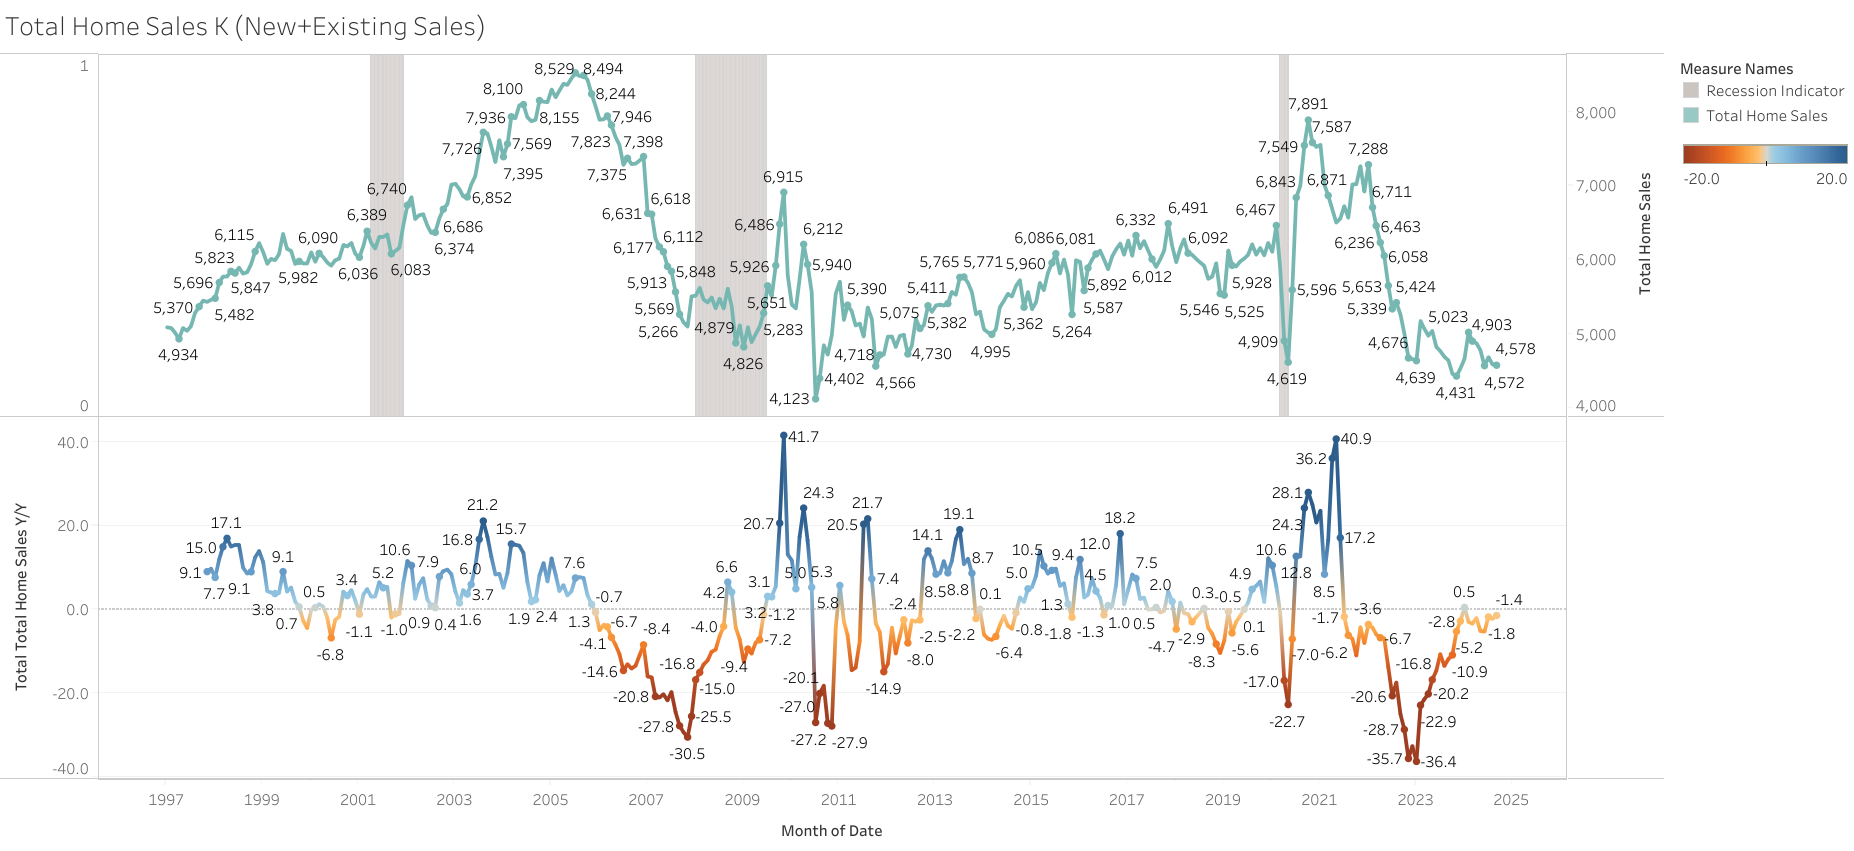
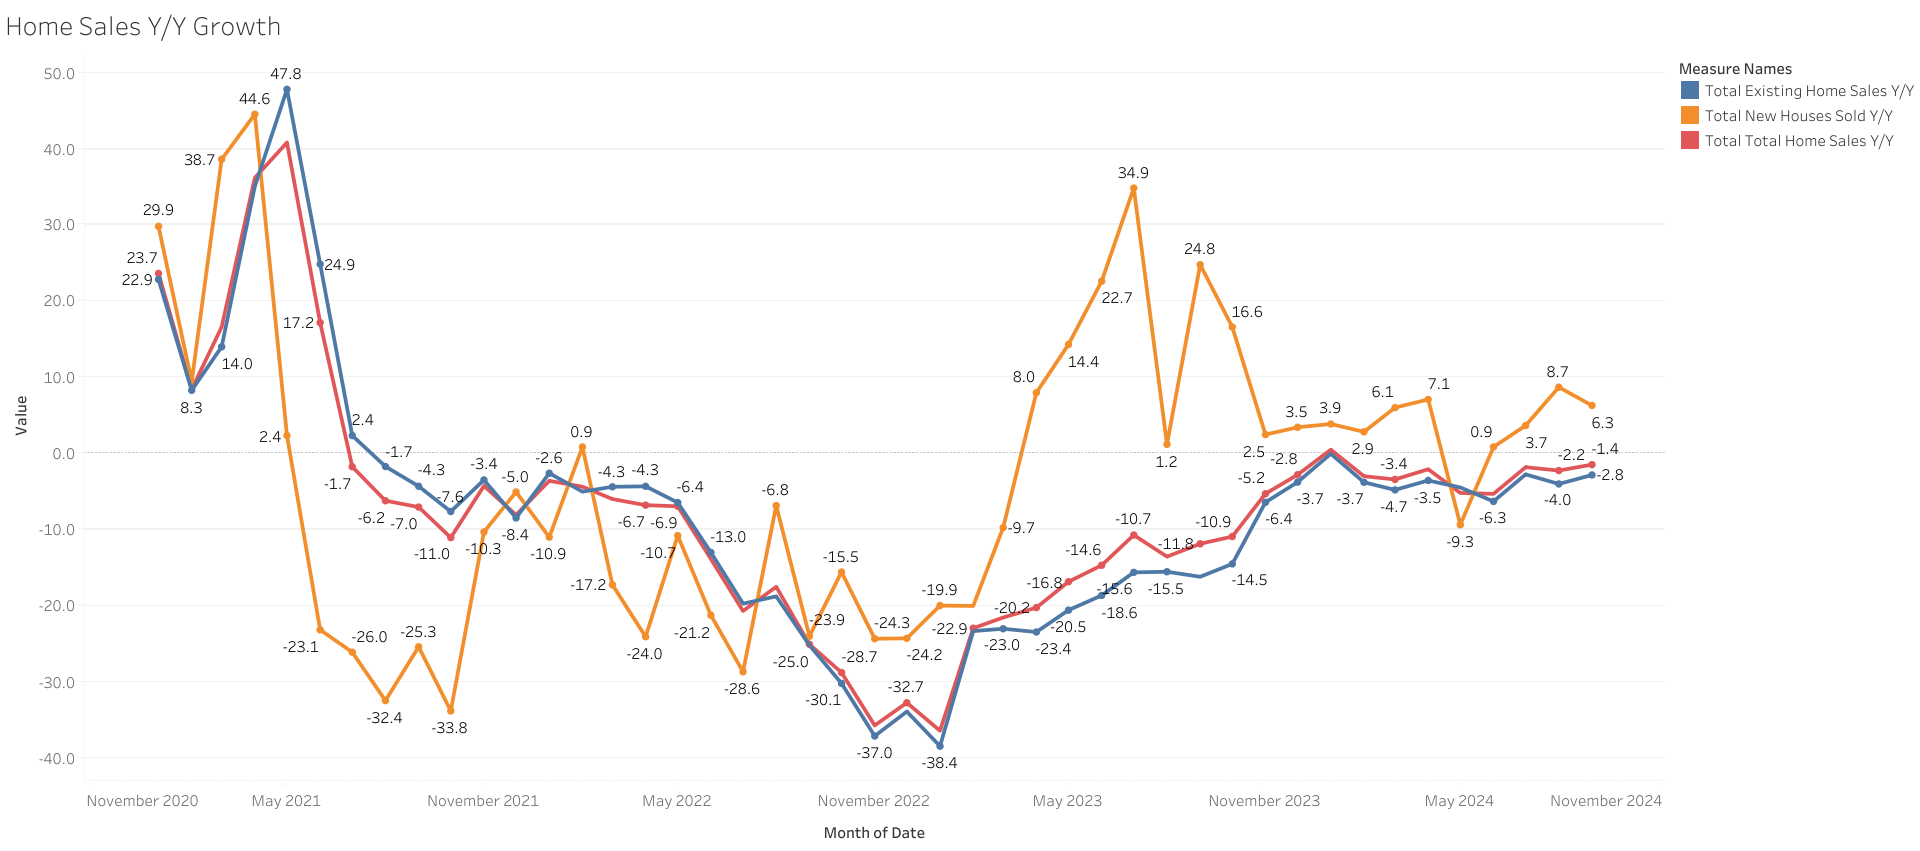
Sales of existing homes in the United States sank 4.1% month-over-month to a seasonally adjusted annualized rate of 3.79 million units in October 2023, the lowest level since August 2010, and below forecasts of 3.9 million (-1.5%).
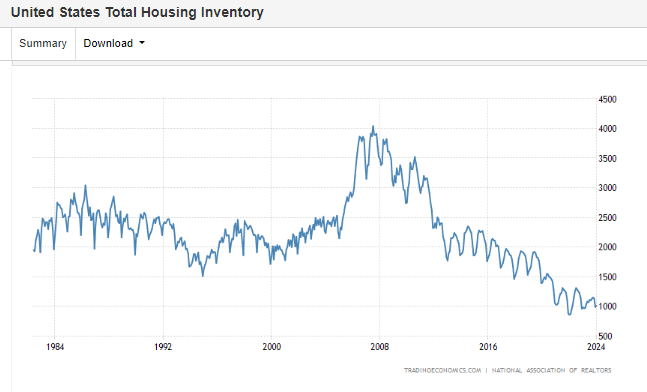
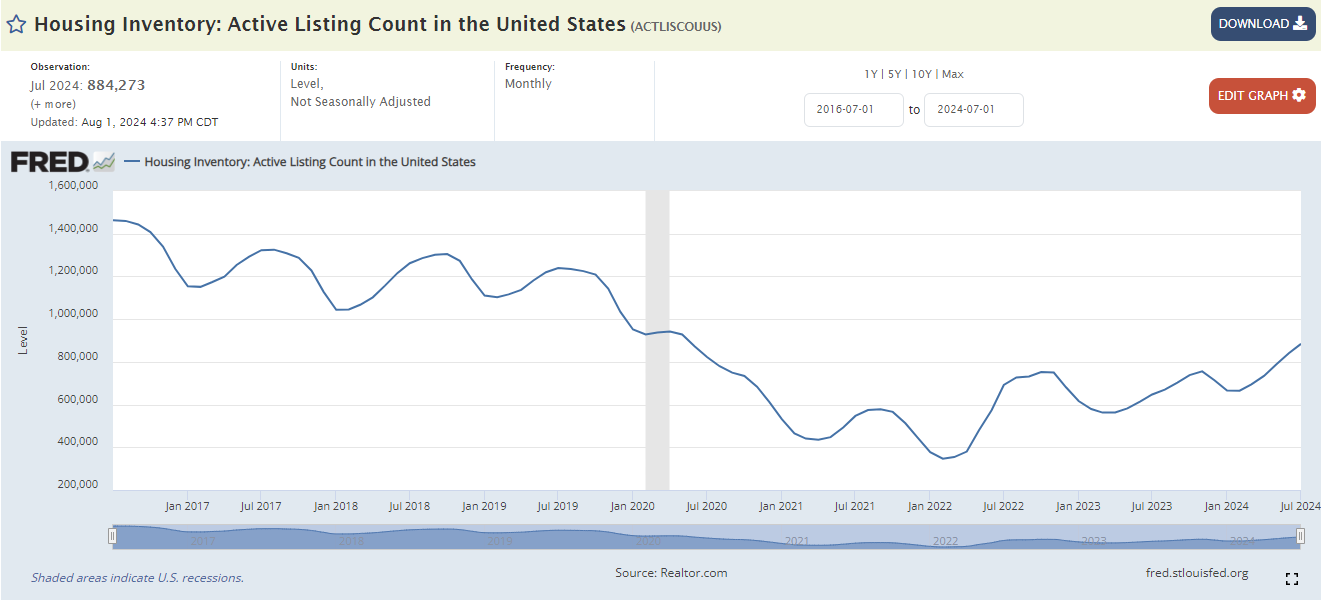
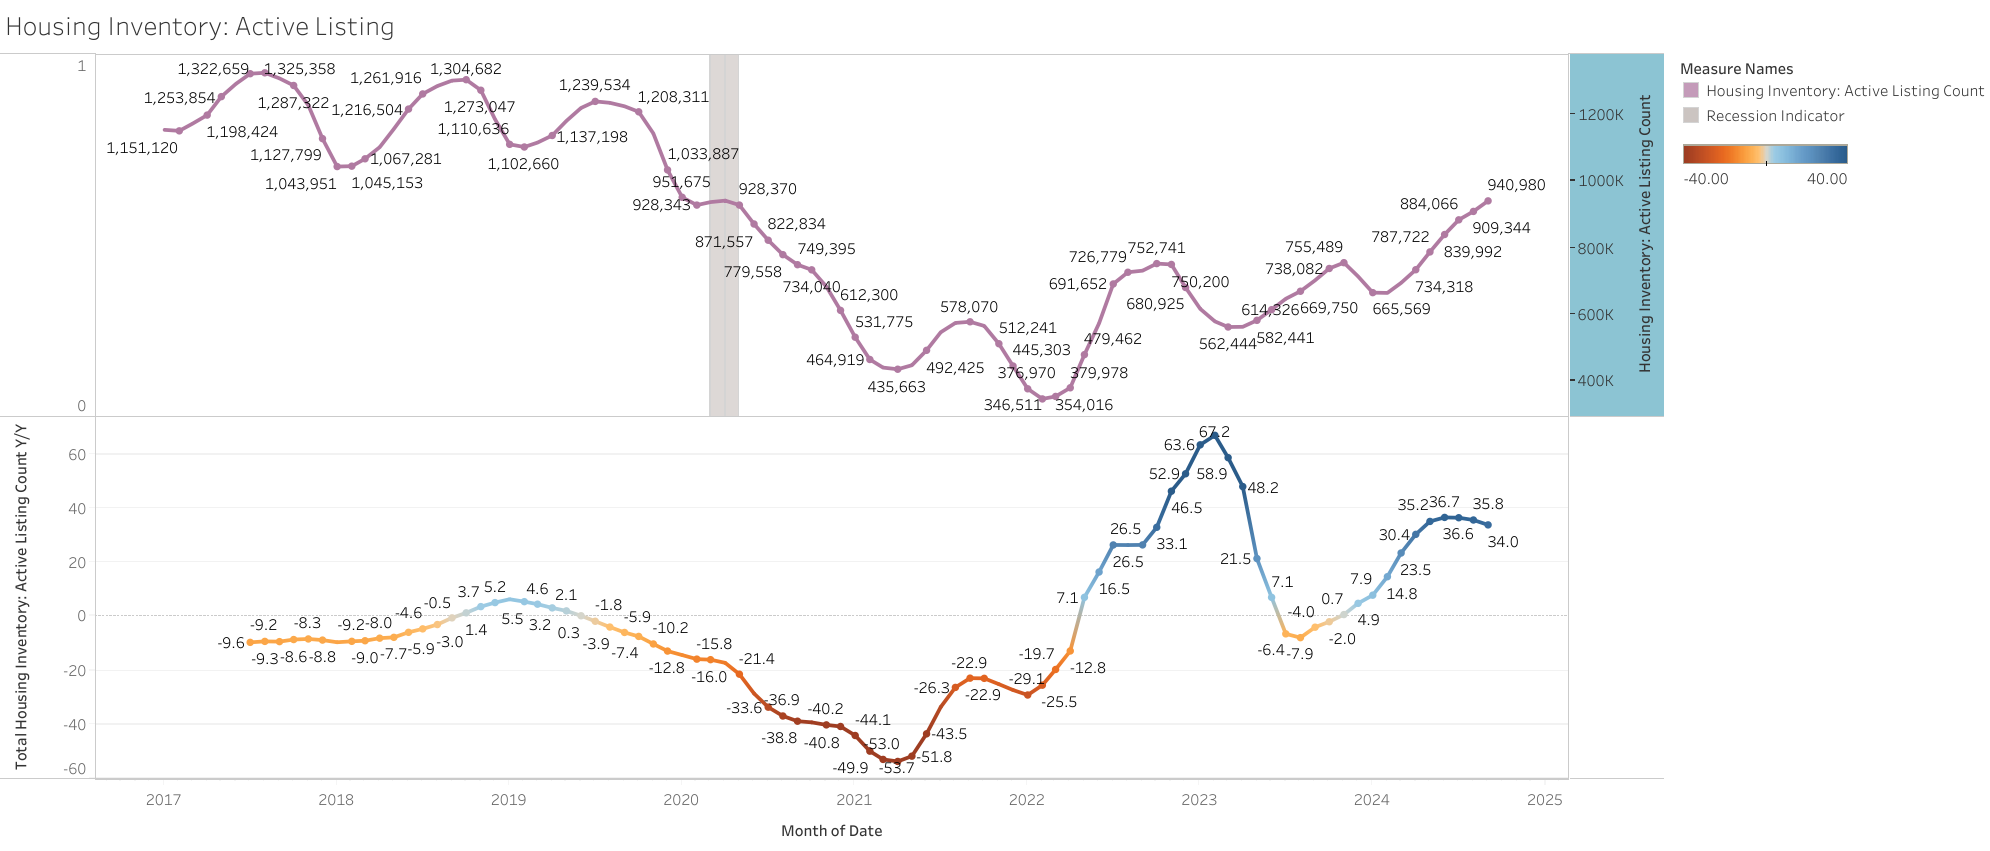
Prices are not collapsing due to tight supply, so the market is pretty much frozen, however, inventory has been slowly increasing since December, still not enough for prices to decline.
“Prospective home buyers experienced another difficult month due to the persistent lack of housing inventory and the highest mortgage rates in a generation,” said NAR Chief Economist Lawrence Yun. “Multiple offers, however, are still occurring, especially on starter and mid-priced homes, even as price concessions are happening in the upper end of the market.”
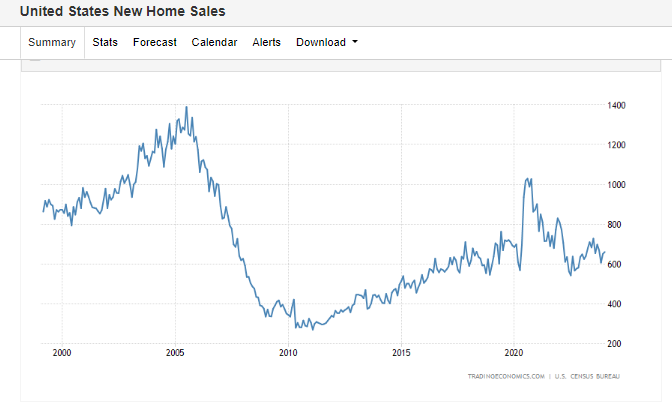
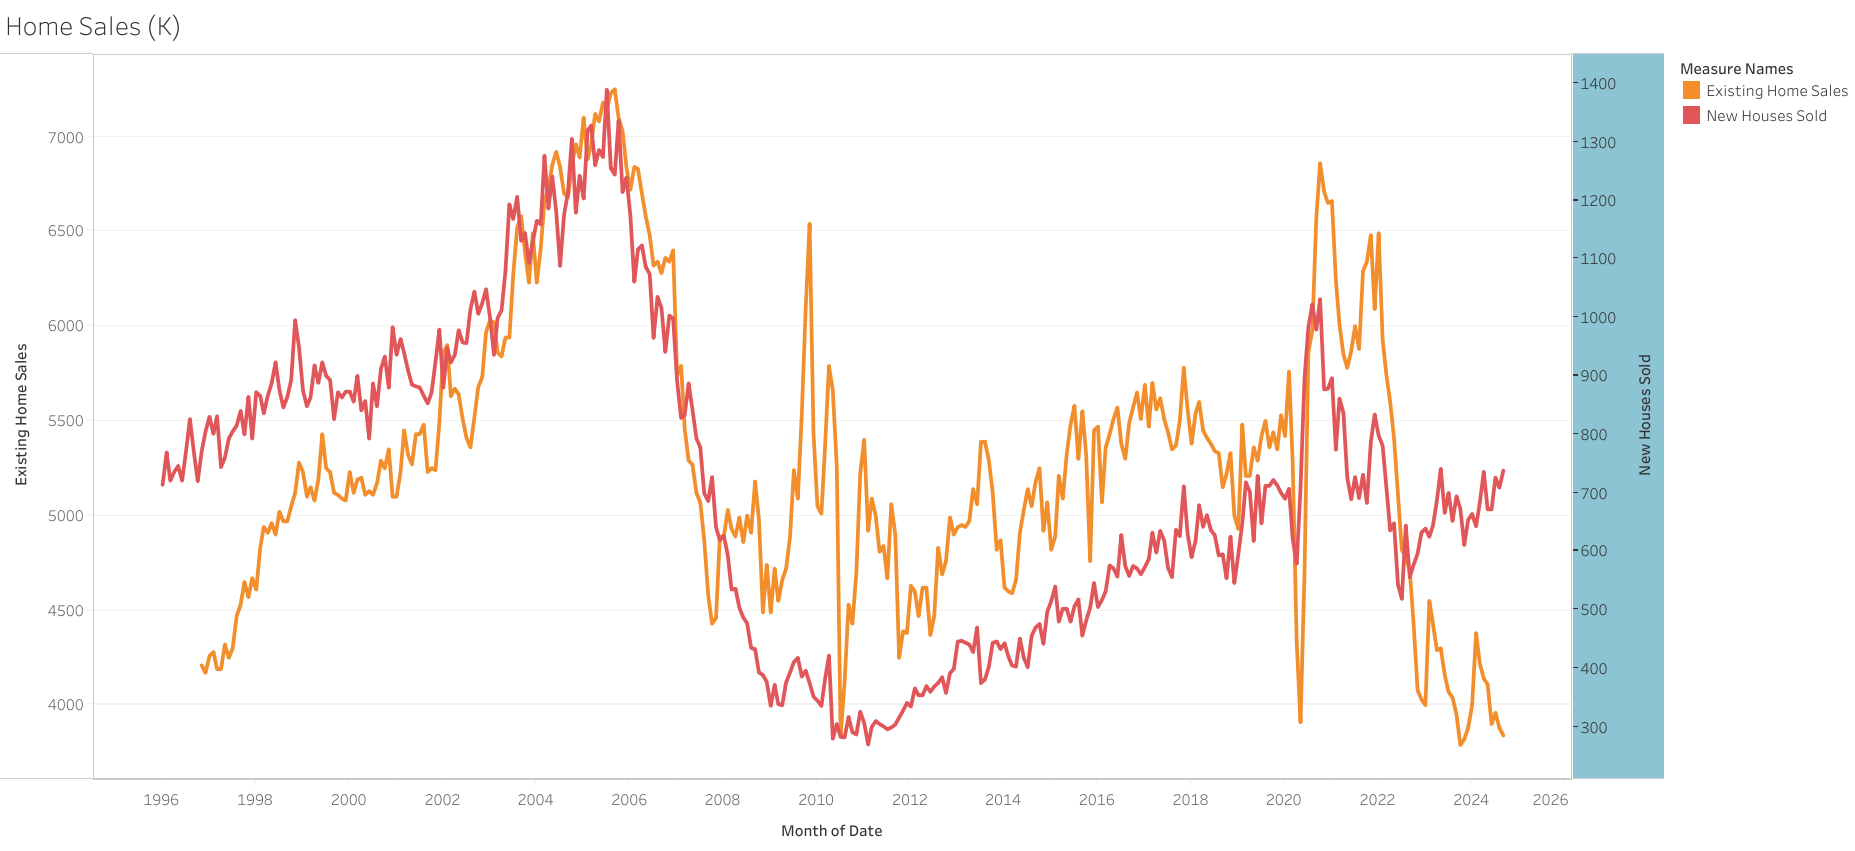
Sales of new homes also declined in October. While their prices are already experiencing a significant fall of 18% y/y, even higher thatn the drop during 2008.
New home sales is still only a smaller part of the market.
I have heard recently the argument from analysts lately that the recent decline in mortgage rates should stimulate demand. But I am skeptical about this since 6+ rates are still way higher than what people were used to before.
And so far, it has not created that anticipated response.
We will most likely see some pick-up in demand from some people who really need to buy a home, but I still don’t think it will be enough to get out of the really depress levels currently.
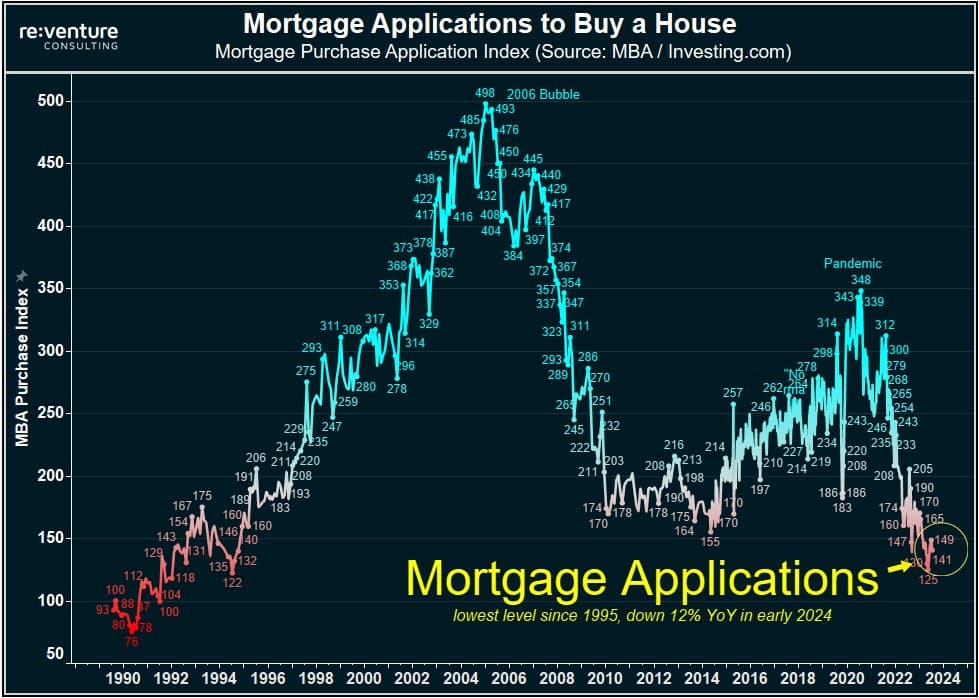
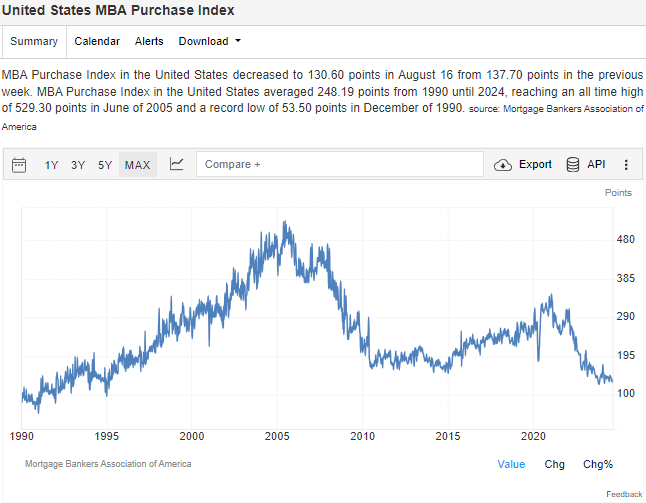
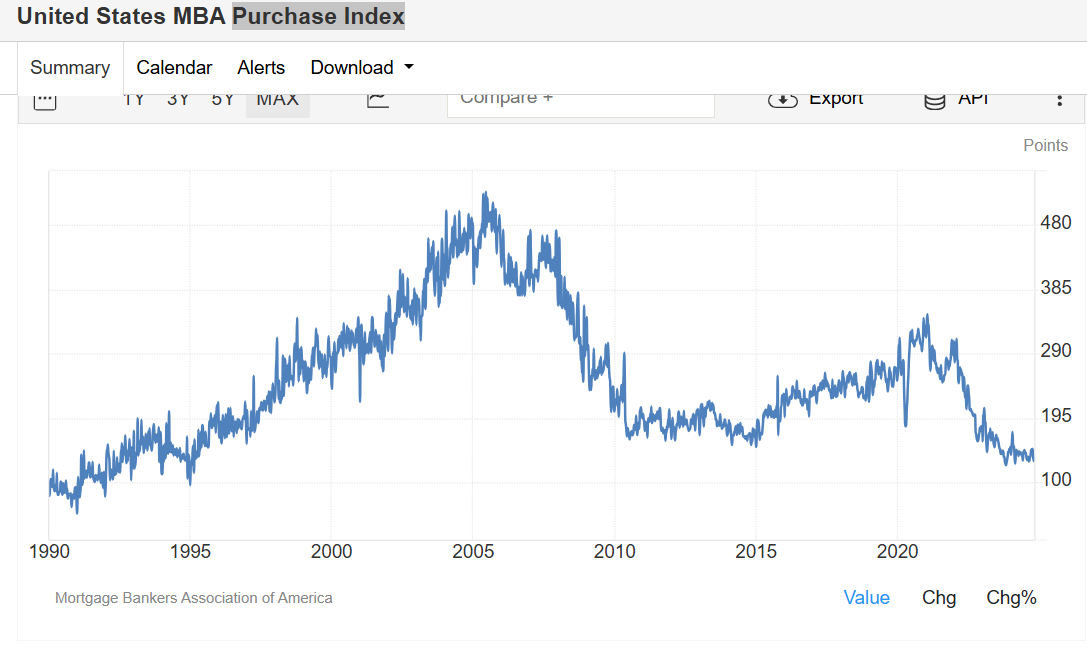
“The recent decline in rates has given the housing market some cause for optimism going into 2024, but purchase applications have not yet picked up in response, with the overall level of purchase activity 12 percent lower than a year ago. Refinance applications were still at very low levels, but were 15 percent higher than a year ago.”
For the first time since January 2023, the U.S. National Index posted 0.2% month-over-month decreases in November, But After seasonal adjustment, the U.S. National Indestill increased 0.2 m/m.
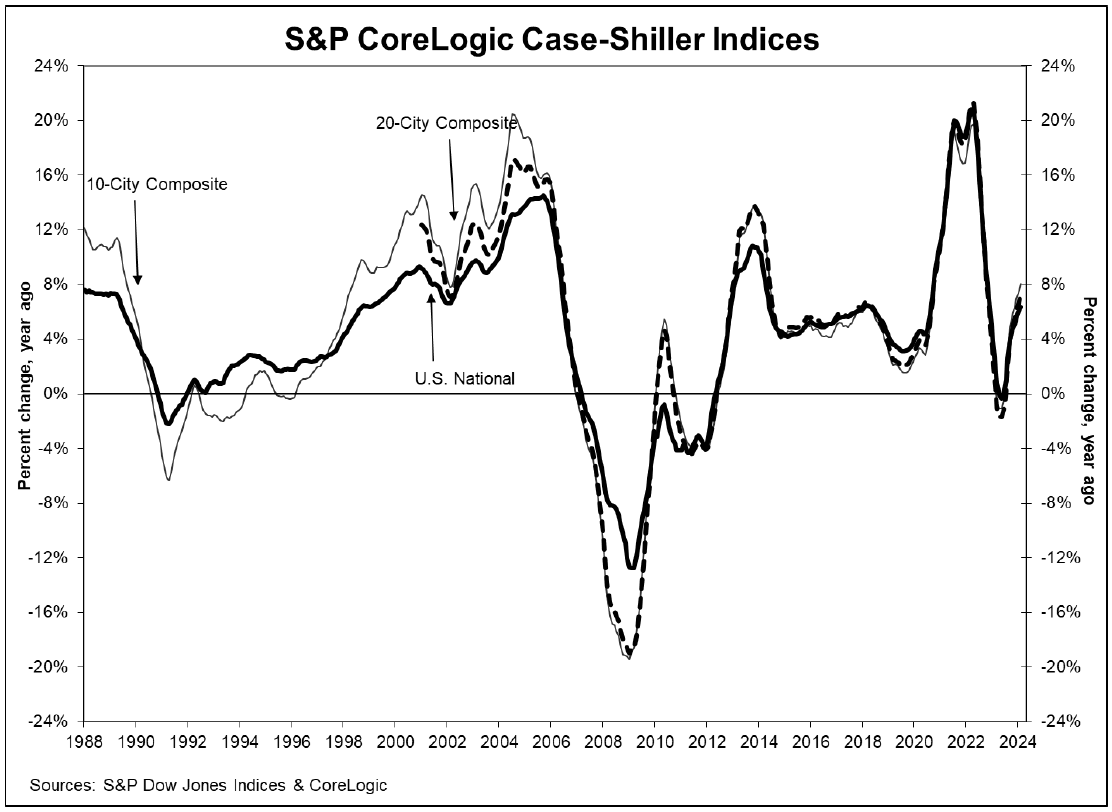
And the U.S. National Home Price NSA Index, covering all nine U.S. census divisions, reported a 5.1% annual gain in November, up from a 4.7% rise in the previous month.
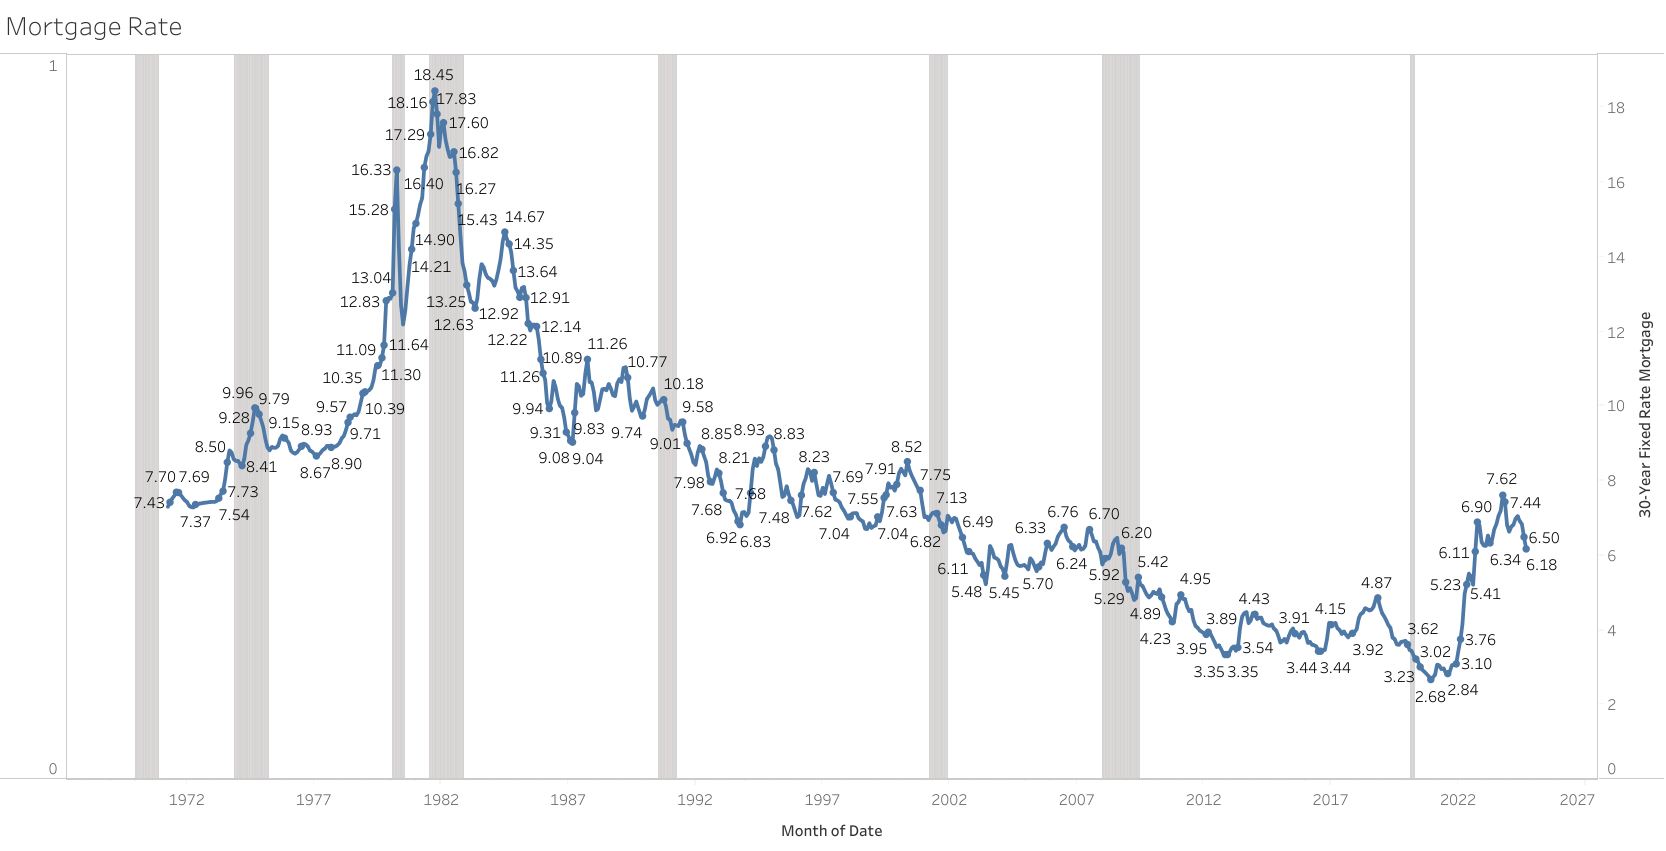
“The tight disparity speaks to a rising tide across the country, with less evidence of micro-markets bucking the trend. The days of markets in the South rising double digits with markets in the Midwest remaining flat are over. The house price decline came at a time where mortgage rates peaked, with the average Freddie Mac 30-year fixed rate mortgage nearing 8%, according to Federal Reserve data. The rate has since fallen over 1%, which could support further annual gains in home prices.”
S&P CoreLogic Case-Shiller Index Upward Trend Decelerates in November - Index Announcements | S&P Dow Jones Indices
Affordability remains extremely low.
Activity remains low and prices still very high, though the recovery from lower yields since October continues but is still very slow.
However, mortgage rates have started to increase again in February, as long-term yields have also reversed a bit due to January economic data.
Supply also remains very low.
Existing home sales in the US rose 3.1% month-over-month to a seasonally adjusted annualized rate of 4 million units in January 2024, the highest level in five months, compared to 3.88 million in December and market forecasts of 3.97 million.
New Home Sales of ew single-family houses in the United States rose by 1.5% from the previous month to a seasonally adjusted annualized rate of 661,000 in January of 2024, missing market expectations of 680,000. Still, the reading marked the second straight month of higher sales, consistent with the drop in mortgage rates during the first month of the year.
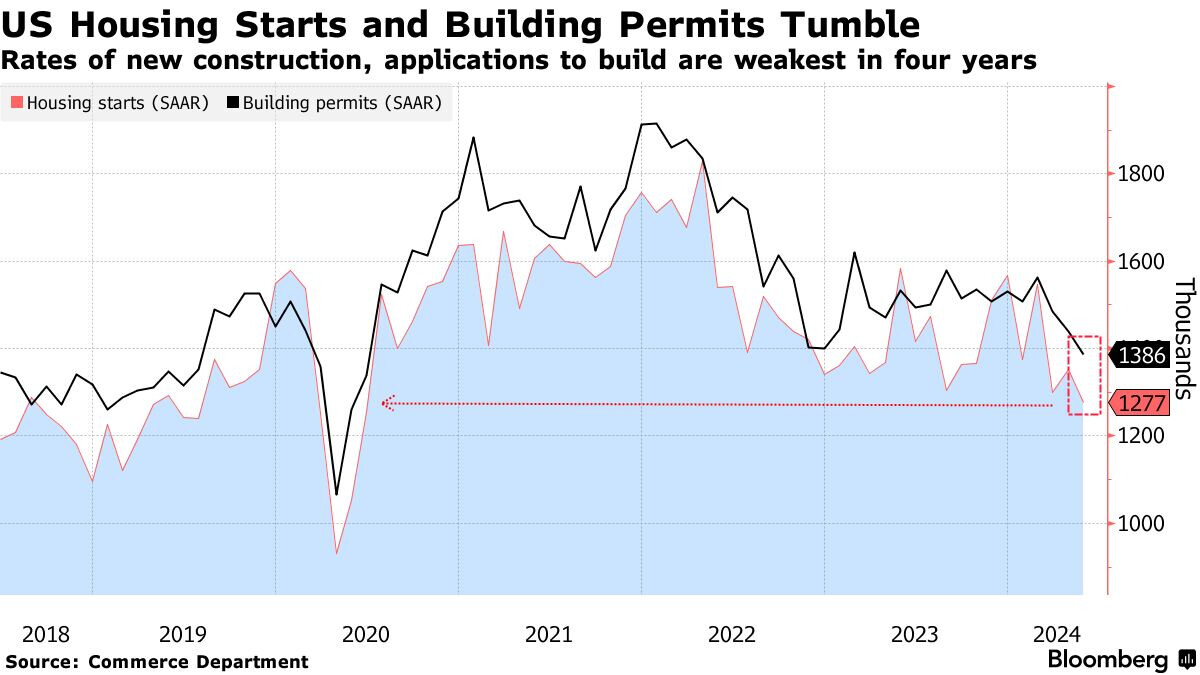
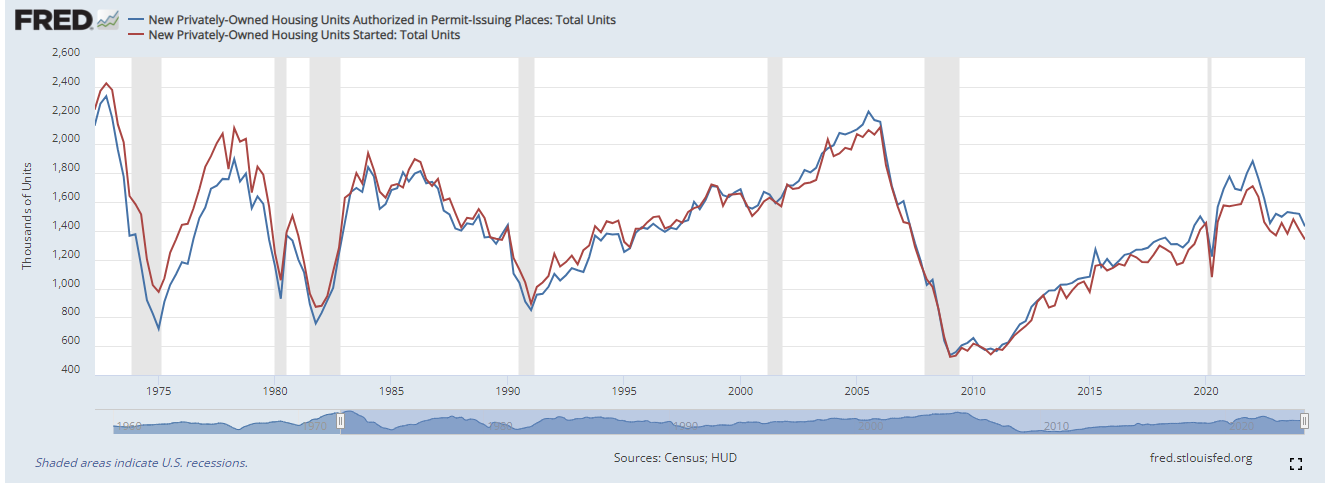
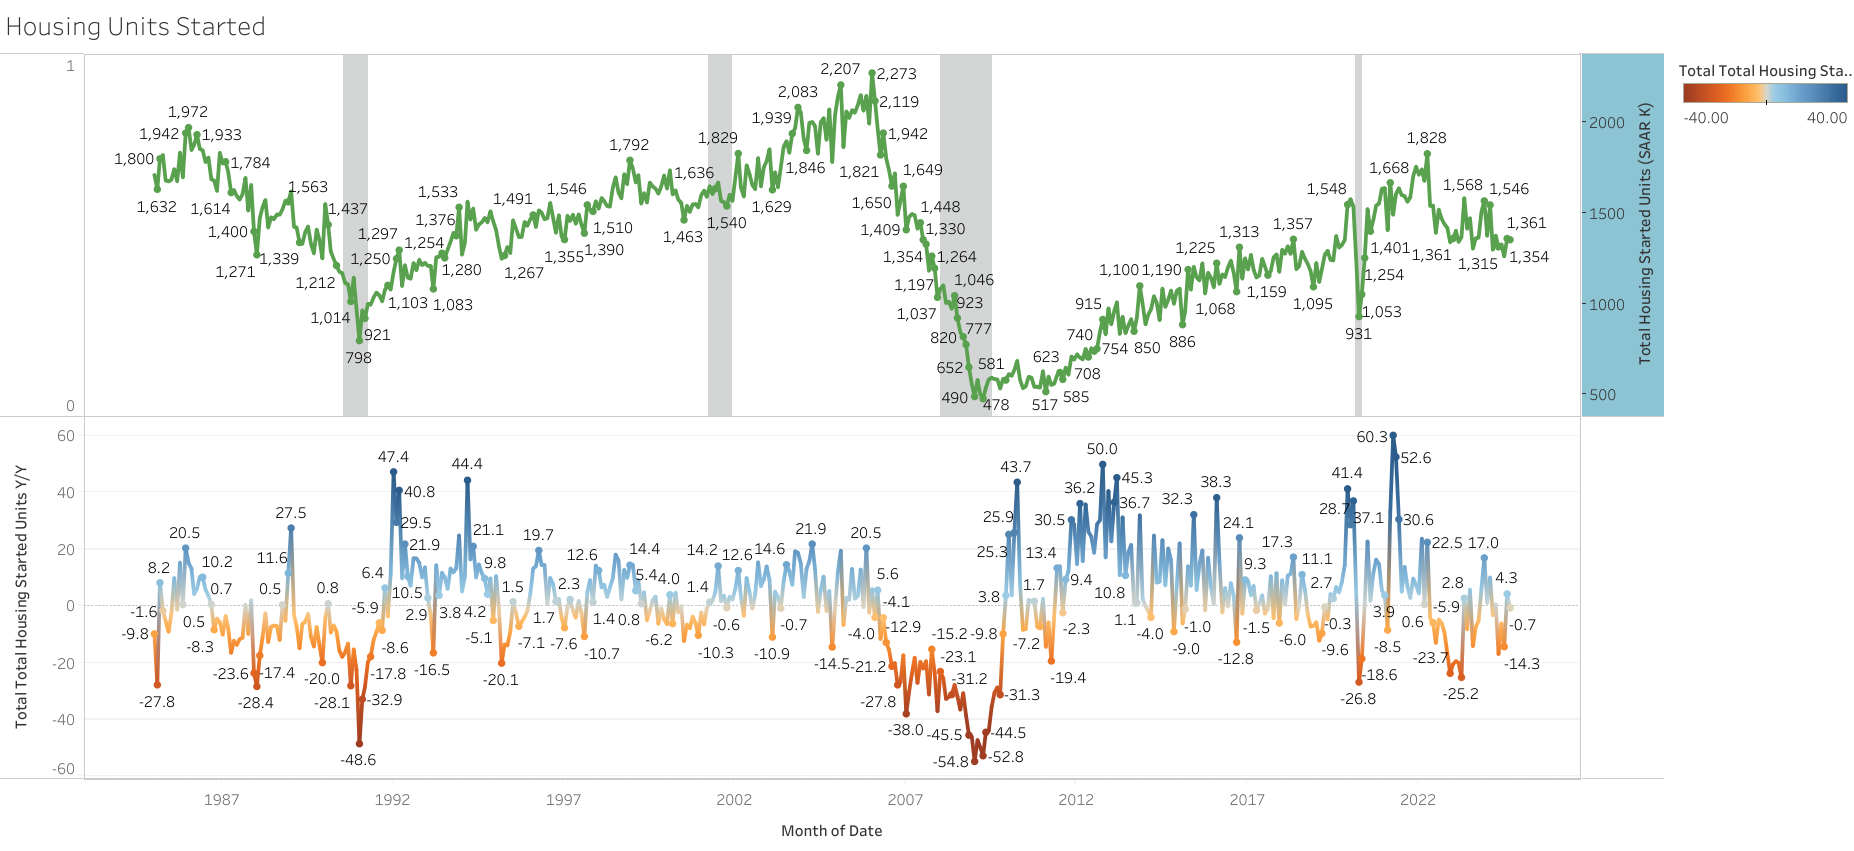
Building permits in the United States went down by 0.3% to a seasonally adjusted annual rate of 1.489 million in January 2024, down from December’s 1.493 million and compared with a preliminary estimate of 1.470 million
Housing starts in the US slumped 14.8% month-over-month to an annualized 1.331 million in January 2024, the lowest since August and missing market forecasts of 1.46 million.
Total Housing Inventory in the United States increased to 1010 Thousands in January from 990 Thousands in December of 2023, but remains very low historically.
The S&P CoreLogic Case-Shiller 20-city home price index in the US declined 0.3% month-over-month in December 2023, following a 0.2% fall in November. Still 6.1% Y/Y.
Mortgage Applications to purchase a home or to refinance remain at the lowest level since the mid 90s.
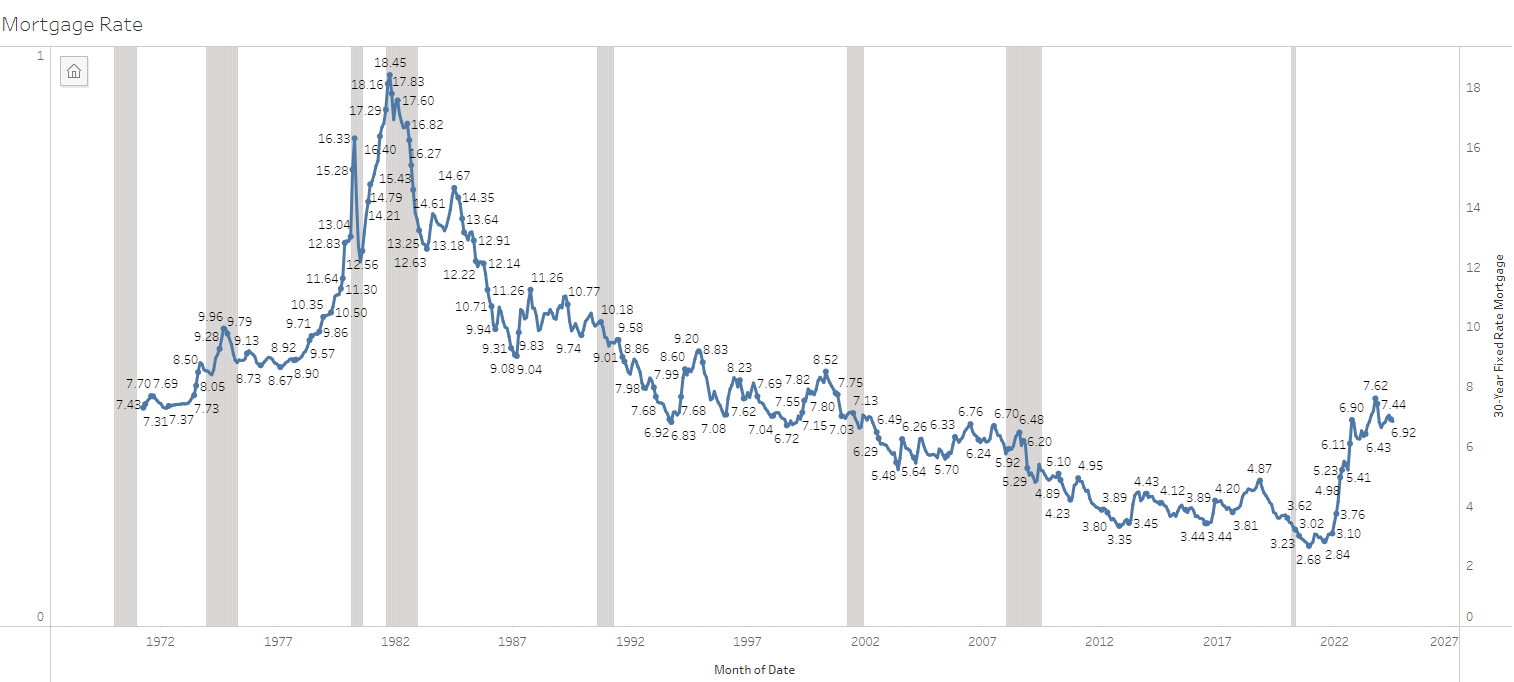
The average rate on a 30-year fixed mortgage was at 6.9% as of February 22nd, rising 13bps from the prior week to the highest level in over two months. One year ago, the average rate on a 30-year fixed mortgage was 6.5%.
Builder Sentiment is still low, but has been improving in recent months, mostly due to the prospect of rate cuts, and low supply. The NAHB/Wells Fargo Housing Market Index in the United States increased to 48 in February 2024, the highest in six months, compared to 44 in January and beating forecasts of 46
Housing prices continue on an upward trend, with a considerable increase in February.
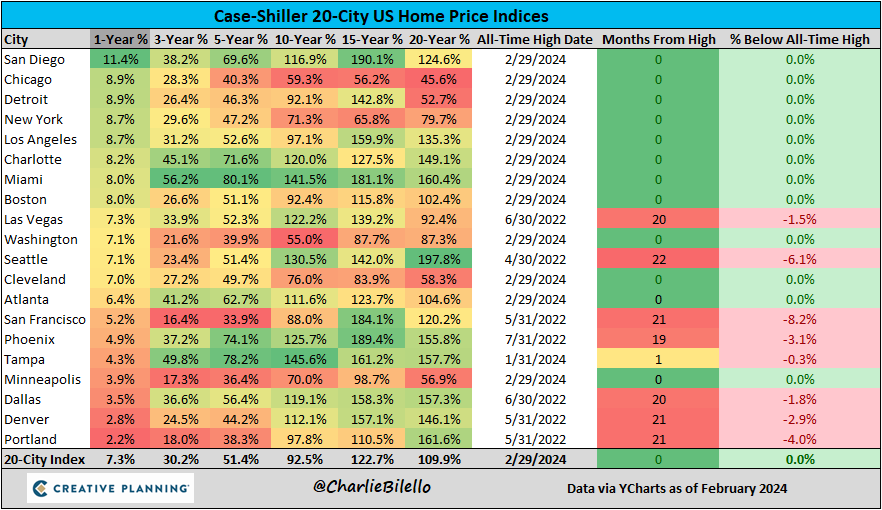
“Following last year’s decline, U.S. home prices are at or near all-time highs. Our 10- and 20-City Composite indices are currently at all-time highs. For the third consecutive month, all cities reported increases in annual prices, with four currently at all-time highs: San Diego, Los Angeles, Washington, D.C., and New York.
Enthusiasm for potential Fed cuts and lower mortgage rates appears to have supported buyer behavior, driving the 10- and 20- City Composites to new highs.”
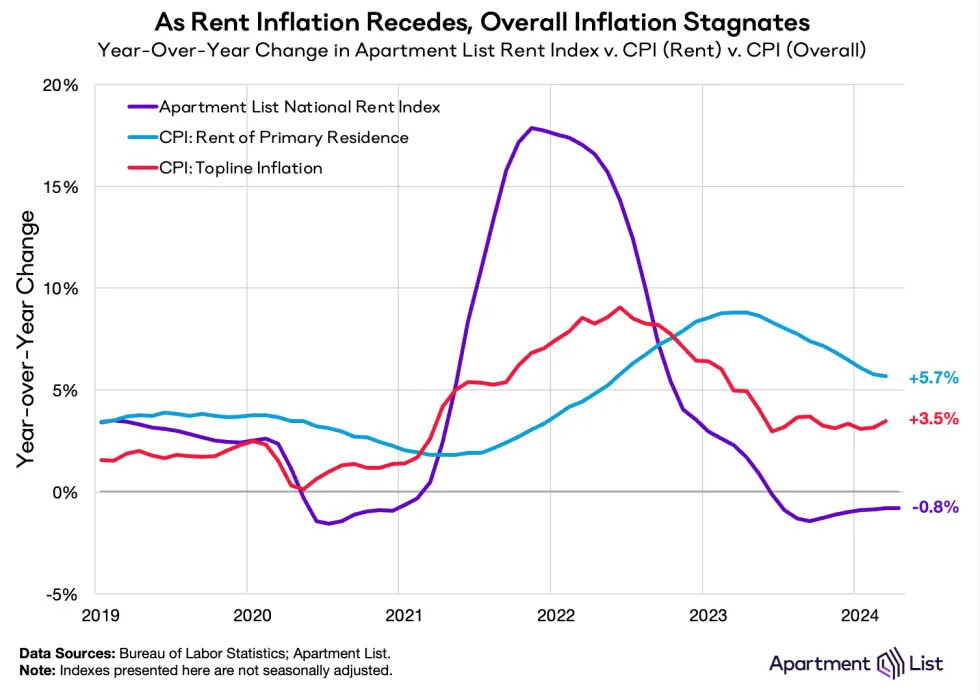
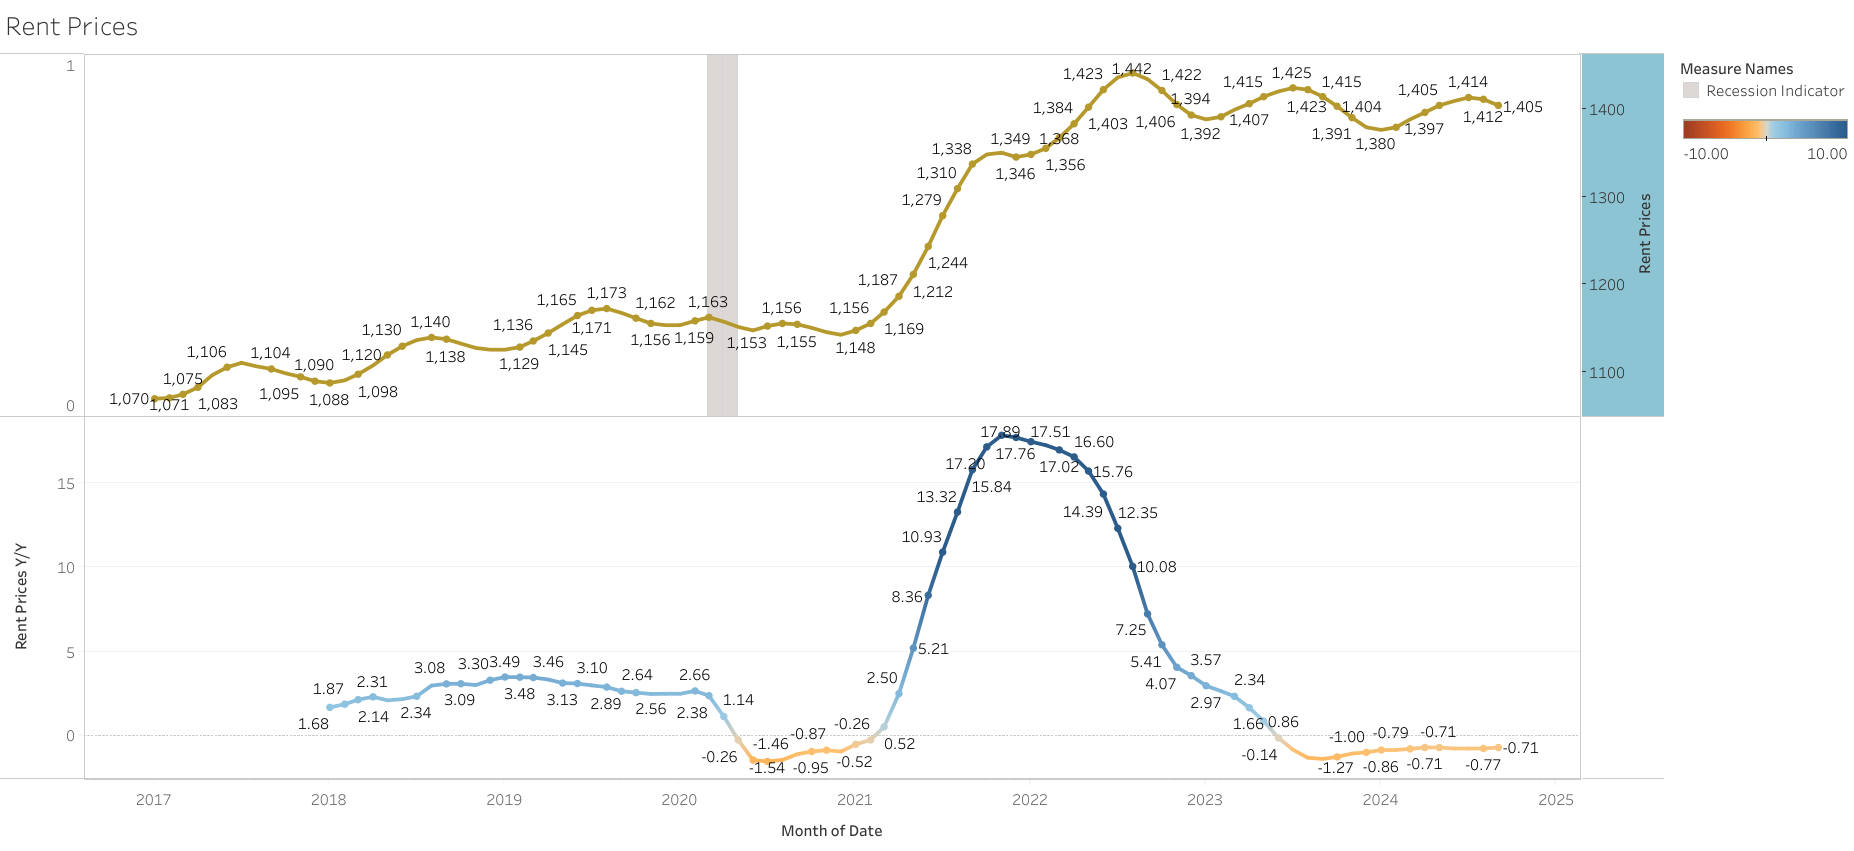
Rent went up for a third straight month, still low on a y/y basis.
The recovery of the housing market failed until now, recent month data has come out weaker than expected, with a renewed downtrend in activity.
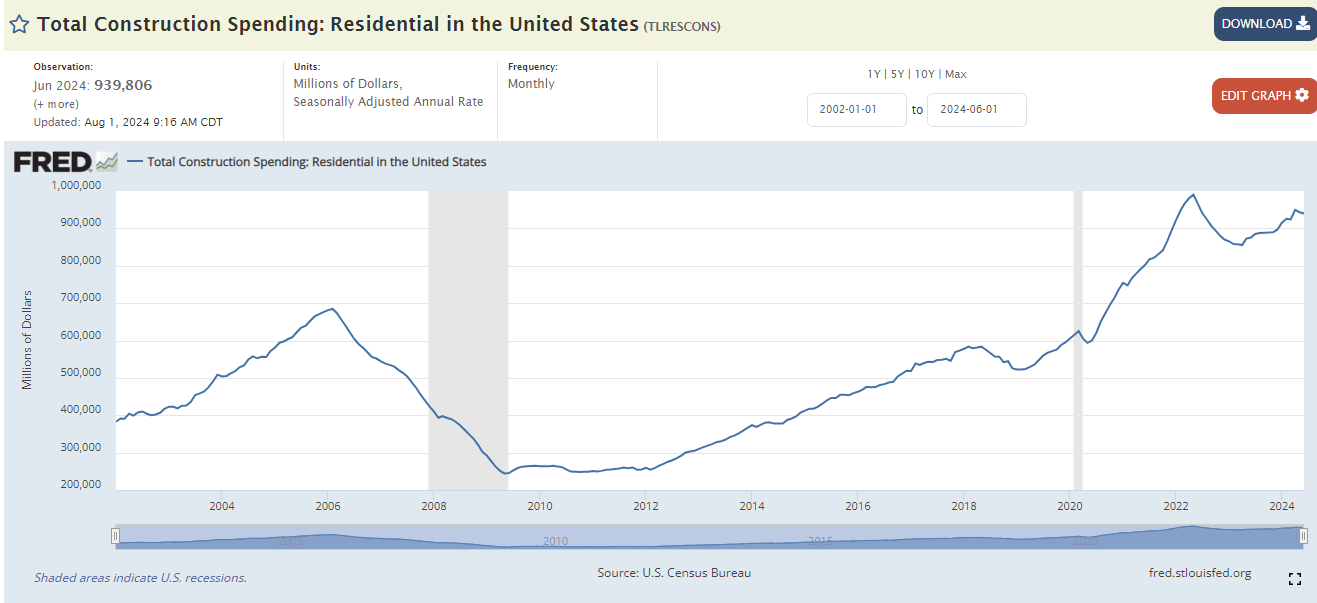
I expect this will have a slight negative contribution to Q2 GDP from residential investment.
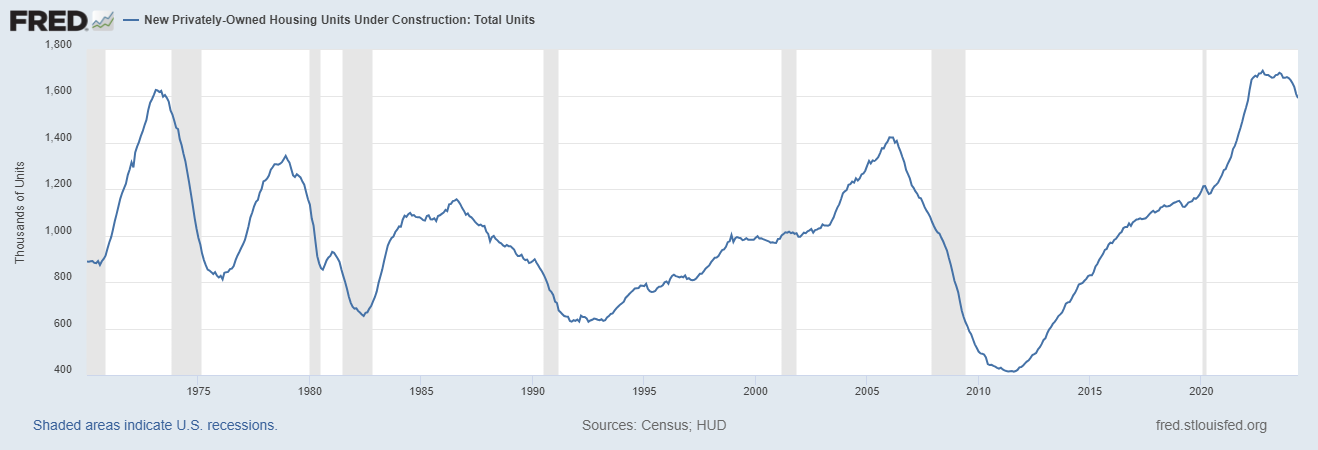
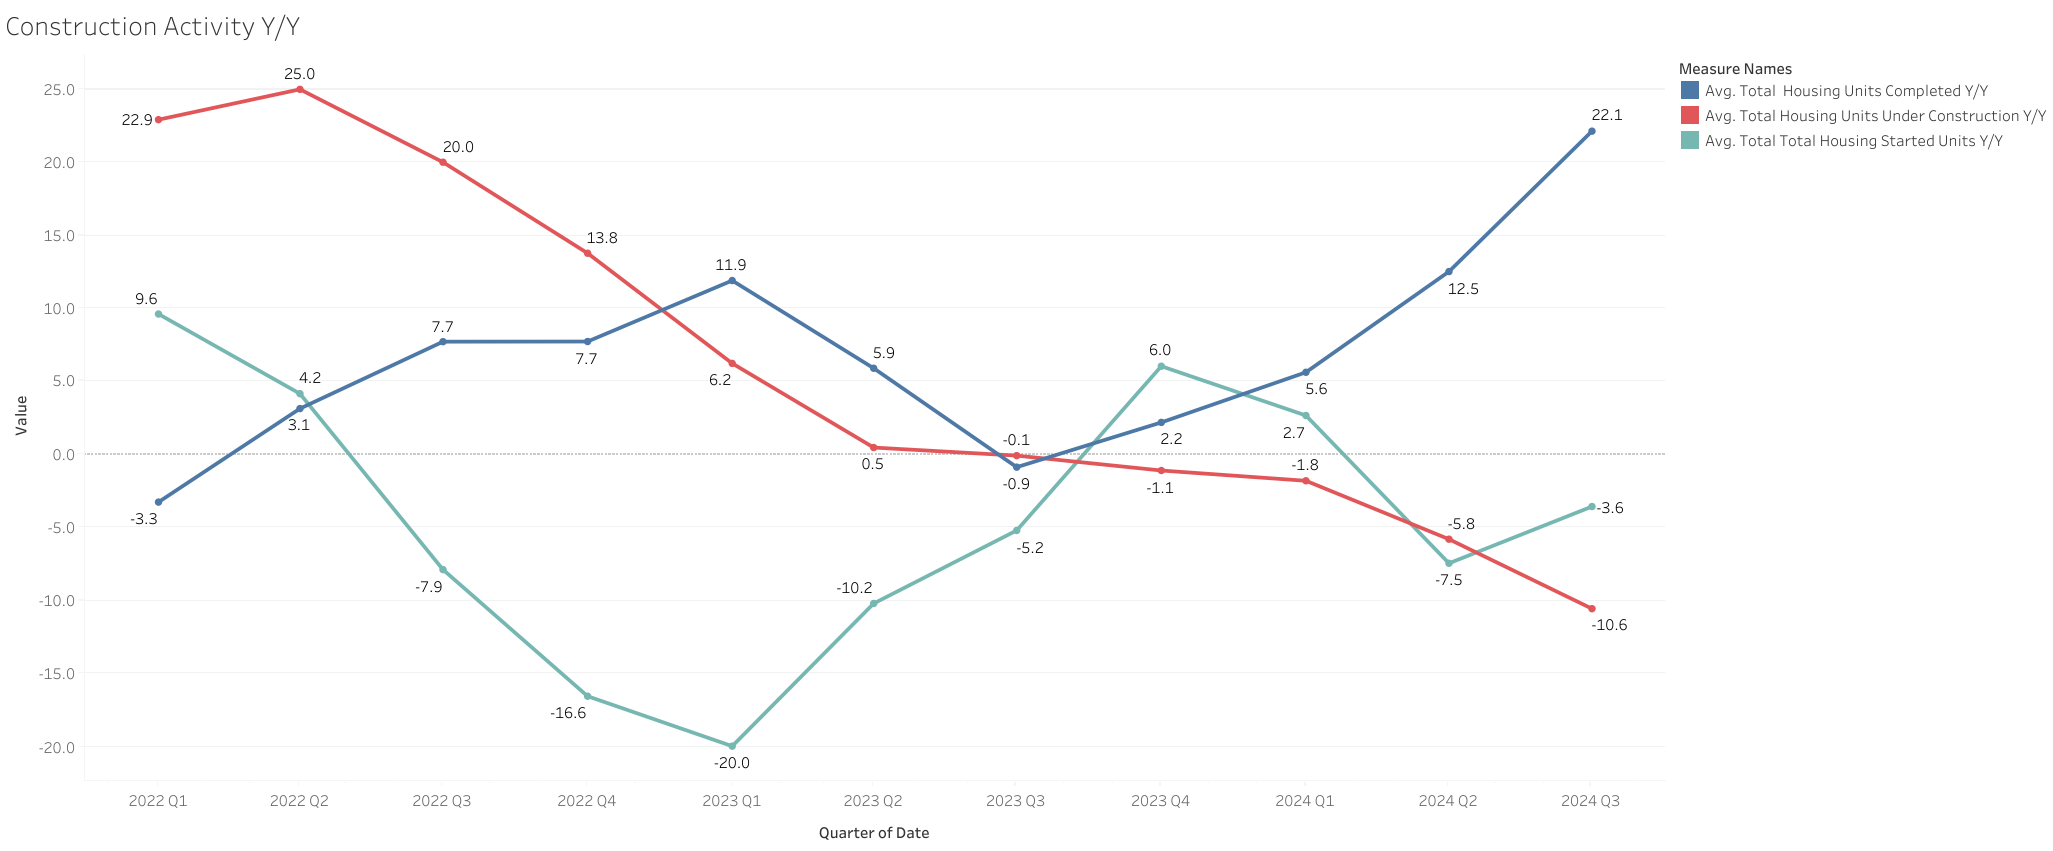
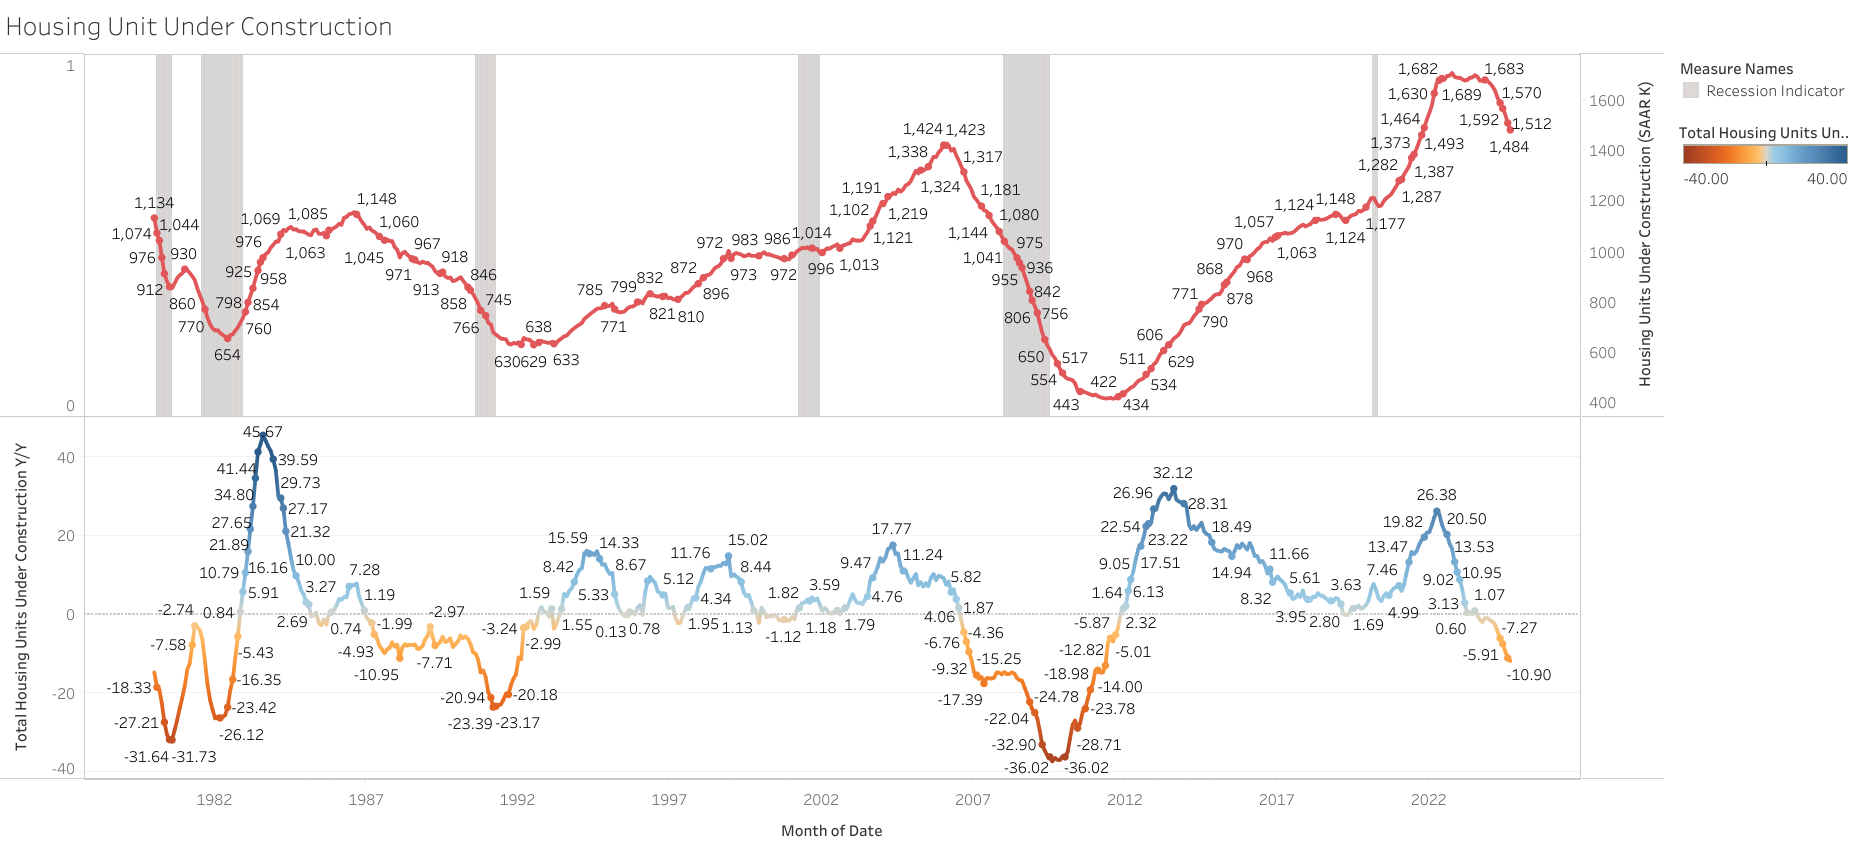
The implication of a failed recovery on permits and housing starts is a continued decline in the backlog of units under construction, which has started to turn (-5.9% Y/Y)
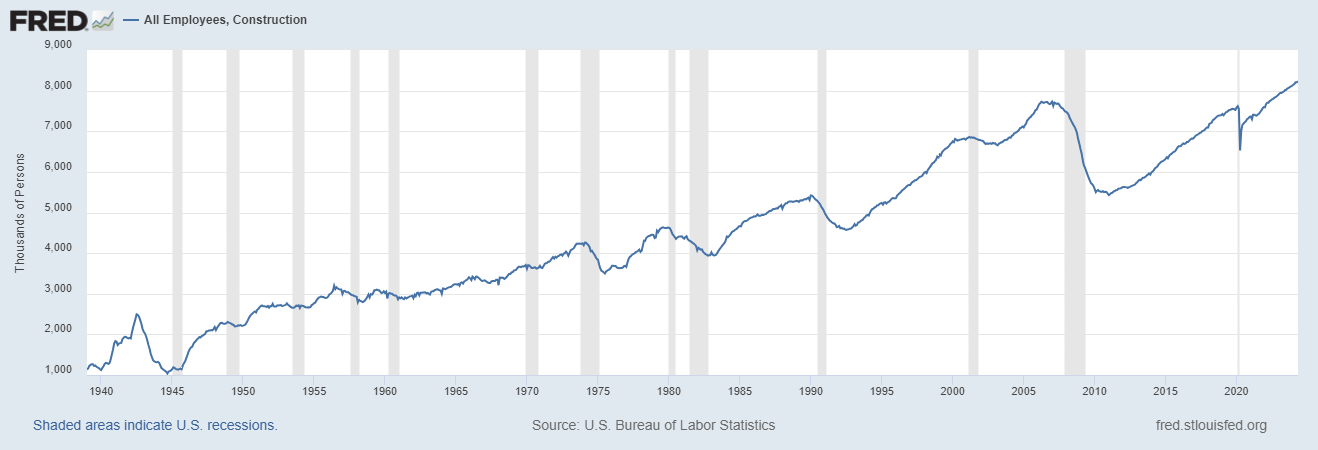
—> A decline in units under construction will lead to a decline in construction employment that remains at peaks.
—> Construction employment is one of the first employment sectors to fall before or at a recession start. (Housing is one of the most leading sectors)
Data: US Economic Data - Google Sheets
Bloomberg - Are you a robot?
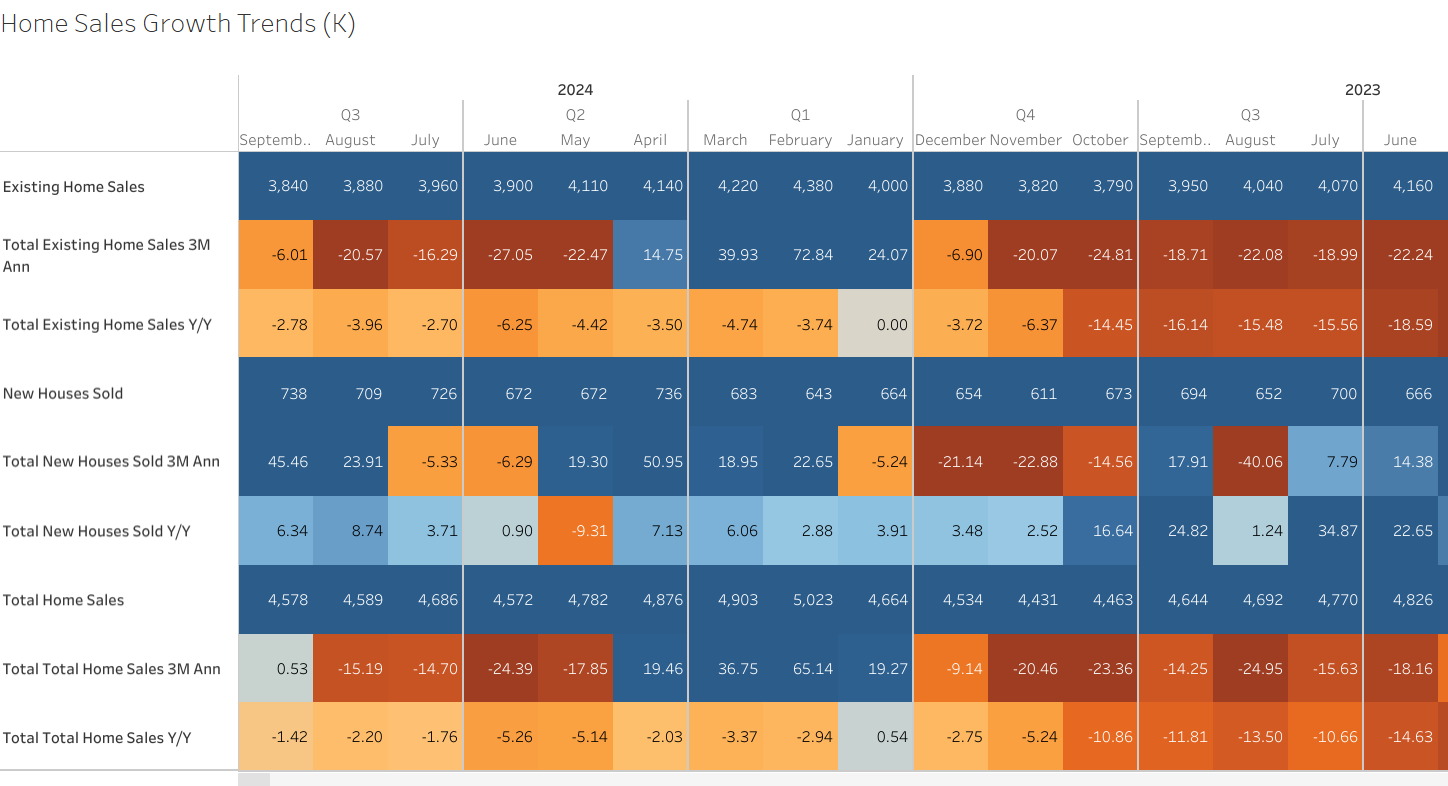
In Q2 2024, the US housing market continued to face challenges due to high mortgage rates, rising prices, reduced affordability, rising but low supply, and depressed sales and construction activity.
The housing market continues to exhibit significant weakness, as reflected in the residential component of GDP, which detracted from growth in Q3 2024.
The ‘lock-in effect’—where homeowners hold historically low mortgage rates from the 2010-2019 period—combined with severe affordability challenges, suggests that a meaningful rebound in activity is unlikely until mortgage rates decrease substantially or home prices see a notable correction, or until we see significant fiscal stimulus again.
Given these factors, I still expect the residential sector to remain subdued through the remainder of the year and into 2025
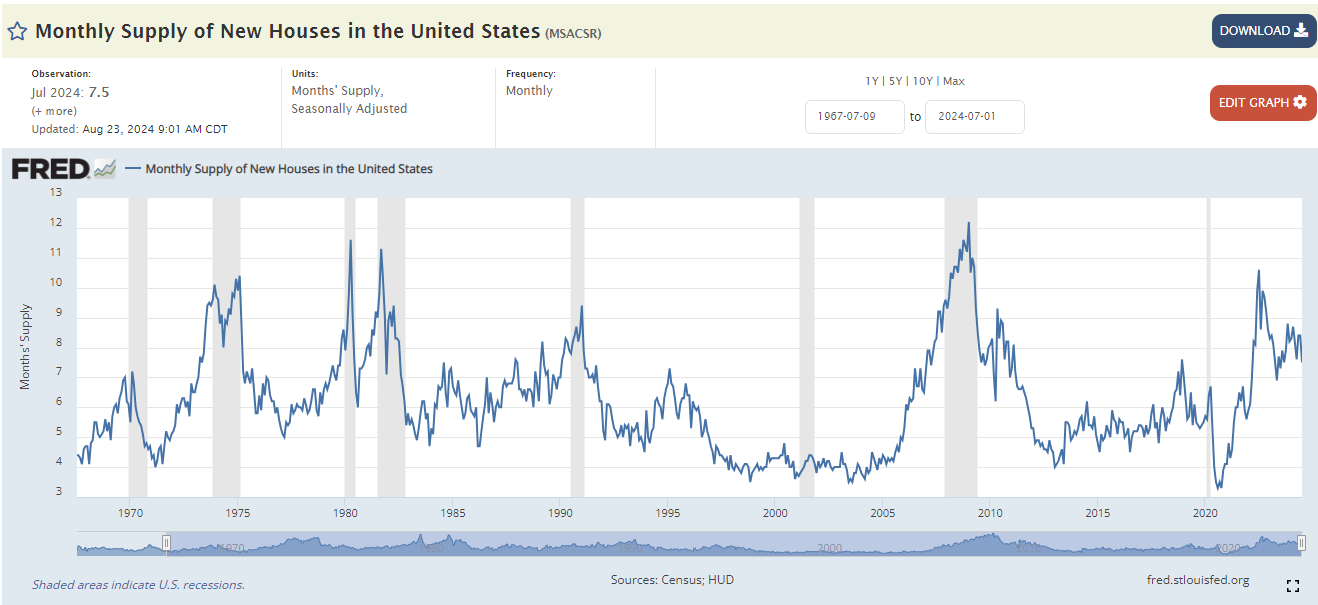
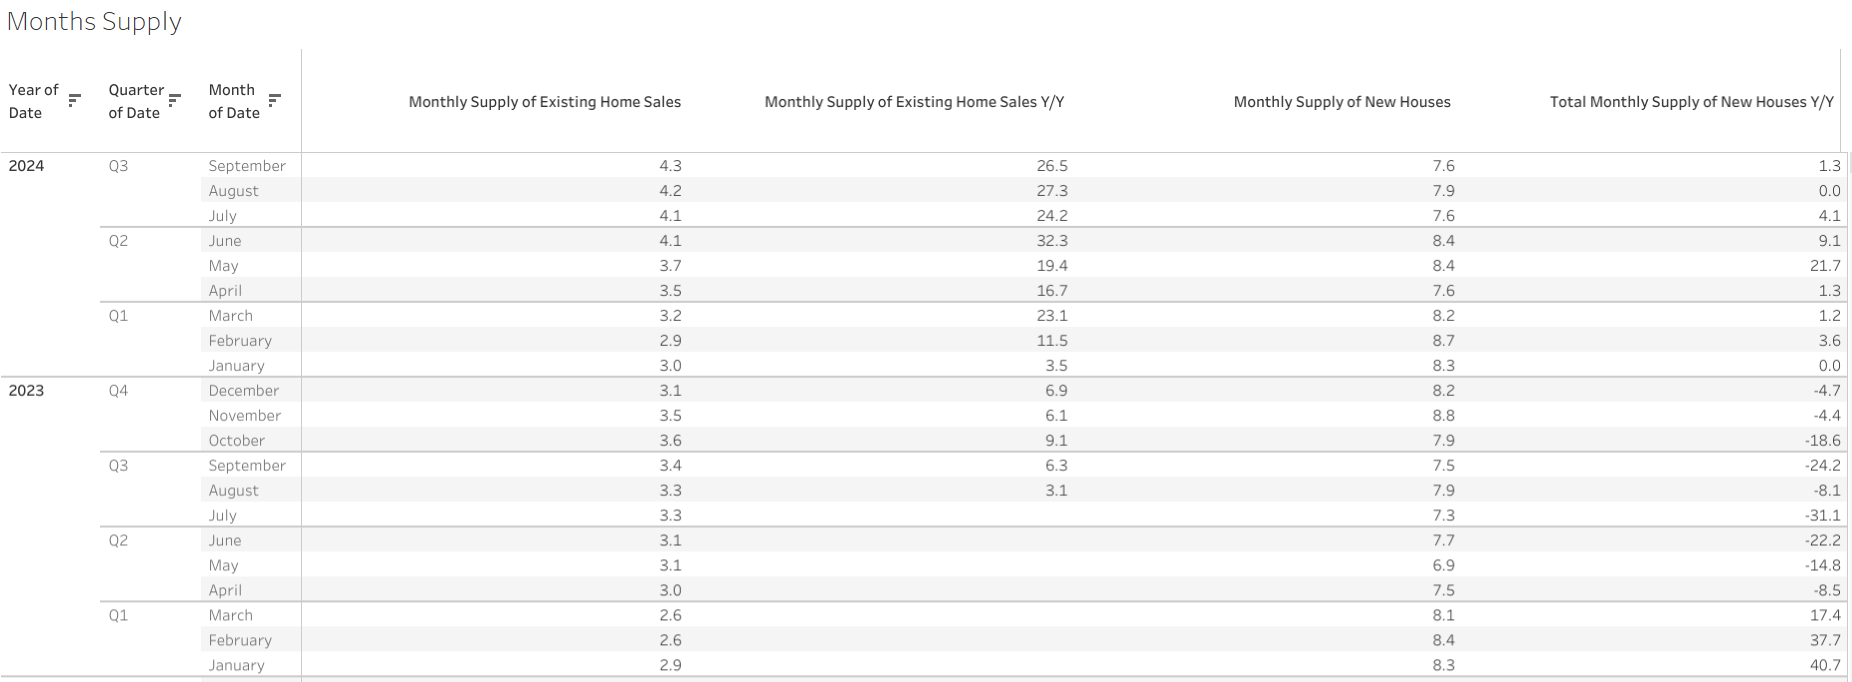
To provide context, a balanced housing market typically has a months’ supply (available inventory divided by monthly sales pace) of around 5-6 months. Currently, existing homes are nearing this balance but remain somewhat undersupplied, though inventory is rising swiftly. In contrast, new homes have already entered an oversupply phase.
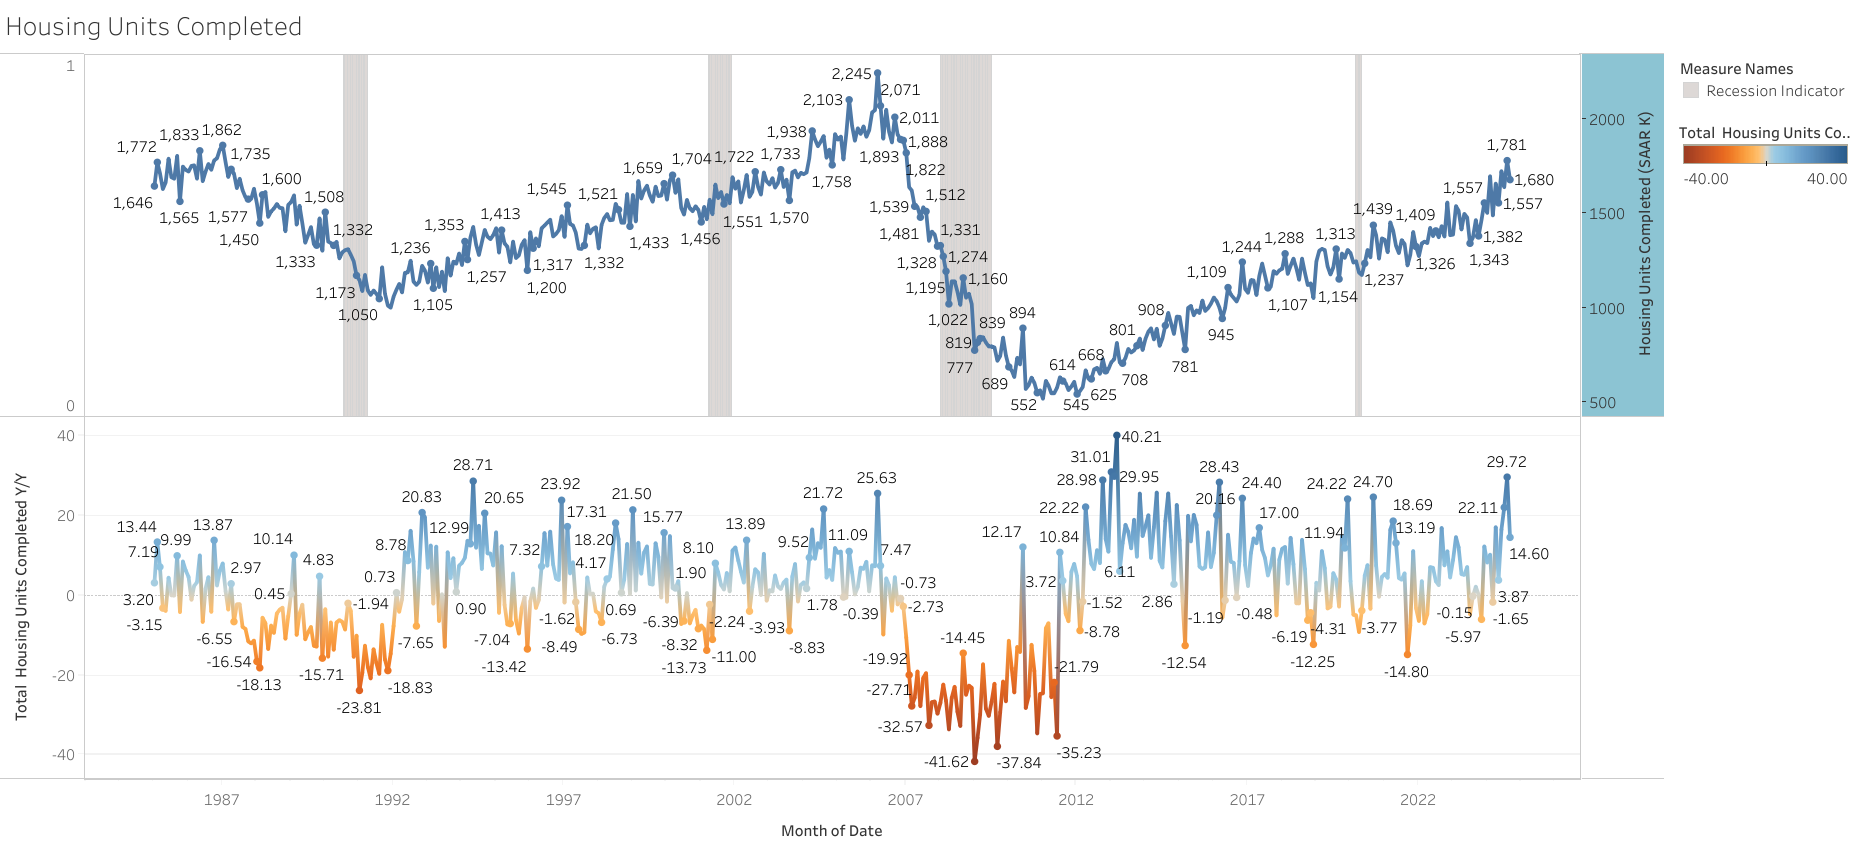
The current pace of housing starts is unable to keep up with the rate of housing completions.
Sources:
Tableau
Google Sheets