Aron
September 14, 2023, 1:16pm
1
This topic will be used to discuss PPI data releases and developments during the month that could give us indication about inflation trend.
See also: Consumer Price Index (CPI)
Magaly
October 11, 2023, 2:53pm
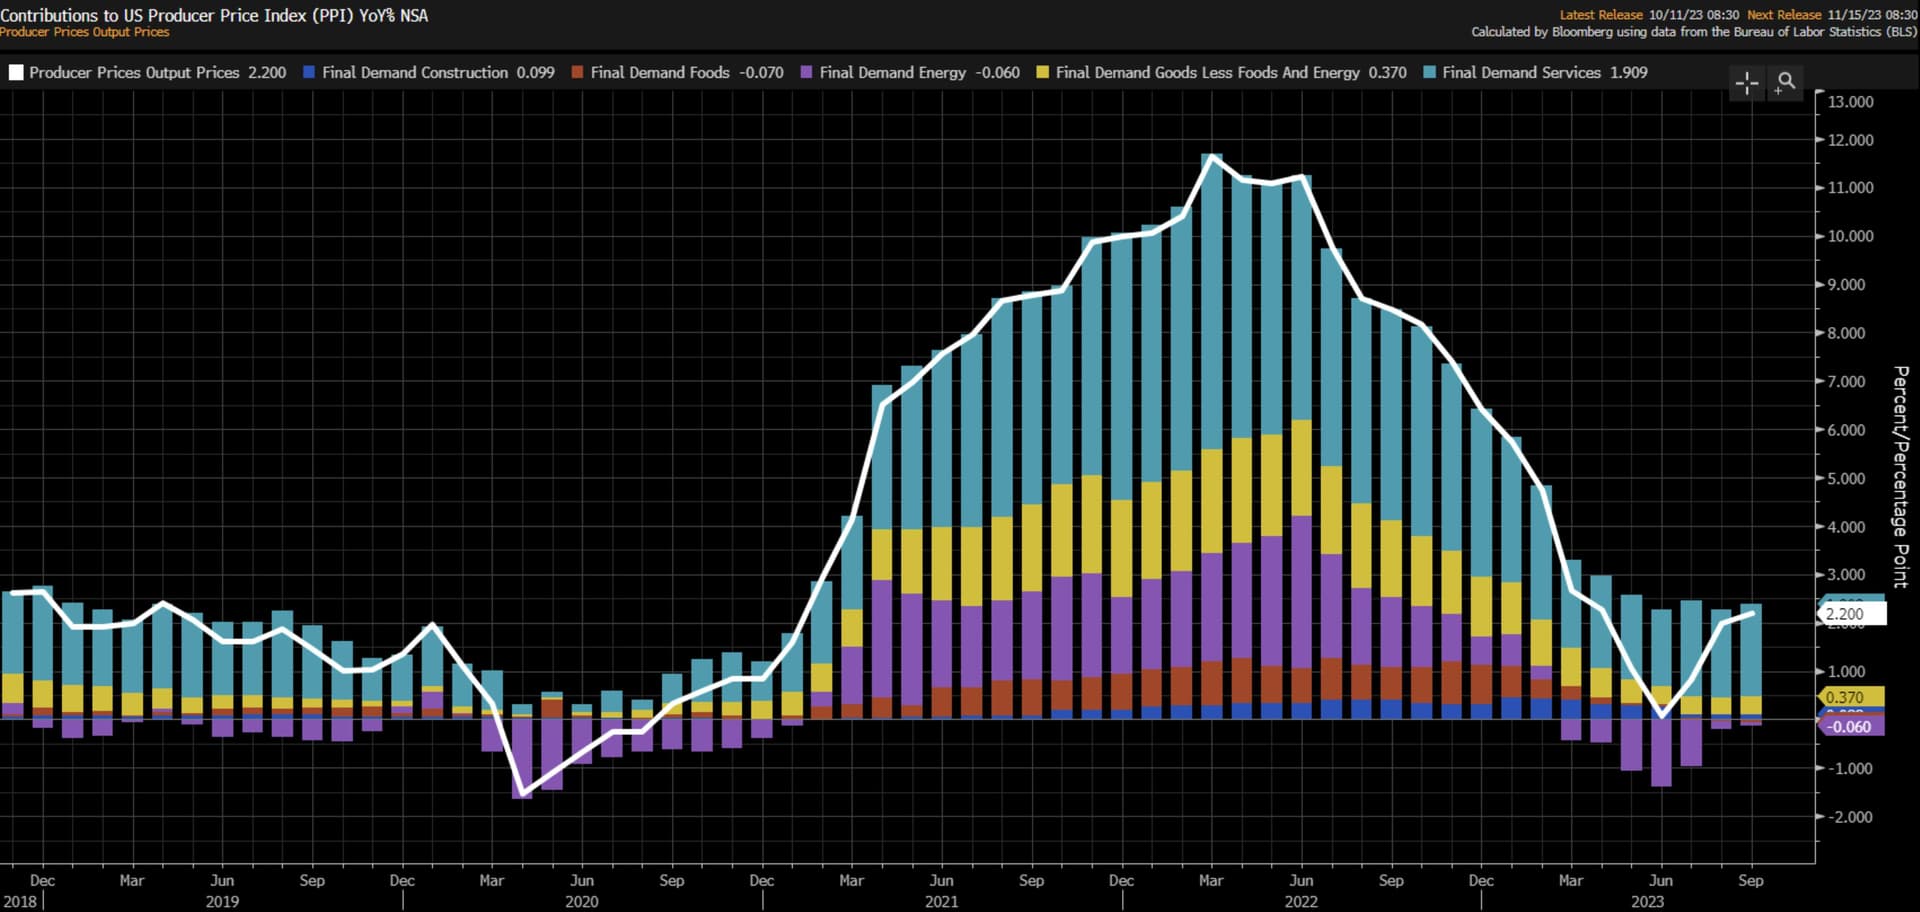
4
Big miss on this one, since PPI is supposed to be leading CPI, is honestly not that good
2 Likes
Aron
December 13, 2023, 2:19pm
6
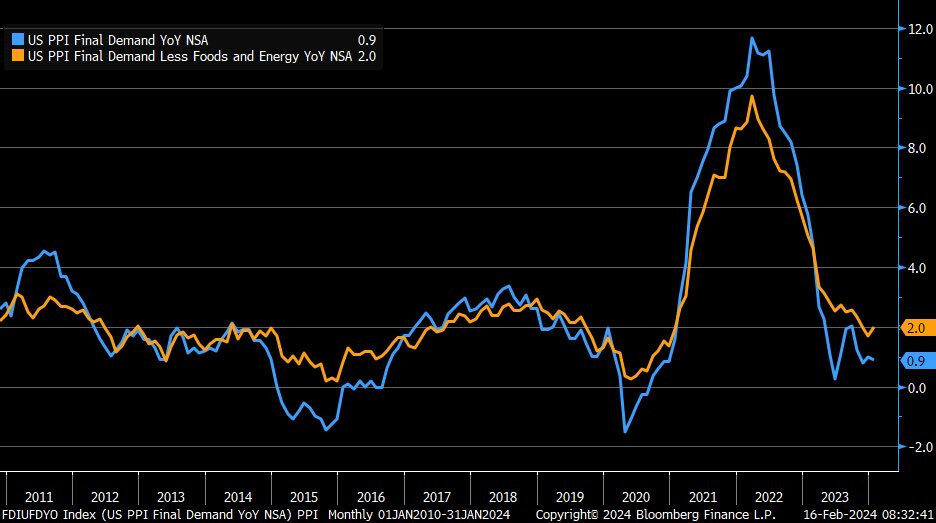
I=6
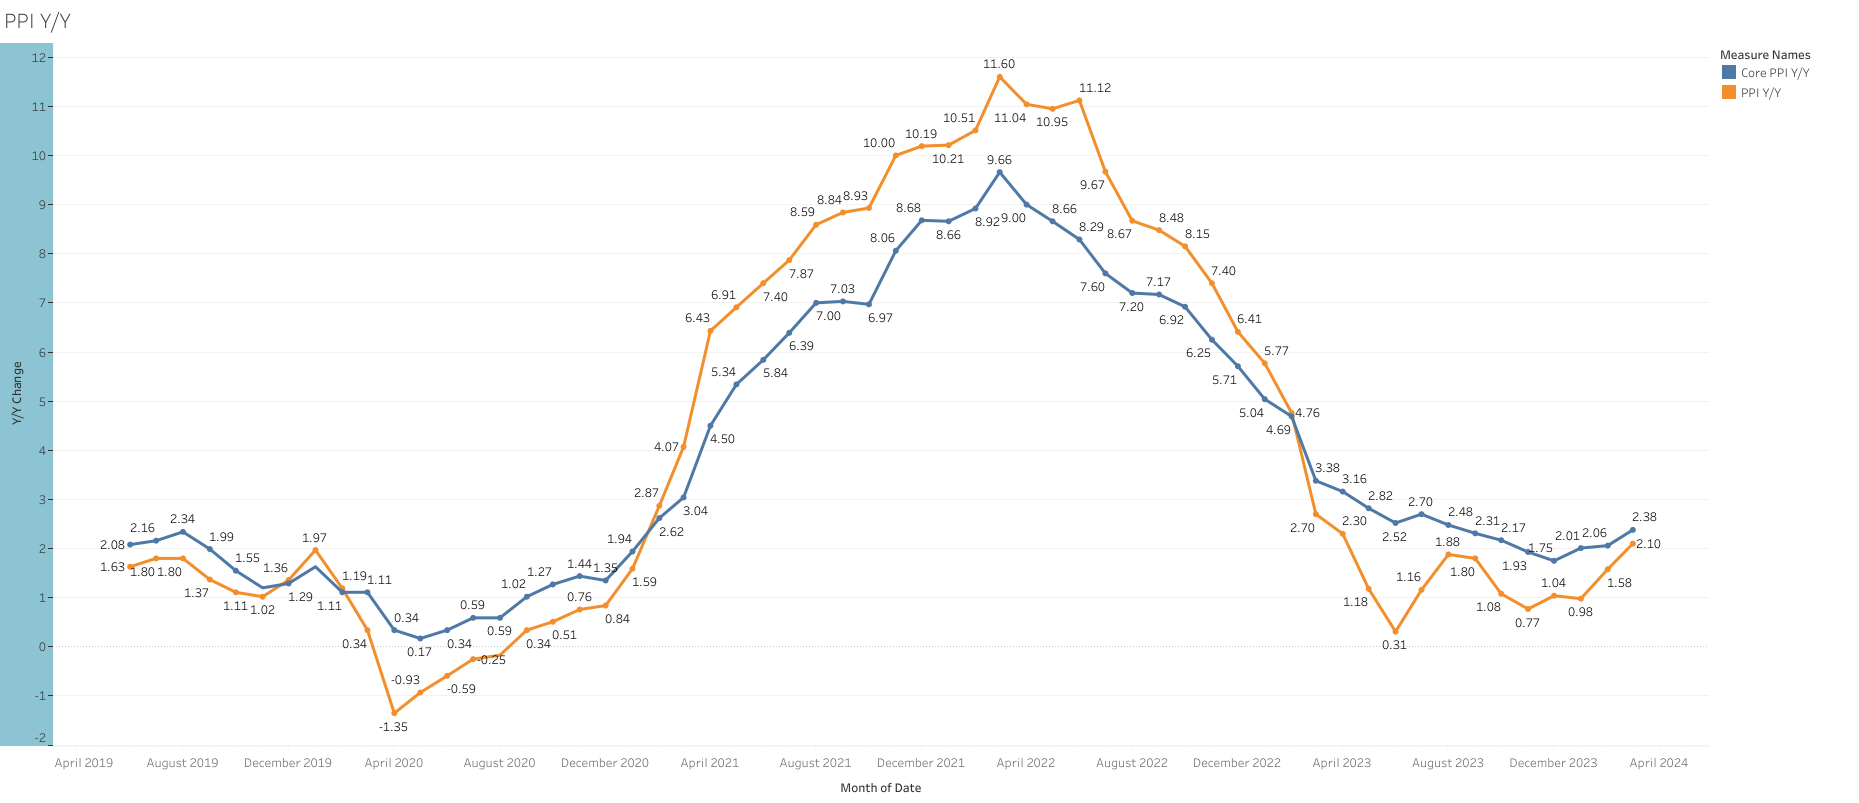
Producer Price Index (PPI) was flat in November as was expected .
On a yearly basis, PPI rose 0.9%, lower than 1.0% estimate and 1.2% in October (revised down from 1.3%).
Core PPI was also flat in November versus forecast for a 0.2% increase.
Yearly, core PPI rose 2%, lower than 2.2% estimate.
Services index was unchanged in November, the same as in October.
Energy prices fell 1.2% in November.
https://www.bls.gov/news.release/ppi.nr0.htm
1 Like
Magaly
January 12, 2024, 5:53pm
7
Soft report for PPI.
Producer Price Index (PPI) declined -0.1% m/m, 0.1% was expected
On a yearly basis, PPI rose 1%, lower than 1.3% estimate but higher than 0.8% in November (revised down from 0.9%).
Core PPI was also flat in November versus forecast for a 0.2% increase.
Yearly, core PPI rose 1.8%, lower than 1.9% estimate.
Services index was unchanged in December, the same as in November
Energy prices fell 1.2% in December
https://www.bls.gov/news.release/ppi.nr0.htm
PPI is usually not that important for the market, but after today’s miss print, the market is now giving a higher probability of 7 cuts in 2024.
2 Likes
Aron
February 16, 2024, 2:24pm
8
I=7
Producer price Index (PPI) rose 0.3% in January, exceeding expectations for a 0.1% increase.
On a yearly basis, PPI rose 0.9% above 0.6% estimate but lower than December’s 1%.
Core PPI grew 0.5%, above 0.1% estimate.
On a yearly basis, core PPI was up 2% higher than 1.6% estimate.
Services index rose 0.6%, the highest since July 2023.
Energy prices fell 1.7% in January.
S&P 500 futures fell 0.2% following the report while Dow Jones futures were down 0.4%. Nasdaq 100 futures were flat.
https://www.bls.gov/news.release/ppi.nr0.htm
2 Likes
Magaly
February 16, 2024, 3:40pm
9
All the January inflation numbers are kind of concerning tbh, if they continue on this path, I don’t see how the FED can even afford to cut rates anytime soon.
Yesterday, import prices also came in way above expectations 0.8% vs 0.0% expected.
Only PCE is missing, which at the same time is the one the FED focuses on the more.
2 Likes
Aron
March 14, 2024, 1:13pm
10
I=7
Producer price Index (PPI) rose 0.6% in February, exceeding expectations for a 0.3% increase.
On a yearly basis, PPI rose 1.6%, above 1.2% estimate.
Core PPI grew 0.3%, above 0.2% estimate.
On a yearly basis, core PPI was up 2% higher than 1.9% estimate.
Services index rose 0.3% versus 0.5% increase in January.
Energy prices rose 4.4% after a decline of 1.1% in January.
S&P 500 futures rose despite the inflation coming above estimates- S&P 500 and Nasdaq 100 futures gained 0.2% while Dow Jones futures were up 0.3%.
https://www.bls.gov/news.release/archives/ppi_03142024.pdf
2 Likes
Magaly
April 11, 2024, 4:11pm
11
PPI continues to be on an upside trend, 2.1% in March vs 1.6% in February, still in relatively low levels, but it could influence goods CPI which is still negative.
Producer price Index (PPI) rose 0.2% in March, below 0.3% expectations
On a yearly basis, PPI rose 2.1%, below 2.2% estimate.
Core PPI grew 0.2%, in line with 0.2% estimate.
On a yearly basis, core PPI was up 2.4% higher than the 2.3% estimate.
Services index rose 0.3% versus a 0.3% increase in January.
Energy prices decline -1.6% m/m after a 4.1%m/m increase in February.
https://www.bls.gov/news.release/ppi.nr0.htm
2 Likes
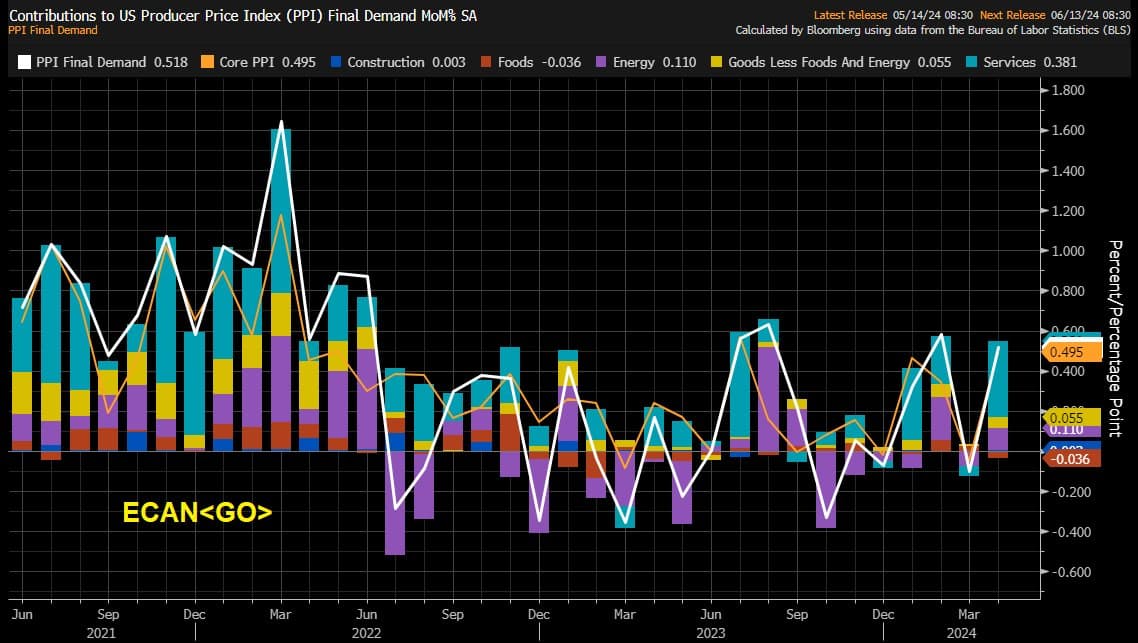
Aron
May 14, 2024, 12:37pm
12
I=7
Producer price index rose 0.5% in April, higher than 0.3% estimate and -0.1% in March (revised down from 0.2%).
Core PPI increased by 0.5%, also exceeding 0.2% estimate.
On a yearly basis, PPI rose 2.2% in-line with the estimate but above 1.8% in March (revised down from 2.1%).
Core PPI increased by 2.4% on a yearly basis, in-line with the estimate but higher than 2.1% in March (revised down from 2.4%).
Service inflation accounted for about three-quarters of the headline gain, rising by 0.6% in April-the biggest monthly gain since July 2023.
Energy index rose 2% in April after declining by 1.3% in March.
S&P 500 futures declined by 0.2% while Nasdaq 100 futures slipped by 0.4% following the report.
https://www.bls.gov/news.release/archives/ppi_05142024.pdf
1 Like
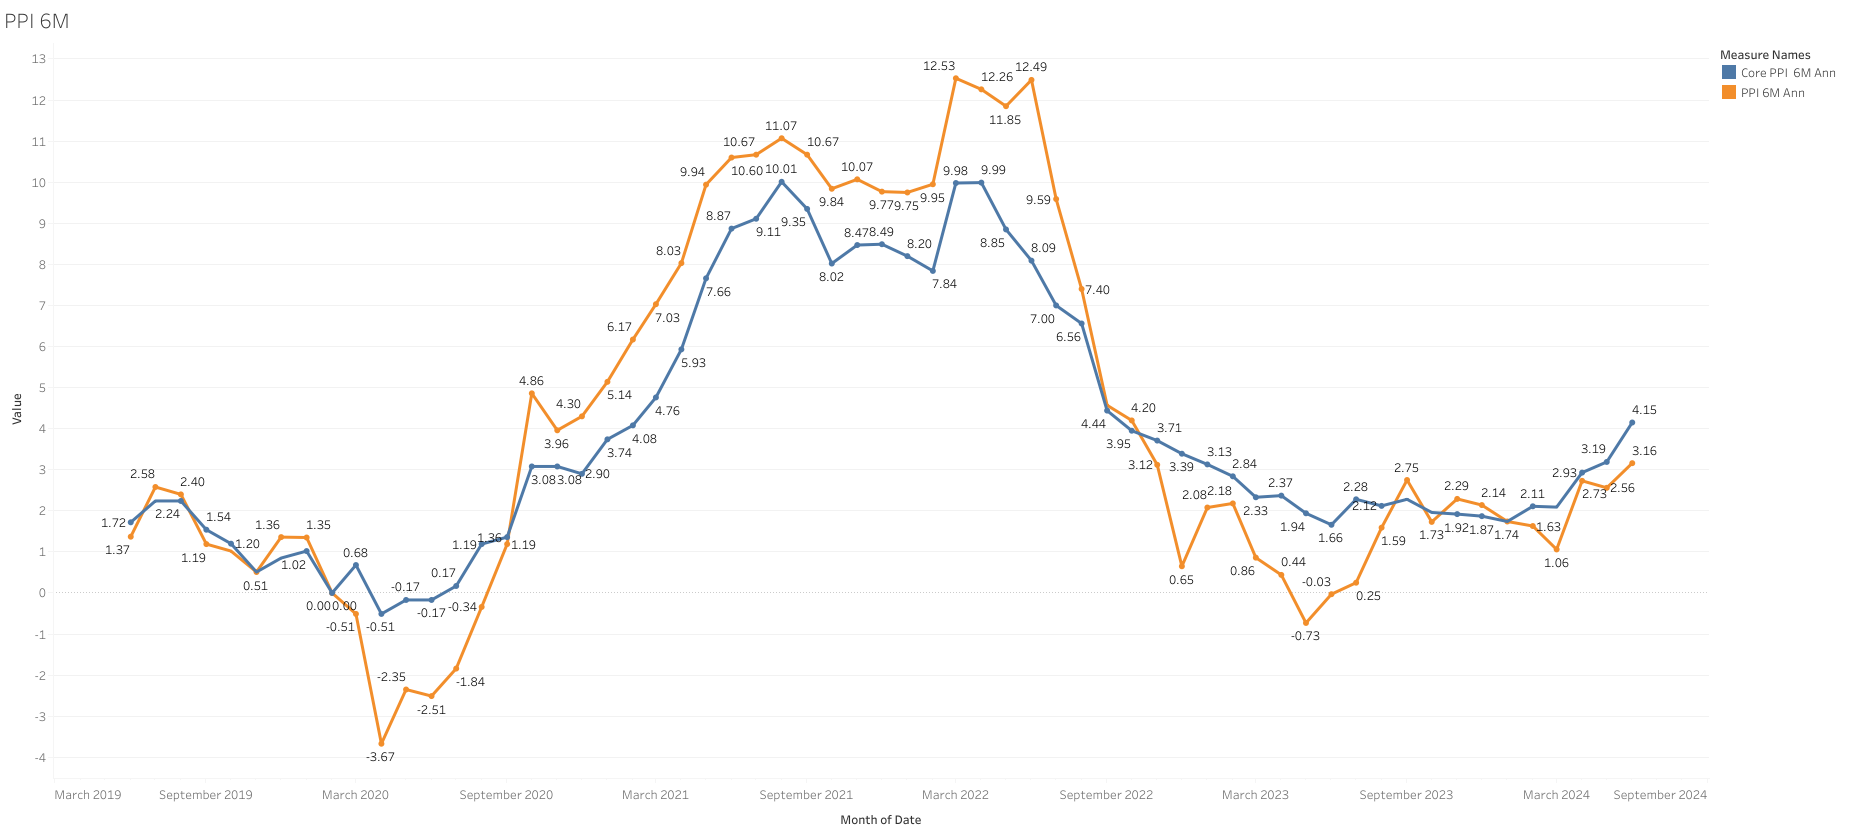
Magaly
May 14, 2024, 4:14pm
13
The hotter-than-expected prints are offset by the revisions down revisions to the prior month, which is probably why the markets barely reacted today to it.
Still, Y/Y and 6M annu data continue to move higher. Still relatively low, would not matter at all if CPI services were not that high still, since a lot of the help for inflation until now has been on goods inflation.
Contributions
1 Like
Aron
June 13, 2024, 1:02pm
14
I=7
Producer price index fell 0.2% in May versus growth of 0.5% in April and againstexpectations for a 0.1% increase.
On a yearly basis, PPI was up 2.2%, lower-than 2.5% estimate and growth of 2.3% in the previous month (revised up from 2.2%).
Core PPI was flat during the month (April:+0.5%) and up 2.3% on a yearly basis, both coming below expectations for a 0.3% and 2.5% increase.
The decline in PPI is mainly attributed to the 0.8% drop in the prices for final demand goods.
Around 60% decline in the price for final demand goods is attributed to a 7.1% drop in the prices for gasoline (April:+5%).
S&P 500 futures were up 0.2%, Nasdaq 100 futures gained 0.7% while Dow Jones futures were down 0.2% following the report.
https://www.bls.gov/news.release/archives/ppi_06132024.pdf
2 Likes
Magaly
July 12, 2024, 3:35pm
15
Based on PPI and CPI yesterday, there are now estimates of Core PCE to rise only by about 0.1%.
PPI 0.2% MoM, Exp. 0.1% vs -0.03% in May
PPI 2.6% YoY, Exp. 2.4% vs 2.3% in May
PPI Core 0.4% MoM, Exp. 0.2% vs 0.3% in May
PPI Core 3.0% YoY, Exp. 2.5% vs 2.6% in May
Prices for final demand services rose 0.6 percent in June after moving up
Prices for final demand goods moved down 0.5 percent in June after falling
PPI was disappointing but is always highly volatile. The Y/Y and 6M trend have been slowly increasing.
https://www.bls.gov/news.release/ppi.nr0.htm
1 Like
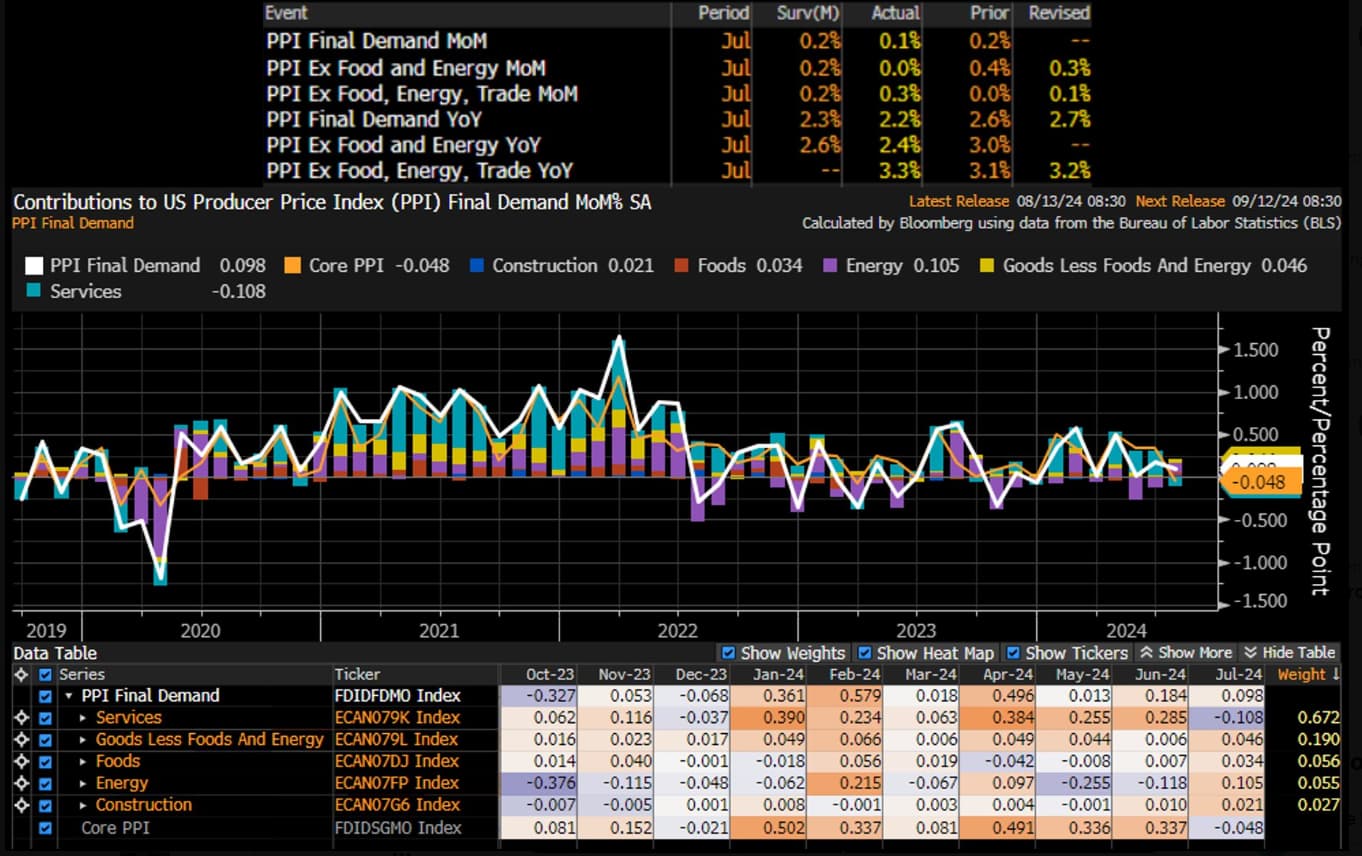
Aron
August 13, 2024, 12:44pm
16
I=7
Core PPI was flat during the month, down from 0.3% in June (revised downwards from 0.4%) and against expectations for a 0.2% increase.
On a yearly basis, core PPI rose 2.4%, lower-than 3% in June and 2.7% estimate .
Producer price index (PPI) rose 0.1% in July versus expectations to stay flat at 0.2%.
On a yearly basis, PPI was up 2.2%, down from 2.7% in June (revised upwards from 2.6%) and below 2.3% estimate .
S&P 500 futures rose 0.6%, Nasdaq 100 futures gained 0.9% while Dow Jones futures added 0.3% following the report.
https://www.bls.gov/news.release/archives/ppi_08132024.pdf
2 Likes
Aron
September 12, 2024, 1:07pm
17
I=6August headline PPI came in less than expected, Core PPI was slightly hotter than estimate
Core PPI rose 0.3% in August, above 0.2% estimate and compared to -0.2% in July (revised downwards from 0.0%).
On a yearly basis, core PPI rose 2.4%, lower than 2.5% estimate and compared to 2.3% in July (revised downwards from 2.4%).
Headline PPI was up 0.2% on the month, above 0.1% estimate and compared to flat growth in July (revised downwards from 0.1%).
Year over year, headline PPI increased by 1.7%, below 1.8% estimate and compared to 2.1% in the previous month (revised downwards from 2.2%).
https://www.bls.gov/news.release/archives/ppi_09122024.pdf
1 Like
Aron
October 11, 2024, 1:35pm
18
I=6Headline PPI was flat in September and core PPI rose by 0.2%, both below expectations and down from August
Core PPI rose 0.2% in September, in line with the forecast but down from 0.3% in August.
On an annual basis, core PPI was up 2.8%, above 2.7% estimate and up from 2.6% in August (revised upwards from 2.4%).
Headline PPI was flat in September, against expectations for a 0.1% increase and down from 0.2% in August.
On a yearly basis, PPI was up 1.8%, exceeding 1.6% estimate and down from 1.9% in August (revised up from 1.7%).
https://www.bls.gov/news.release/archives/ppi_10112024.pdf
2 Likes
Aron
November 14, 2024, 1:50pm
19
I=6Core PPI and headline PPI met expectations in September but exceeded estimates on a yearly basis
Core PPI rose 0.3% in October, in-line with the forecast but up from 0.2% in September.
On a yearly basis, core PPI was up 3.1%, above 3.0% estimate and 2.9% in September (revised upwards from 2.8%).
Headline PPI grew 0.2% in October, in-line with the estimate but up from 0.1% in September (revised upwards from 0.0%).
On a yearly basis, headline PPI rose 2.4%, exceeding 2.3% estimate and 1.9% in September (revised upwards from 1.8%).
https://www.bls.gov/news.release/archives/ppi_11142024.pdf
1 Like
Aron
December 12, 2024, 2:09pm
20
I=6Headline PPI rose 0.4% in November, exceeding 0.2% estimate
Core PPI rose 0.2% in November, down from 0.3% in October but in line with the forecast .
On a yearly basis, core PPI grew 3.4%, unchanged from the previous month (revised upwards from 3.1%) but above the 3.2% estimate .
Headline PPI was up 0.4% on the month, exceeding 0.2% estimate and up from 0.3% in October (revised upwards from 0.2%).
Headline PPI rose 3.0% during the month, against expectations for it to remain unchanged at 2.6% (revised upwards from 2.4%).
S&P 500 futures shed 0.3% while Nasdaq 100 dropped 0.6% following the report.
https://www.bls.gov/news.release/archives/ppi_12122024.pdf
1 Like