Aron
January 14, 2025, 1:42pm
21
I=6Headline PPI rose 0.2% in December, less than 0.4% estimate
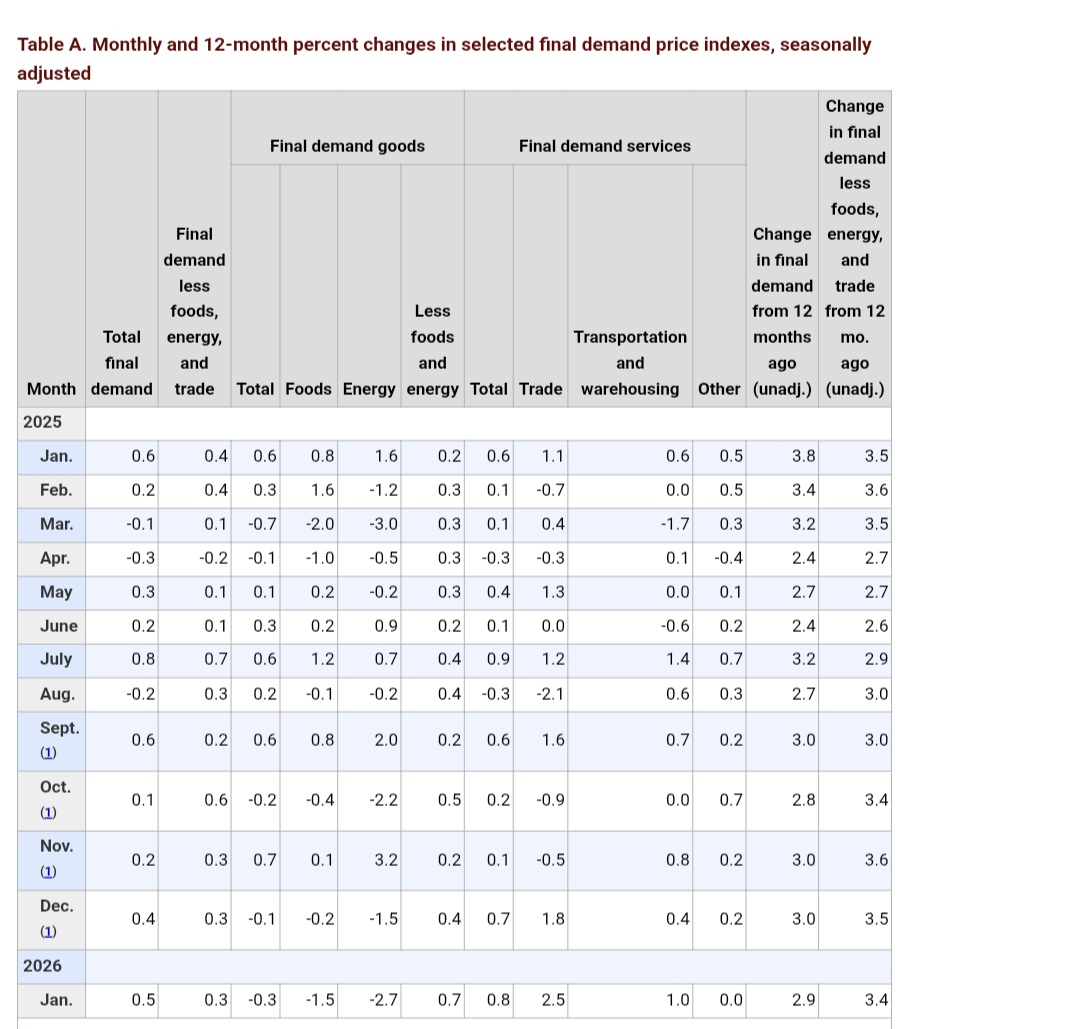
Core PPI was flat in December versus 0.3% forecast and 0.2% growth in November.
On a yearly basis, core PPI rose 3.5%, below 3.8% estimate and unchanged from the previous month (revised upwards from 3.4%).
Headline PPI rose 0.2% during the month versus expectations to stay unchanged at 0.4%.
On a yearly basis, PPI was up 3.3%, lower than 3.5% estimate but above 3.0% in November.
S&P 500 futures and Nasdaq 100 futures gained 0.5% each while Dow Jones futures rose 0.4% following the report.
https://www.bls.gov/news.release/archives/ppi_01142025.pdf
1 Like
Aron
February 13, 2025, 1:52pm
22
I=6Headline PPI rose 0.4% in January, higher than 0.3% estimate
Core PPI rose 0.3% in January, in line with the forecast and down from 0.4% in December (revised up from 0.0%).
On a yearly basis, core PPI was up 3.6%, below 3.3% forecast and down from 3.7% in December (revised up from 3.5%).
Headline PPI was up 0.4% on the month, higher than 0.3% estimate but down from 0.5% in December (revised up from
On a yearly basis, headline PPI rose 3.5%, above 3.2% estimate and unchanged from December (revised up from 3.3%).
PPI growth was driven by services as usual.
https://www.bls.gov/news.release/archives/ppi_02132025.pdf
Aron
March 13, 2025, 12:38pm
23
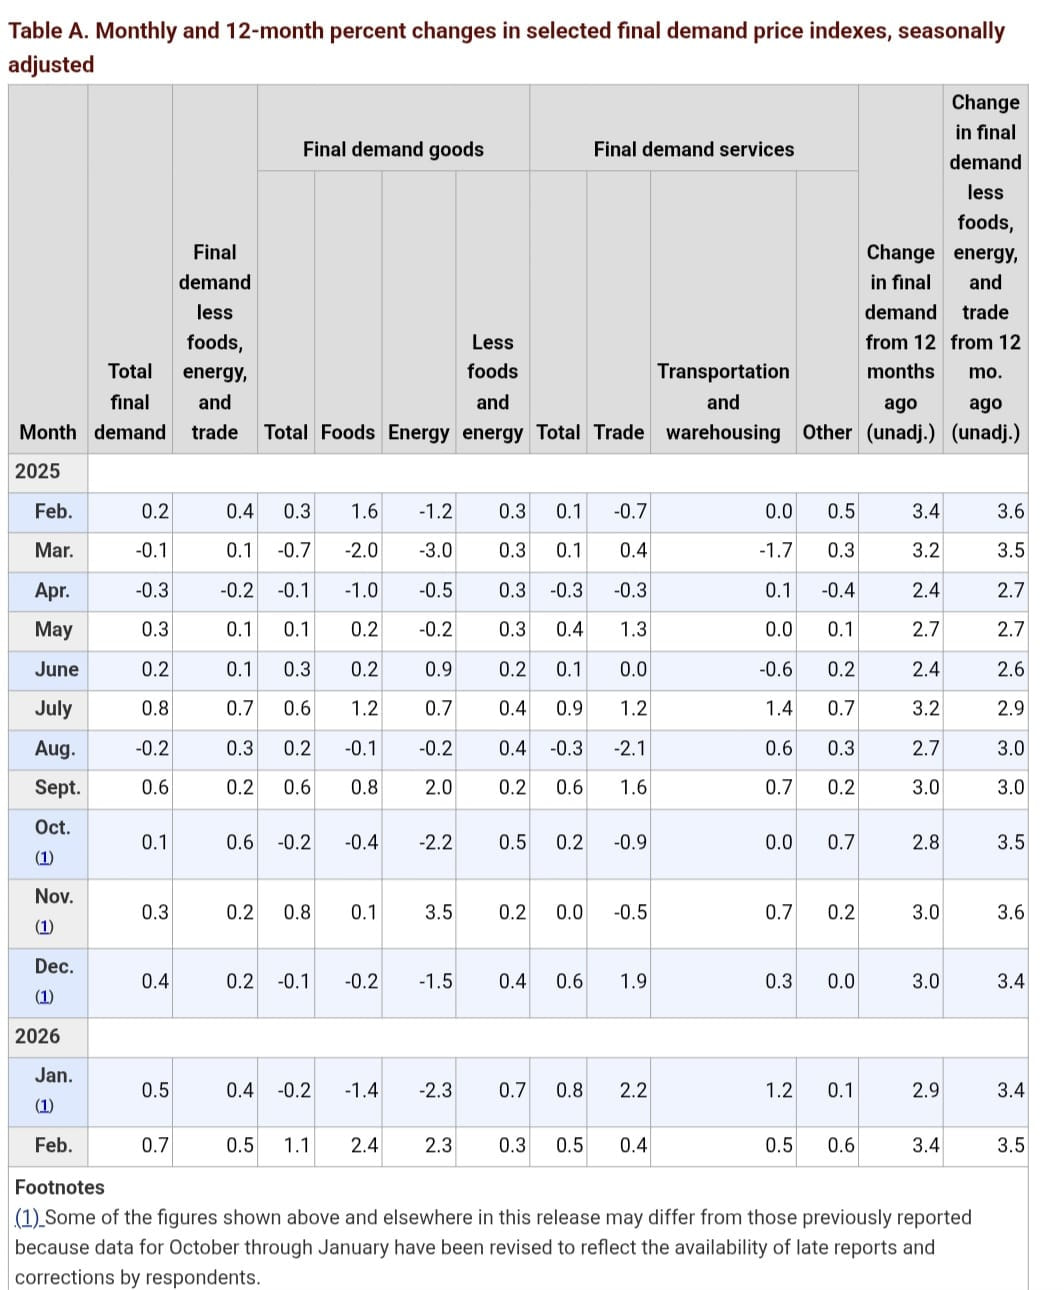
I=7Producer price index was flat in February, below 0.3% estimate
Headline PPI was flat during the month of February, below 0.3% forecast and down from 0.6% (revised upwards from 0.3%) in January.
Core PPI fell 0.1%, against expectations for a 0.3% increase and below 0.5% growth (revised upwards from 0.3%) in January.
On a yearly basis, headline PPI rose 3.2%, below 3.3% estimate and 3.7% growth (revised upwards from 3.5%) in January.
Core PPI was up 3.4% on a yearly basis, lower than 3.6% forecast and down from 3.8% in the previous month (revised upwards from 3.6%).
The flat growth was driven by a 0.2% drop in service costs which offsetted a 0.3% increase in goods.
https://www.bls.gov/news.release/archives/ppi_03132025.pdf
1 Like
Aron
August 14, 2025, 12:32pm
24
I=7S&P 500 futures sheds 0.4% after PPI rose 0.9% in July, exceeding 0.2% estimate
Headline PPI and core PPI rose 0.9% in July (highest reading in more than 3 years), above 0.2% estimate .
On a yearly basis, PPI was up 3.3%, above 2.5% estimate and 2.4% in June (revised upwards from 2.3%).
Core PPI rose 3.7% y/y, above 2.9% estimate and 2.6% in June.
S&P 500 and Nasdaq 100 future shed 0.4% following the report.
The increase was driven by service costs which rose 1.1%, the most since March 2022.
The report indicates that companies are starting to adjust prices to reflect the higher US tariffs.
https://www.bls.gov/news.release/archives/ppi_08142025.pdf
1 Like
Aron
September 10, 2025, 12:37pm
25
I=7
Headline and core PPI fell 0.1% in August against 0.3% forecast and below 0.7% growth in July (revised downwards from 0.9%).
On a yearly basis, headline PPI was up 2.6% y/y, below 3.3% forecast and 3.1% in July (revised downwards from 3.3%).
On a yearly basis, core PPI rose 2.8% y/y, below 3.5% forecast and 3.4% in July (revised downwards from 3.7%).
S&P 500 futures rose 0.5% while Nasdaq 100 futures gained 0.6% after the release.
The report suggests that companies are avoiding outsize price increases despite Trump’s tariffs.
Services prices fell 0.2%.
https://www.bls.gov/news.release/archives/ppi_09102025.pdf
1 Like
Aron
February 27, 2026, 6:02pm
26
I=8Stock futures shed 0.8%+ as producer price index comes above estimates
Core PPI rose 0.8% in January, above 0.3% estimate and 0.6% gain in December.
Headline PPI rose 0.5%, above 0.3% estimate and 0.4% gain in December.
Services prices was the main driver, rising 0.8% in January, the highest since July 2025.
S&P 500 and Nasdaq Composite are down 0.8% and 1.1%, respectively following the inflation report.
Alot of the things that feed into the PCE (fed’s preferred inflation gauge) were up such as portfolio management (+1.5%) and international air fares (+4.3%).
https://share.google/EDoQv48dVsVt5ERGJ
moritz
February 27, 2026, 9:49pm
27
What’s the main contributor(s) of why it’s up so strongly? Is this some normal monthly volatility or something that stands out?
You have accidentally linked the August release
Aron
February 27, 2026, 11:01pm
28
Most of the January increase can be traced to margins for trade services (category that measures profit margins for wholesalers and retailers), which rose 2.5%. Analysts think this could indicate tariffs are being passed through along the supply chain. However, this metric can be highly volatile on a monthly basis.
Aron
March 18, 2026, 3:10pm
29
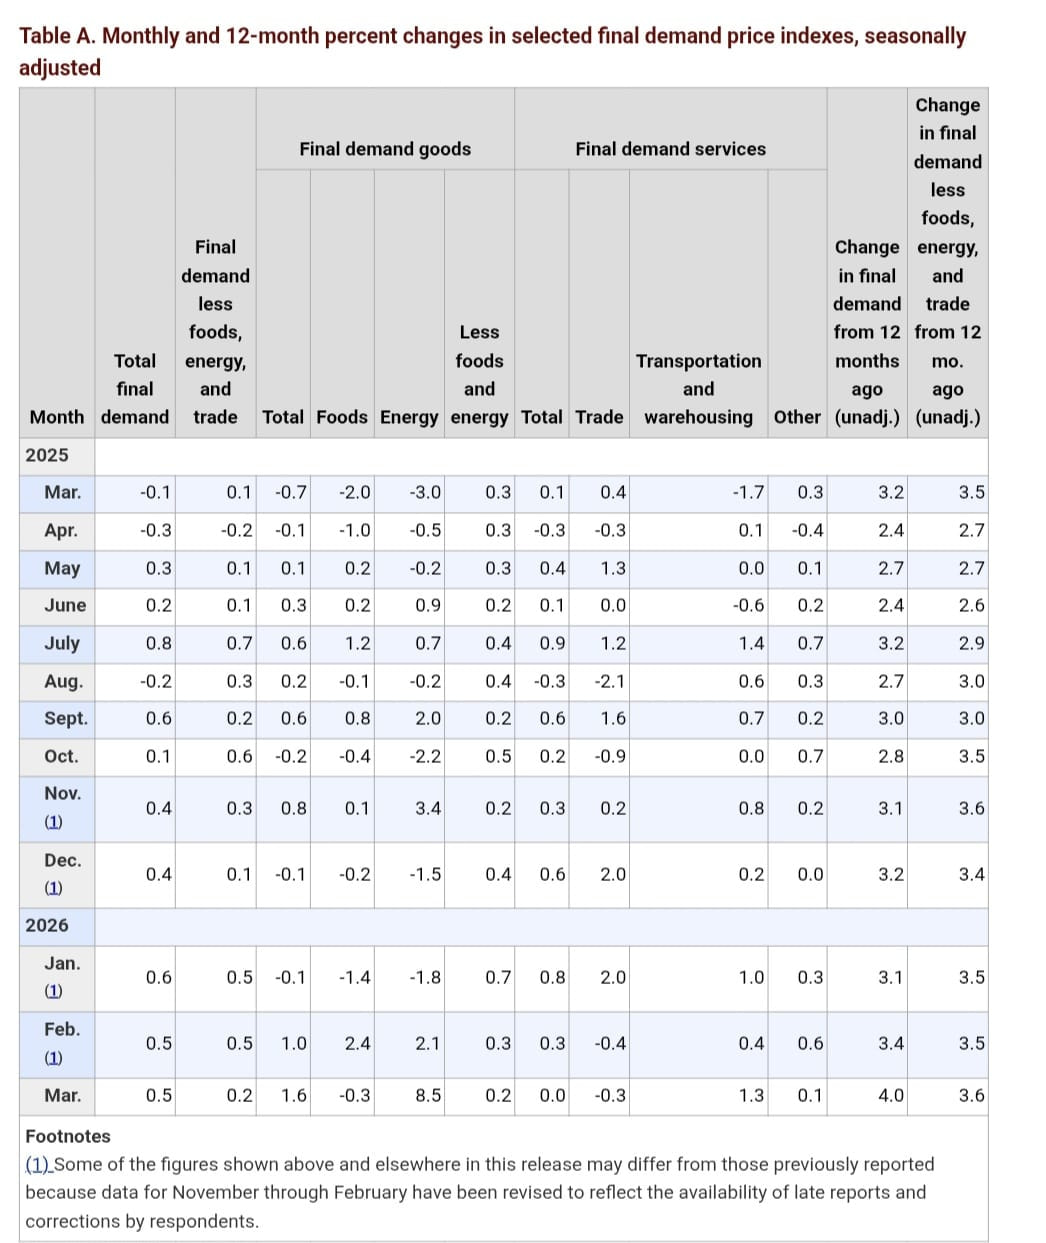
I=7Stock futures shed more than 0.4% as producer price index rose 0.7% in February, above 0.3% estimate
Producer price index rose 0.7% in February (before Iran conflict), above 0.3% estimate and 0.5% in January.
Core PPI rose 0.5% on the month, above 0.3% forecast but down from 0.8% in January.
On a yearly basis, PPI rose 3.4% whilre core PPI rose 3.9%, above 3.0% and 3.7% estimates respectively.
A 0.5% rise in services (versus +0.8% in January) accounted for more than half of the increase in the monthly PPI (lifted by 5.7% jump in wholesale prices of hotel and motel rooms).
Trade services costs, a proxy for profit margins (and used to track impact of tariffs), rose at a more moderate 0.4% in February versus +2.5% in January and 1.8% in December.
The report comes ahead of today’s Fed interest rate decision, where the fed is largely expected to keep interest rate unchanged in the range of 3.5%-3.75%.
https://www.bls.gov/news.release/ppi.nr0.htm
Aron
April 14, 2026, 12:58pm
30
I=6Producer price index rose 0.5% in March, below 1.1% estimate
Producer price index rose 0.5% in March, below 1.1% estimate - despite the impact of Iran conflict but driven by energy prices.
Core PPI rose 0.1%, below 0.5% estimate.
On a yearly basis, PPI rose 4%, below 4.6% forecast and the biggest gain since February 2023.
On a yearly basis, core PPI rose 3.8%, below 4.2% estimate and unchanged from the prior month.
https://www.bls.gov/news.release/ppi.nr0.htm
Aron
May 13, 2026, 12:55pm
31
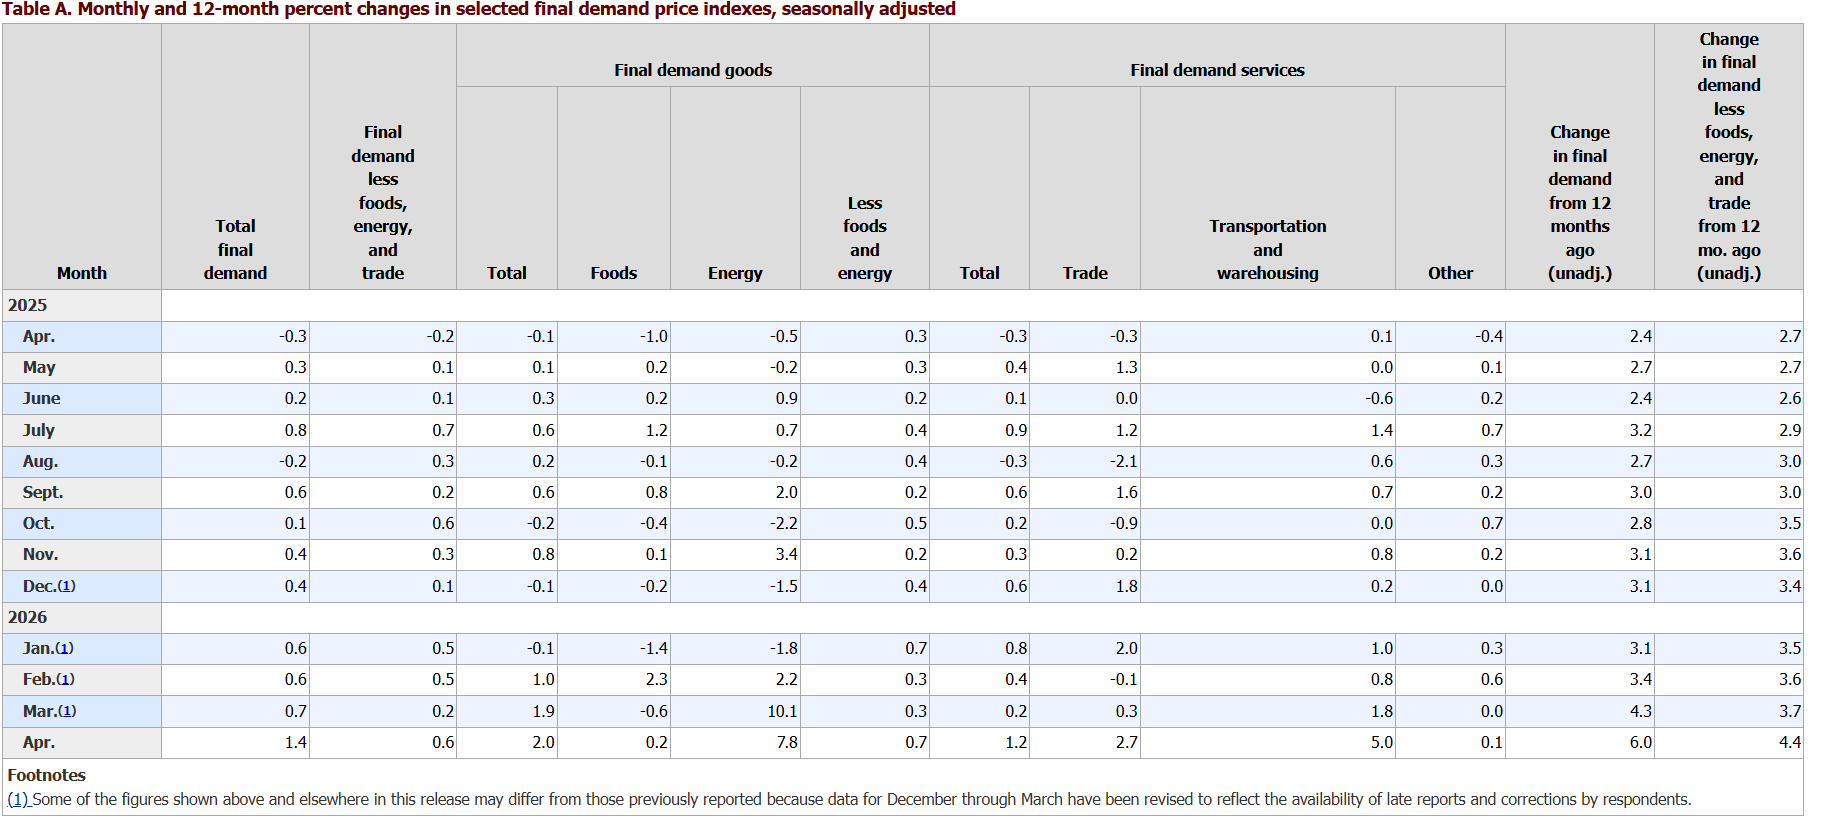
I=8Wholesale inflation rose 1.4% in April, above the 0.5% forecast, driven by higher energy prices
Producer price index (PPI) rose 1.4% in April, higher than 0.5% estimate and up from 0.7% in March (revised upwards from 0.5%).
On a yearly basis, PPI was up 6%, above 4.9% estimate and up from 4.3% in March (revised upwards from 4.0%).
Core PPI rose 1.0% on the month, higher than 0.3% forecast and compared to 0.2% in March (revised upwards from 0.1%).
On a yearly basis, core PPI rose 5.2%, above 4.3% estimate and up from 4.0% in March (revised upwards from 3.8%).
A 15.6% increase in gas prices accounted for 40% of the increase in PPI.
S&P 500 sheds 0.2% following the report.
https://www.bls.gov/news.release/ppi.nr0.htm
Aron
June 11, 2026, 12:43pm
32
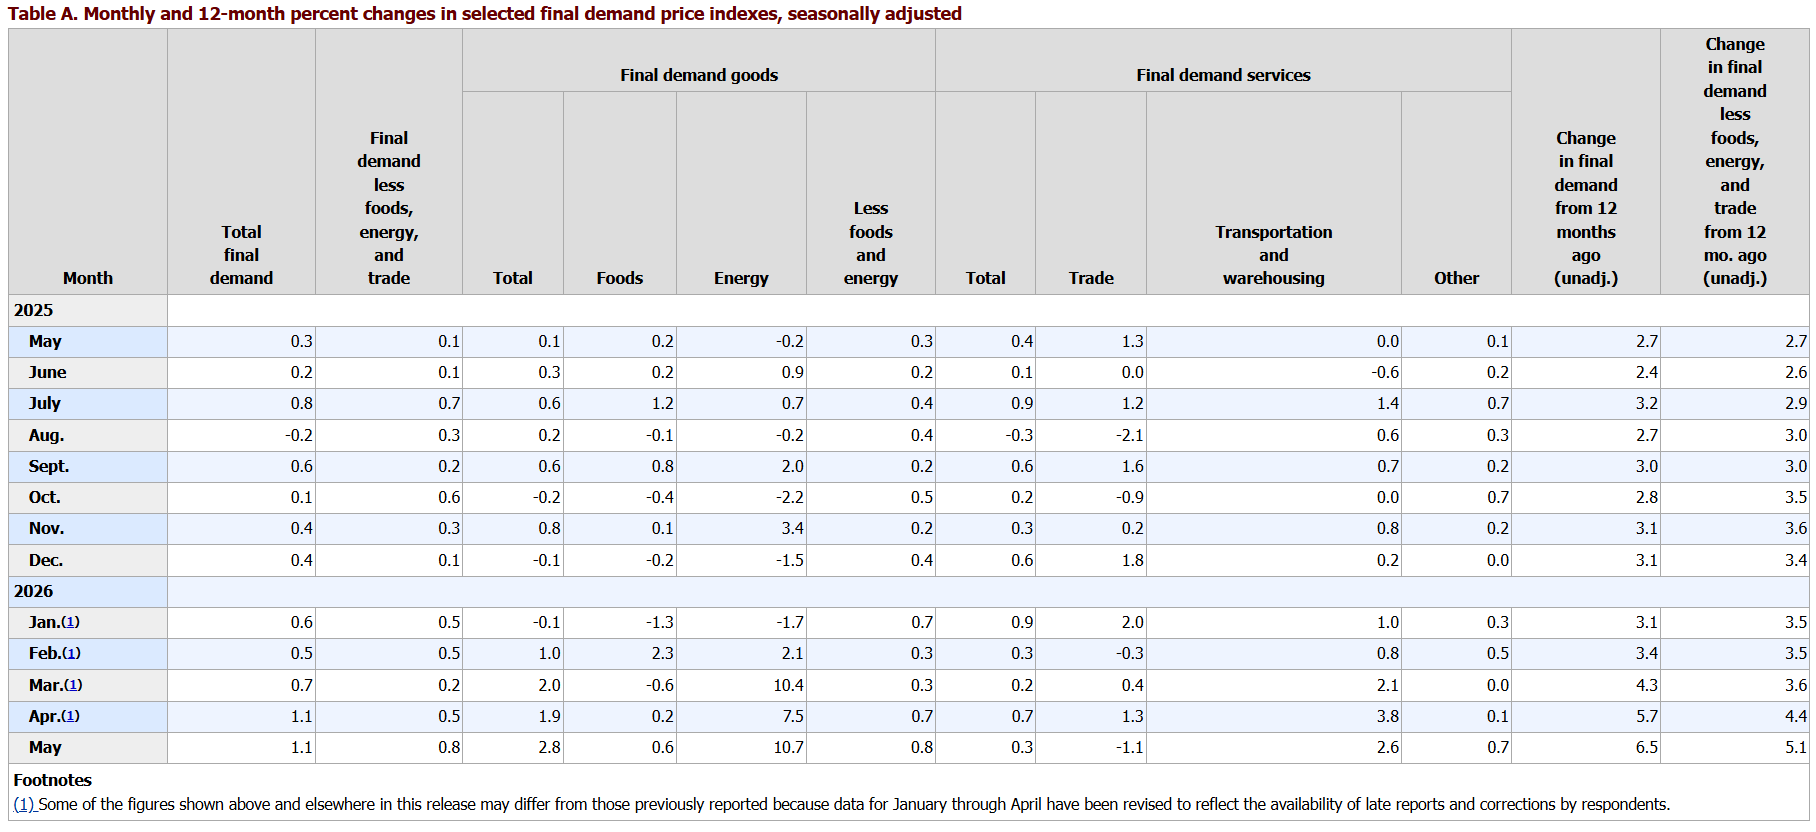
I=6Wholesale inflation rose 1.1% in May, above the 0.7% forecast, driven by higher energy prices but core PPI was below estimate
Producer price index (PPI) rose 1.1% in May, higher than 0.7% estimate and unchanged from the previous month (revised downwards from 1.4%).
On a yearly basis, PPI was up 6.5%, above 6.4% estimate and up from 5.7% in April (revised downwards from 6.0%).
Core PPI rose 0.4% on the month, lower than 0.5% forecast and compared to 0.7% in April(revised upwards from 1.0%).
On a yearly basis, core PPI was steady at 4.9%, below 5.4% forecast.
Much of the monthly increase in headline PPI was due to the 7.5% increase in energy prices.
https://www.bls.gov/news.release/ppi.nr0.htm