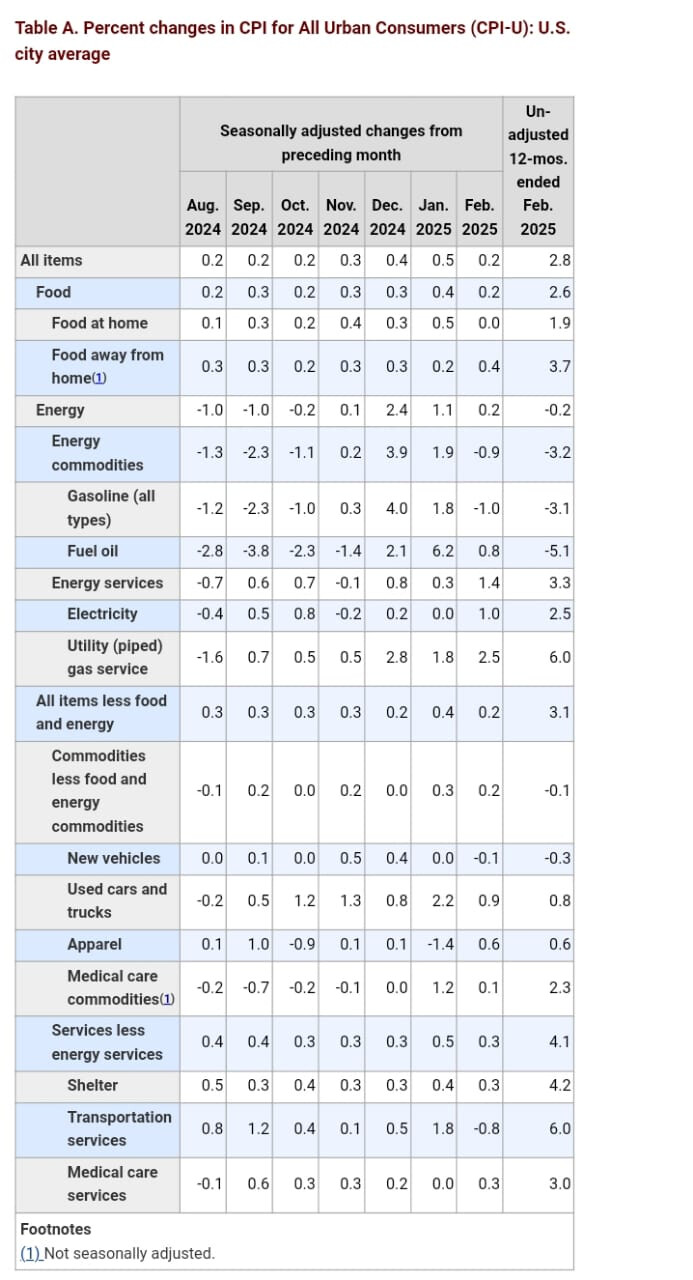
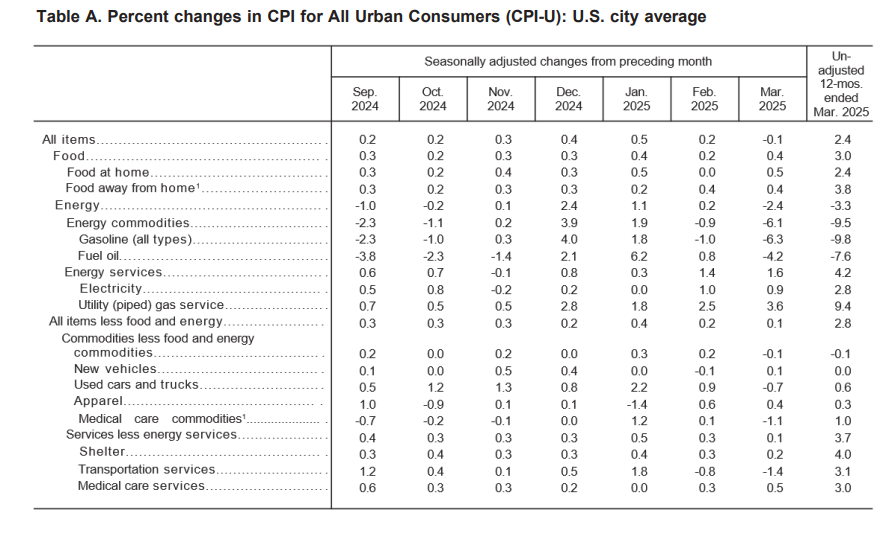
On a yearly basis, headline CPI was up 3.0% versus expectations to stay steady at 2.9%.
Dow futures lost and S&P 500 futures shed 1% while Nasdaq 100 futures declined by 1.1% following the report.
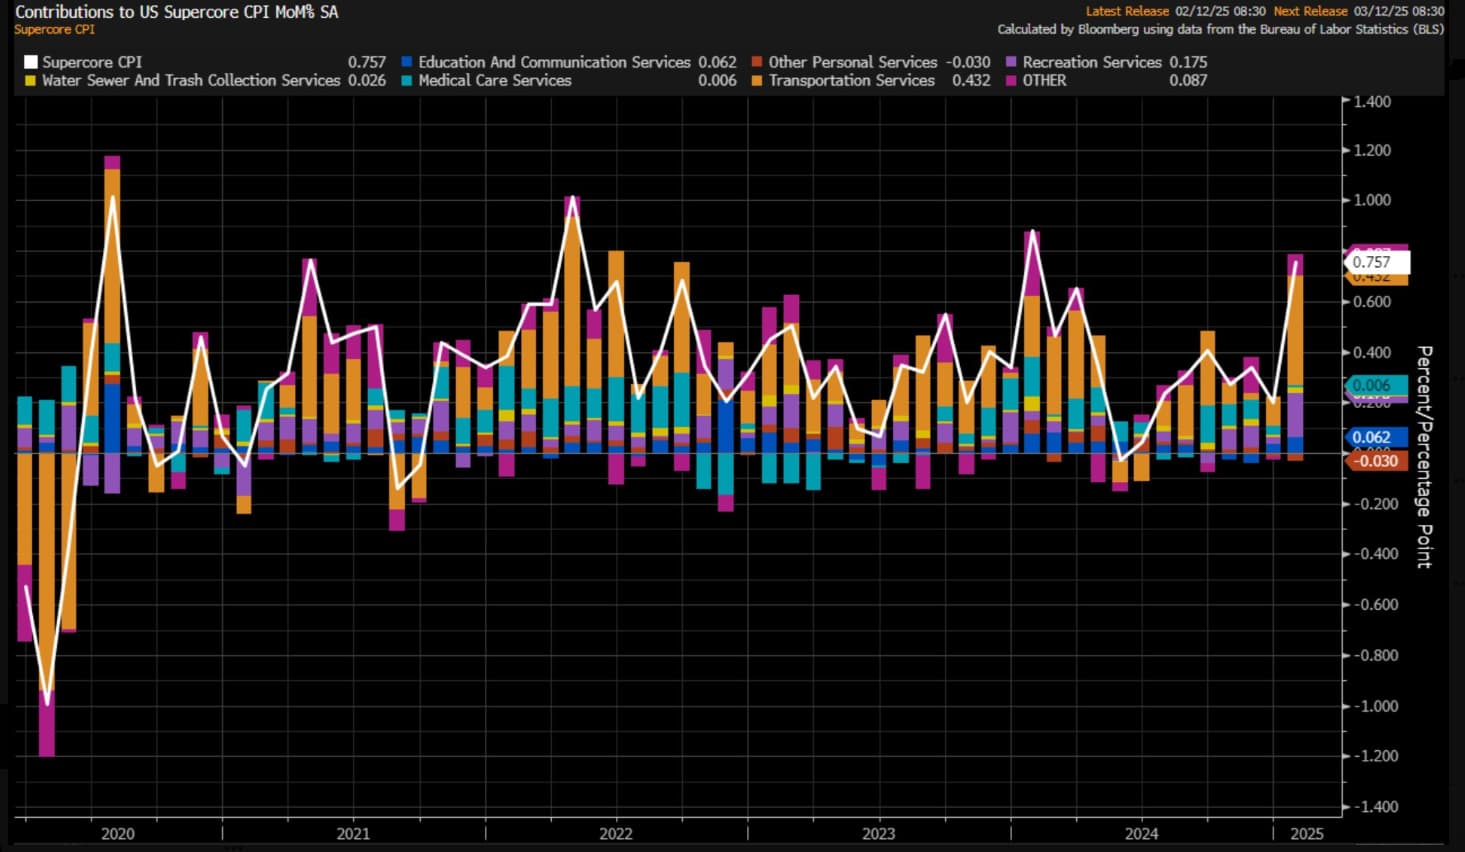
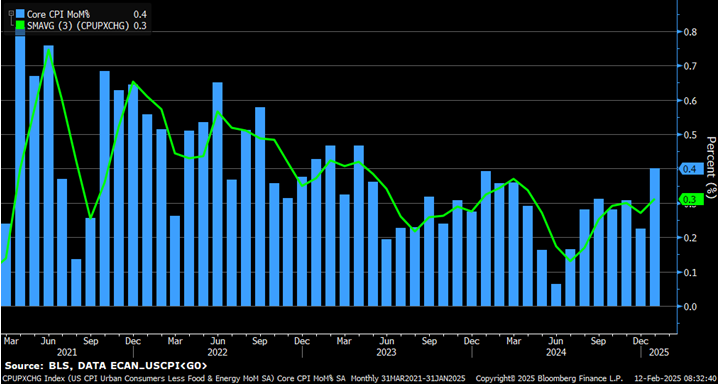
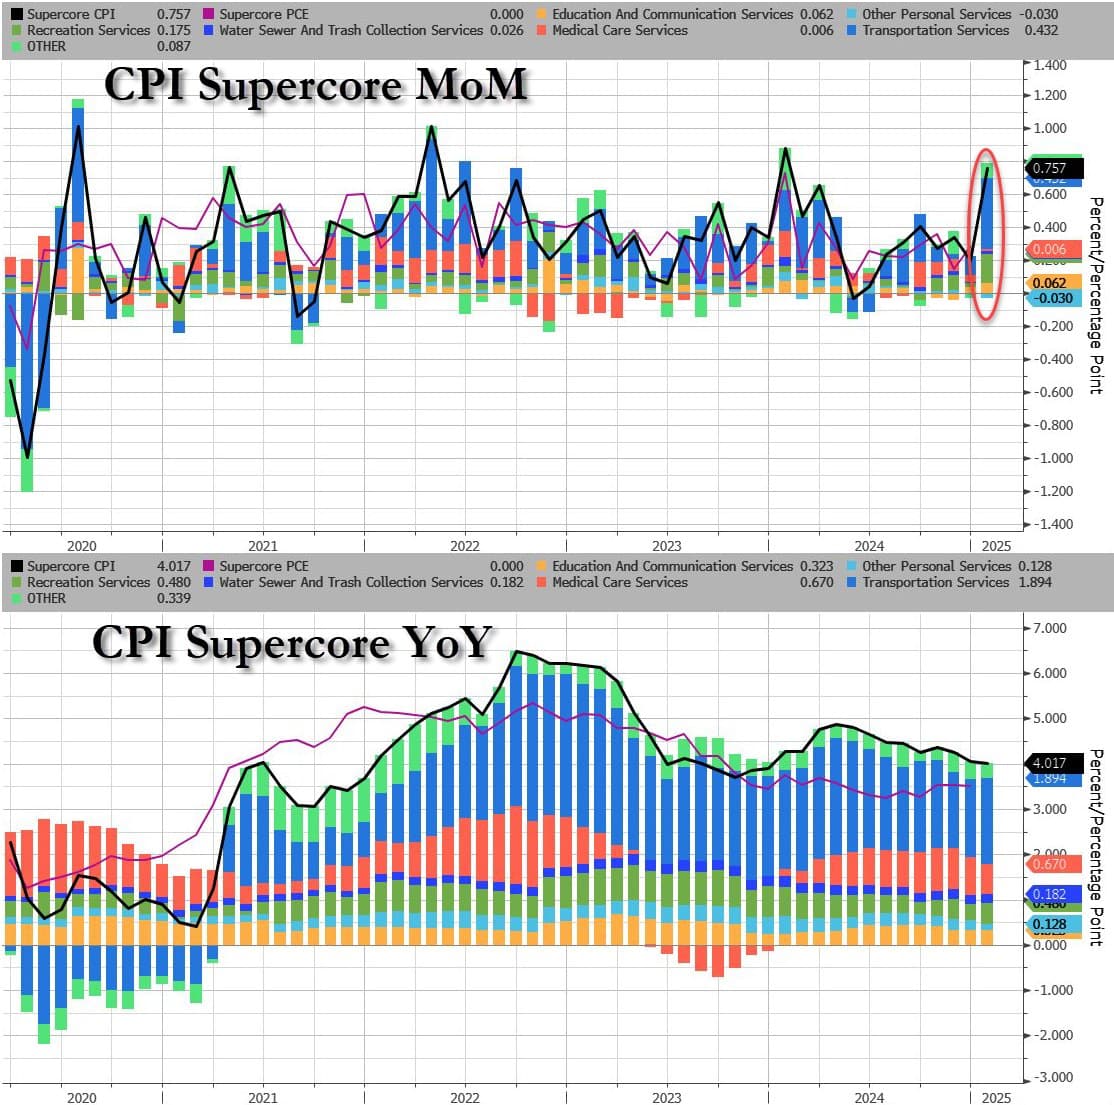
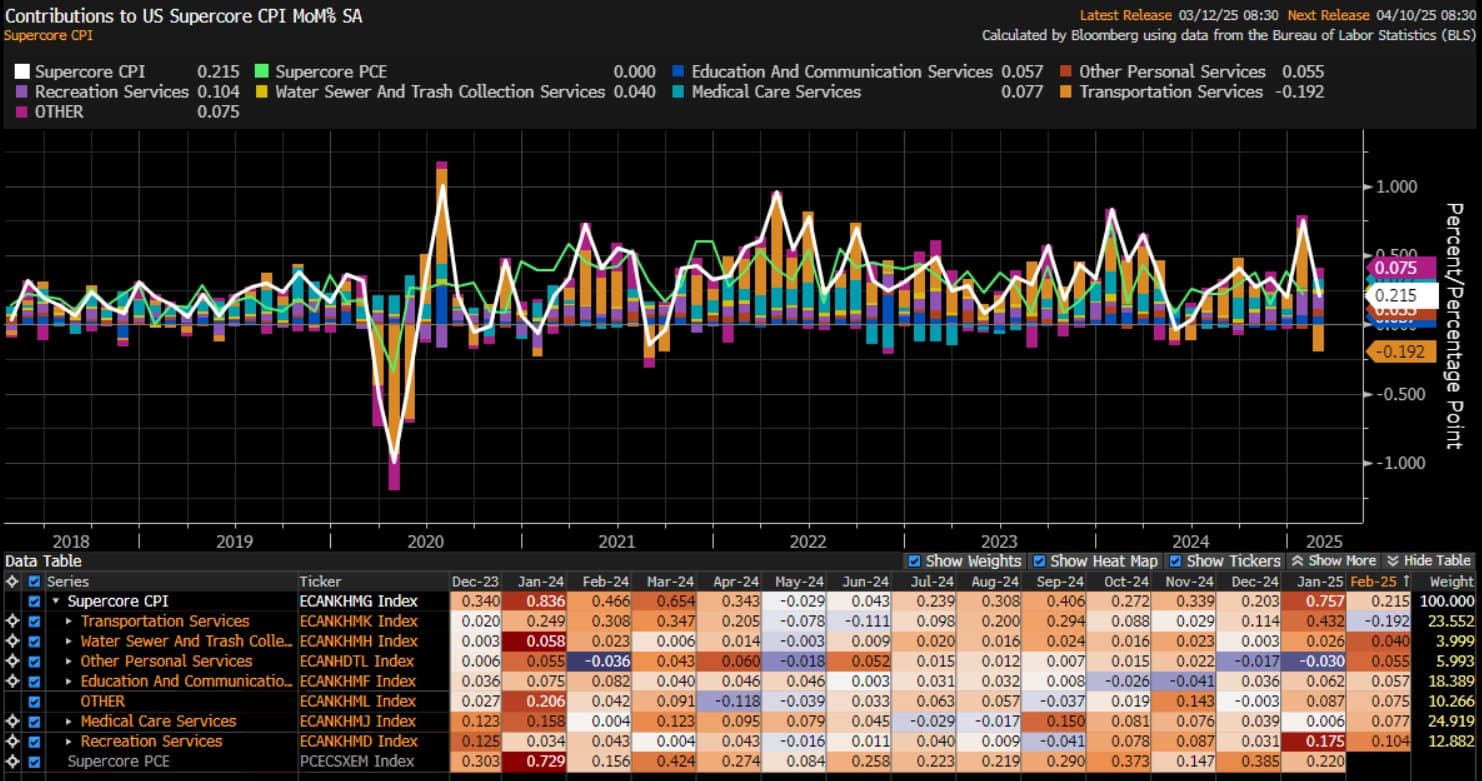
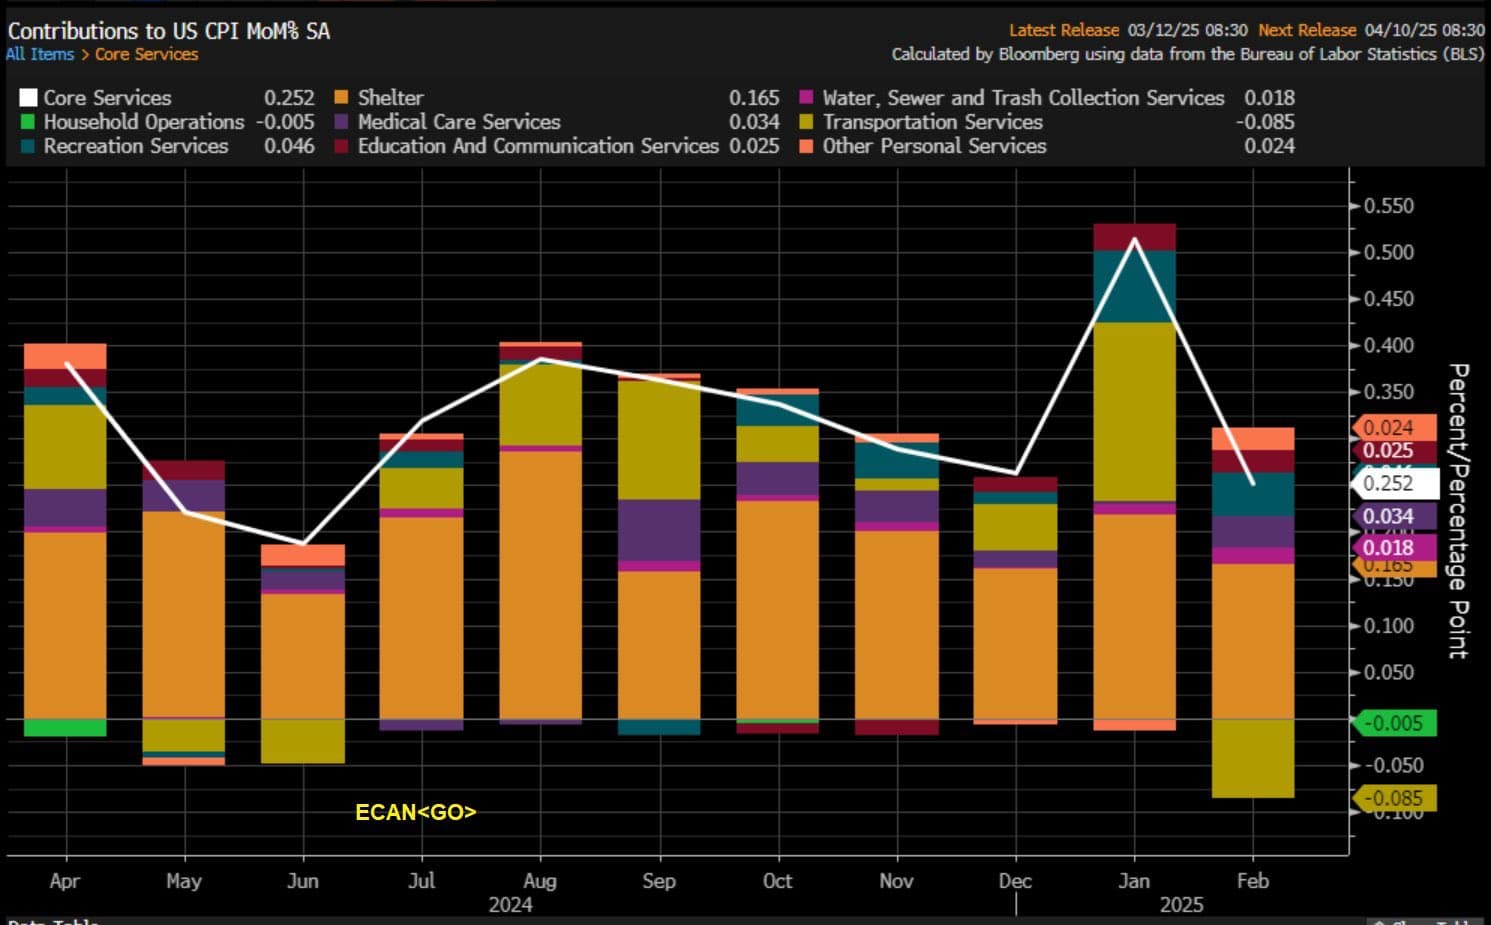
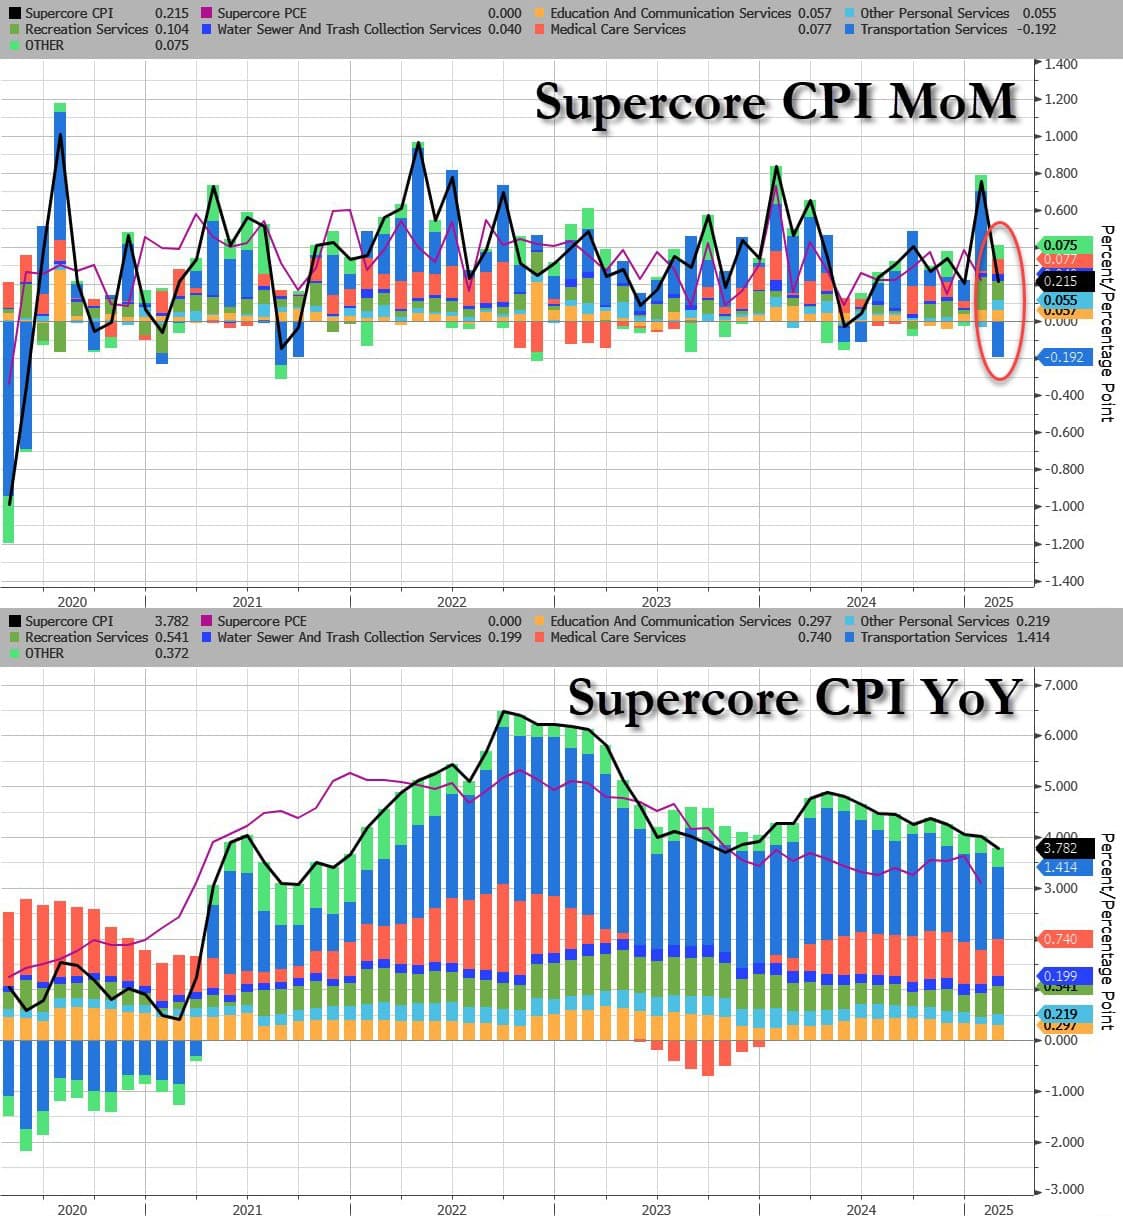
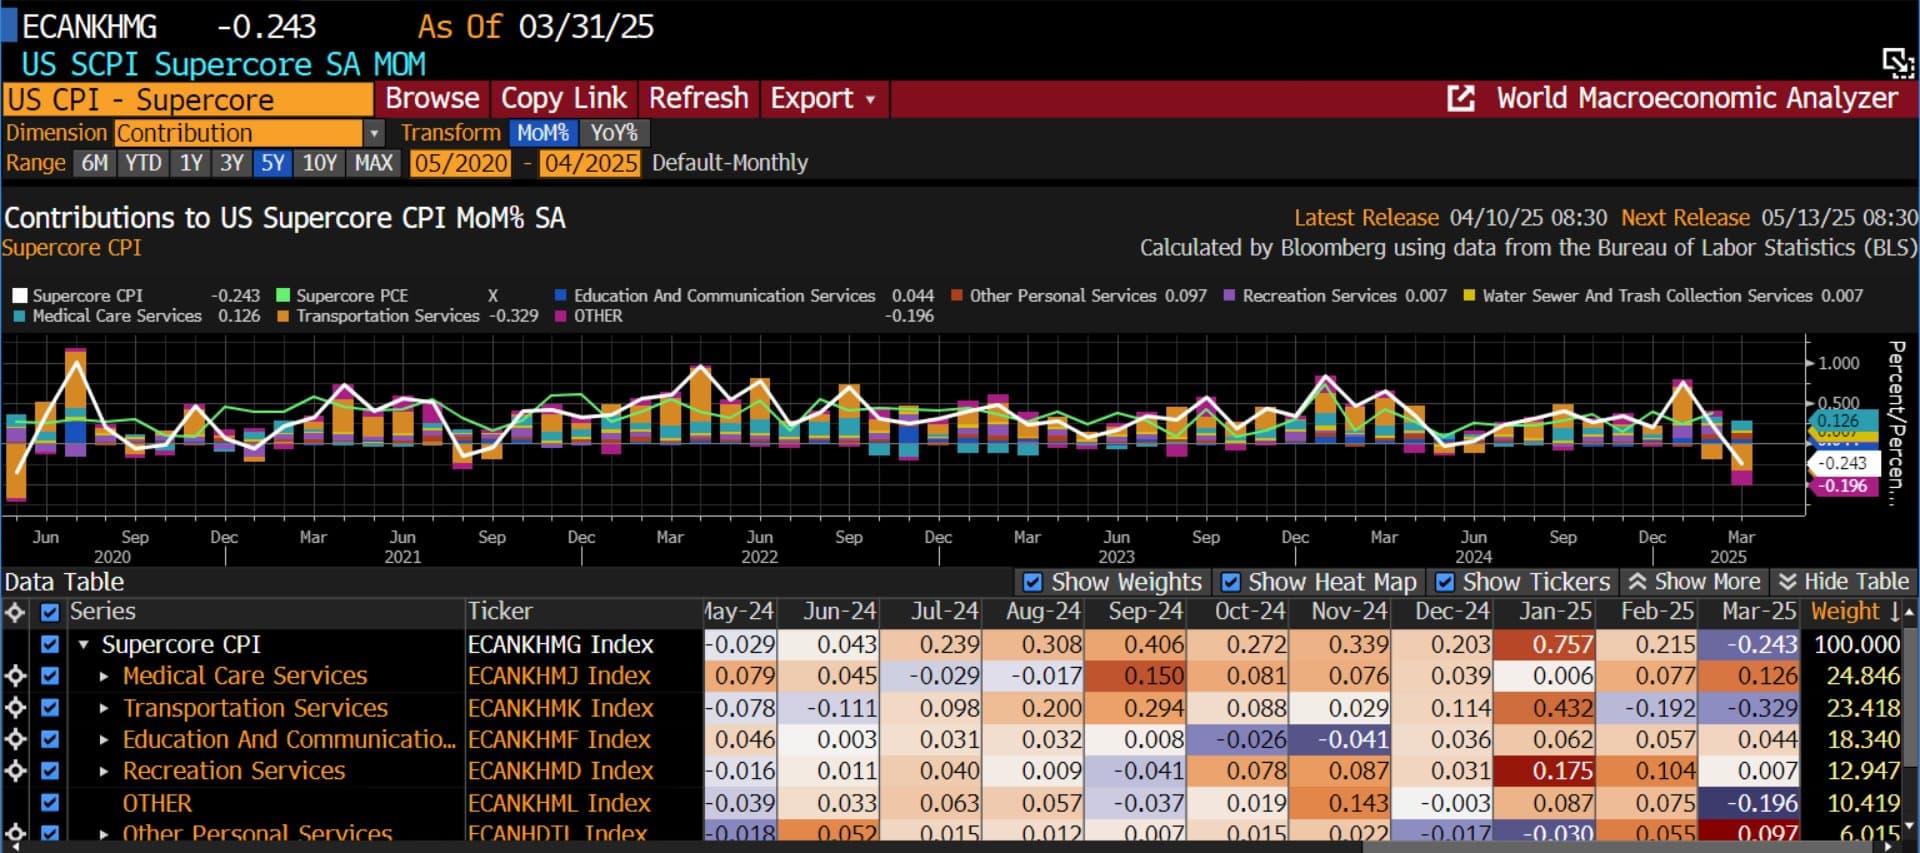
Supercore inflation rose to 0.757% from 0.205% in December.
The hotter than expected numbers has been largely blamed on the tendency for companies to raise prices at the beginning of the year and the new seasonal adjustments which came into effect in January. Other reasons provided include a recent minimum wage hike across 21 states and a rise in eggs prices by 15.2% on the month (accounting for two-thirds the increase in at home food prices) due to flue pandemic
This is definitely not a good print, but my current thinking (it could change as more data comes out) is that the numbers for January are not as bad as reported, but it does warrant more concerns about a reacceleration:
It seems residual post-COVID seasonal adjustment issues are distorting early-year data (same as there were after 2009, despite annual updates. Similar inflation scares happened in early 2023 and 2024, which were eventually temporary as the year progressed.
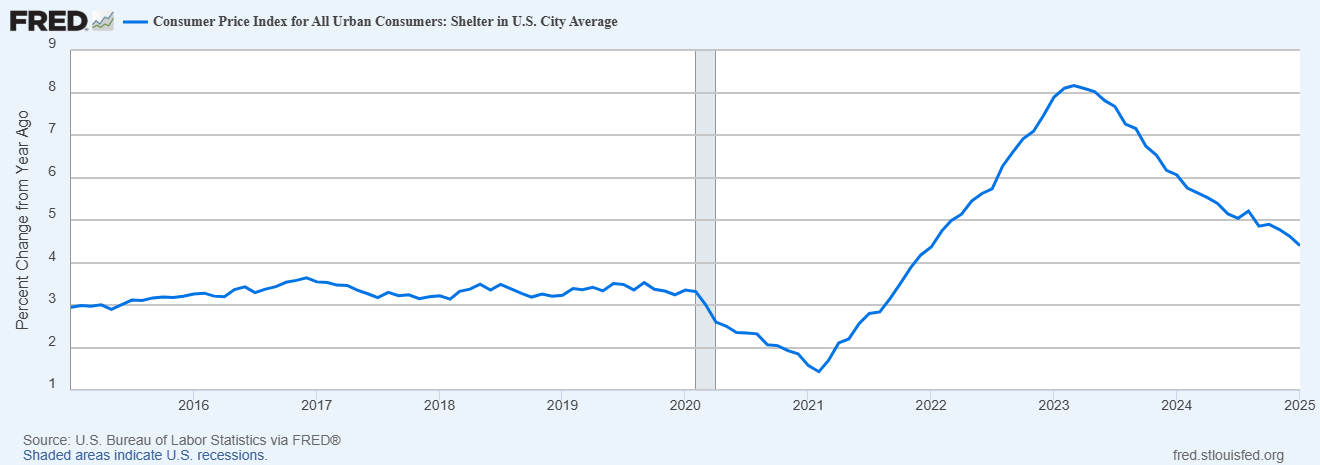
Shelter made up 30% of headline and 46% of core CPI, however, shelter is poorly measured with a significant lag. Alternative real-time rent data suggests inflation would be much lower with a better methodology. So, is expected shelter to continue disinflating, is just very slow to do so.
Egg prices are rising due to bird flu, but this should be temporary as the issue resolves eventually.
However, I still think the risks are more tilted to the upside, and these numbers if they continue could become a much bigger problem.
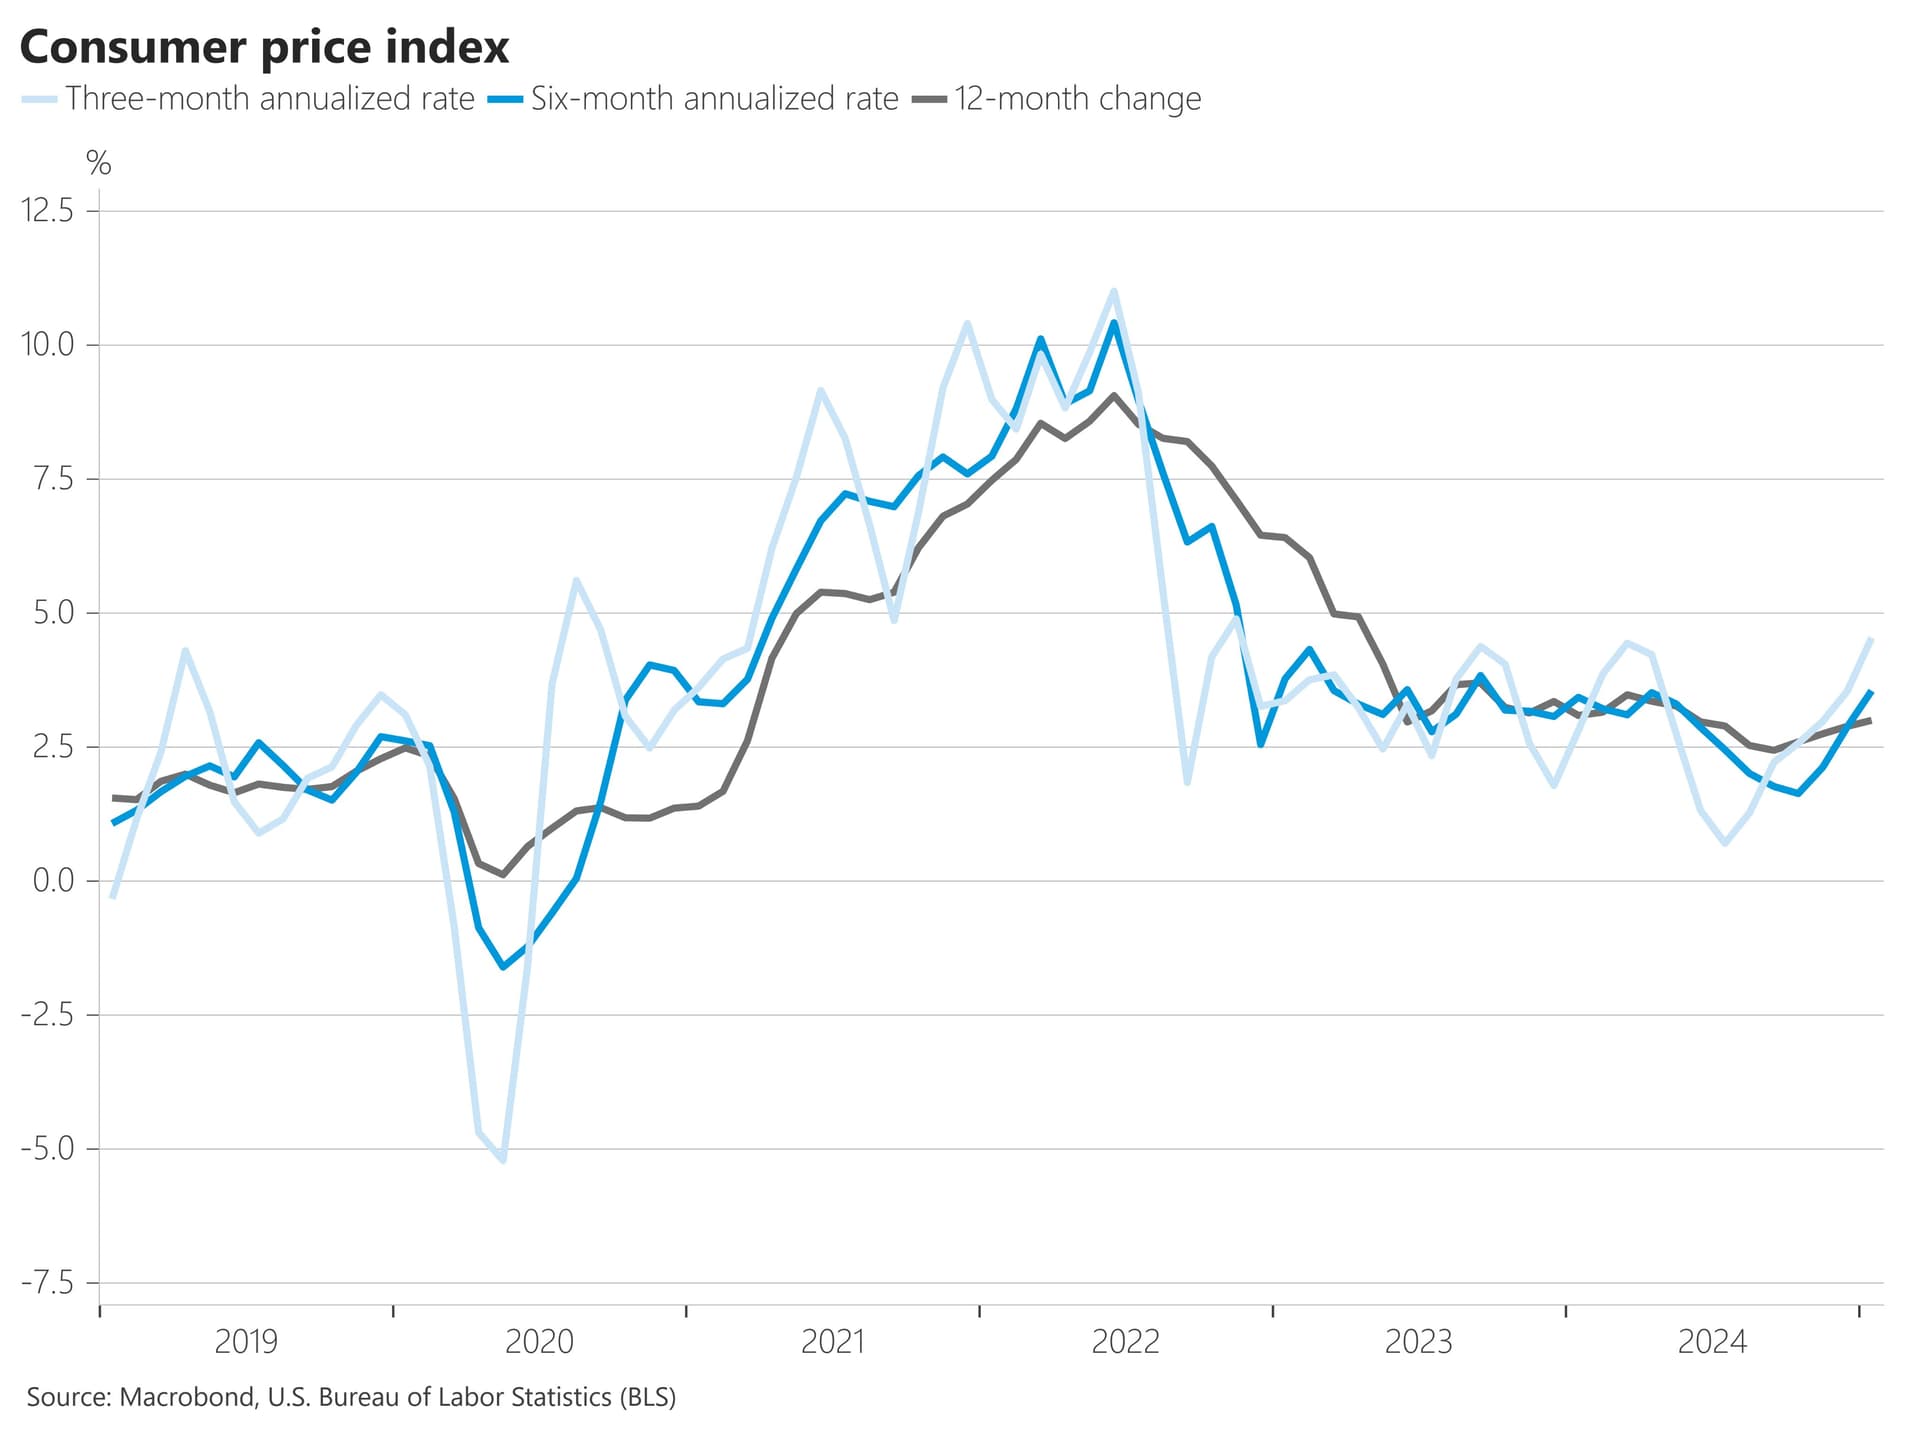
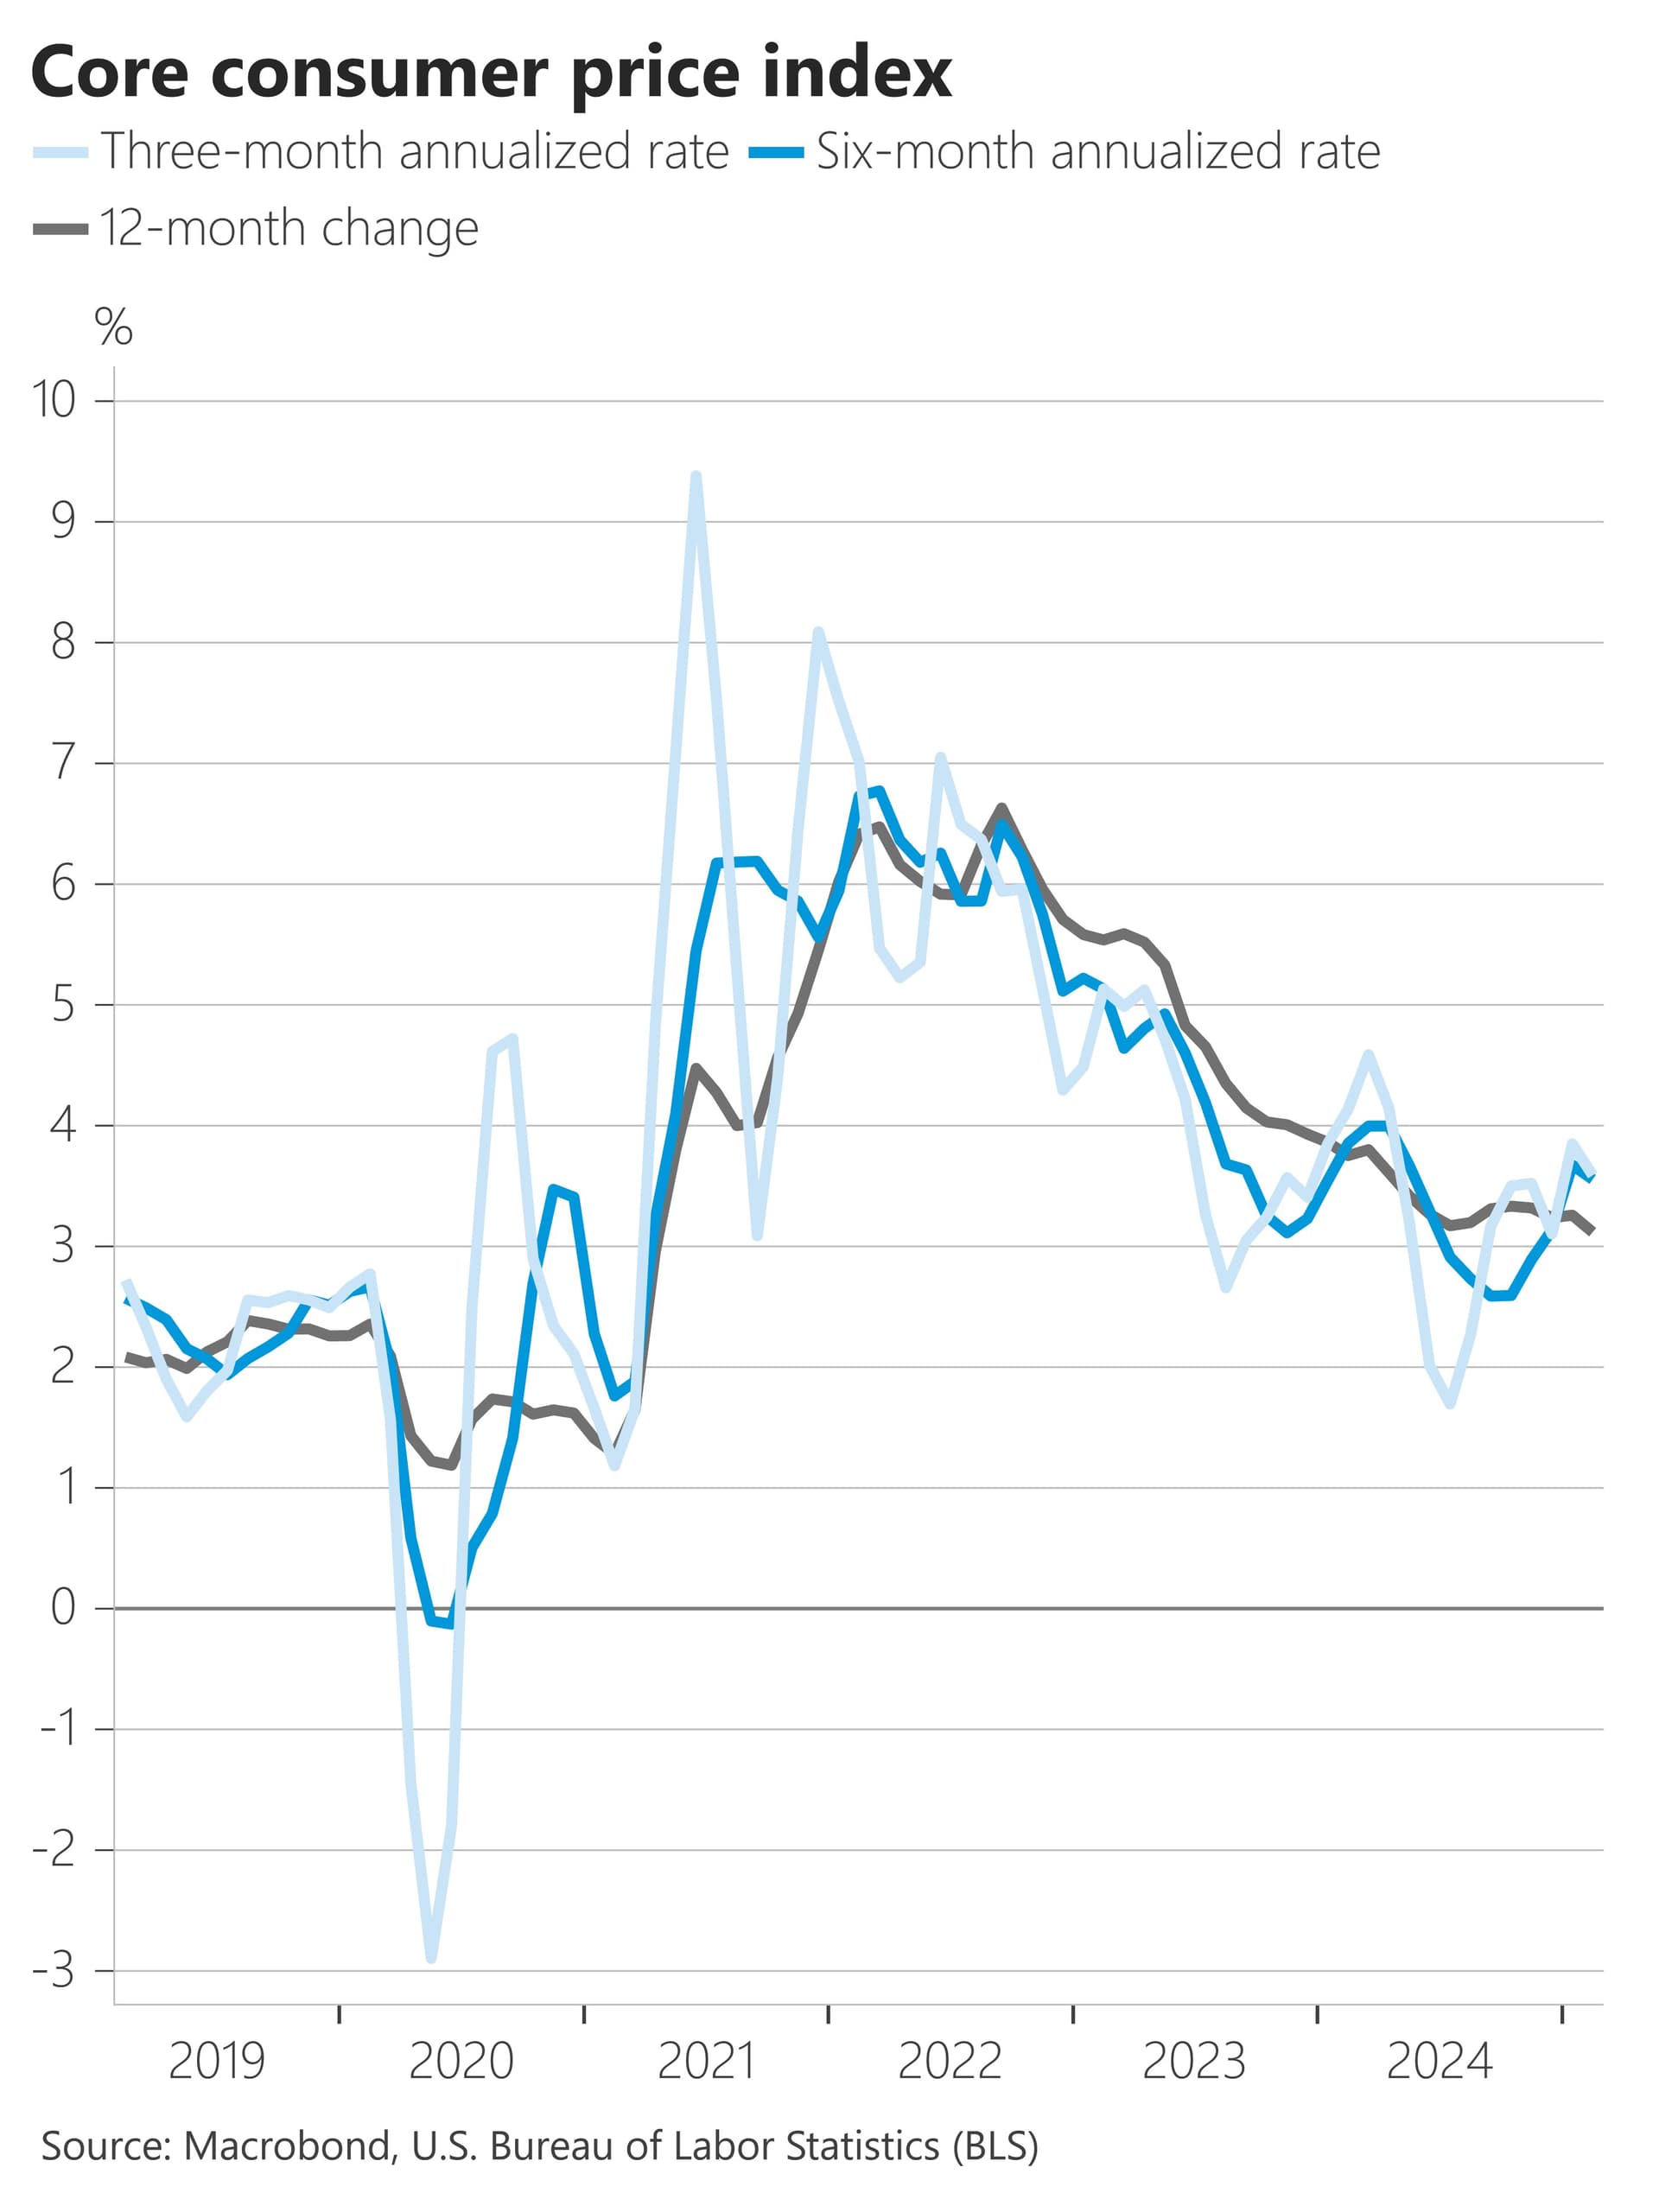
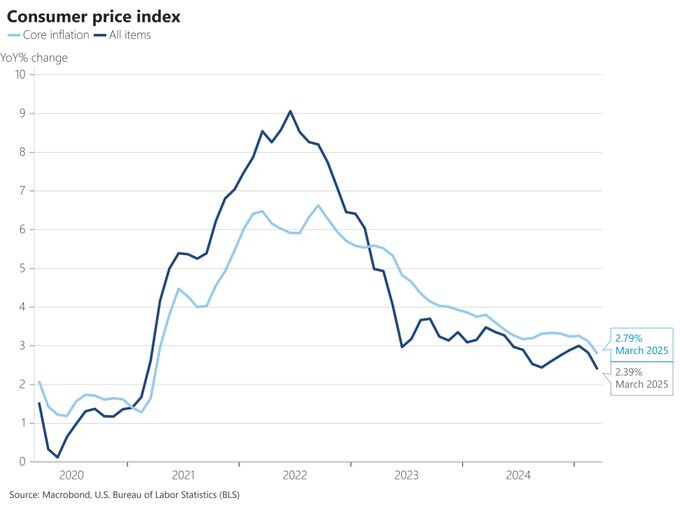
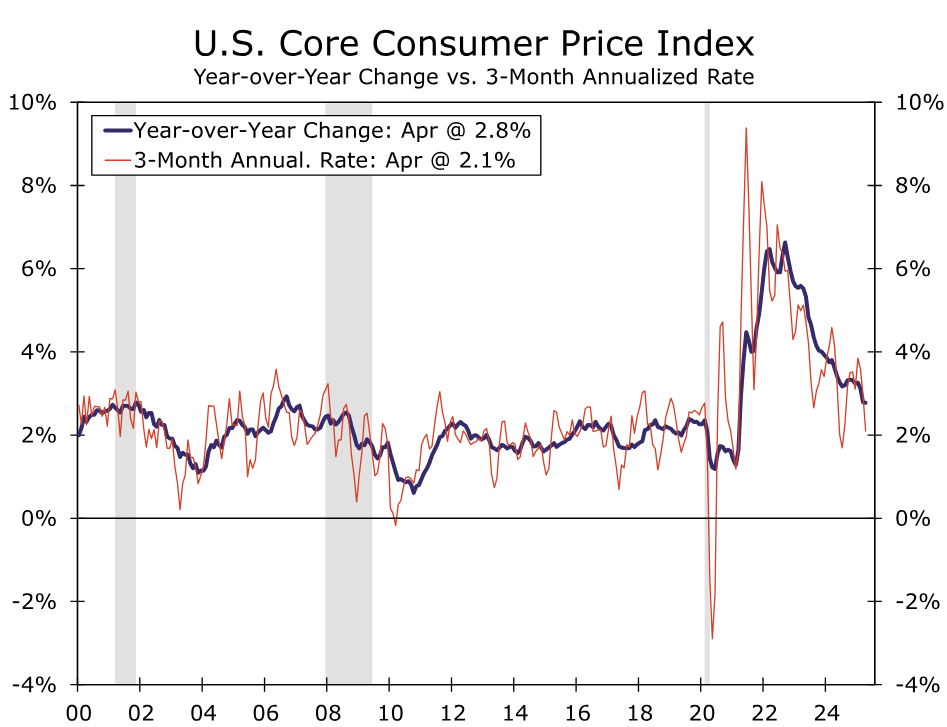
Headline and core inflation are rising over 3-month, 6-month, and yearly trends, though without a clear trend acceleration.
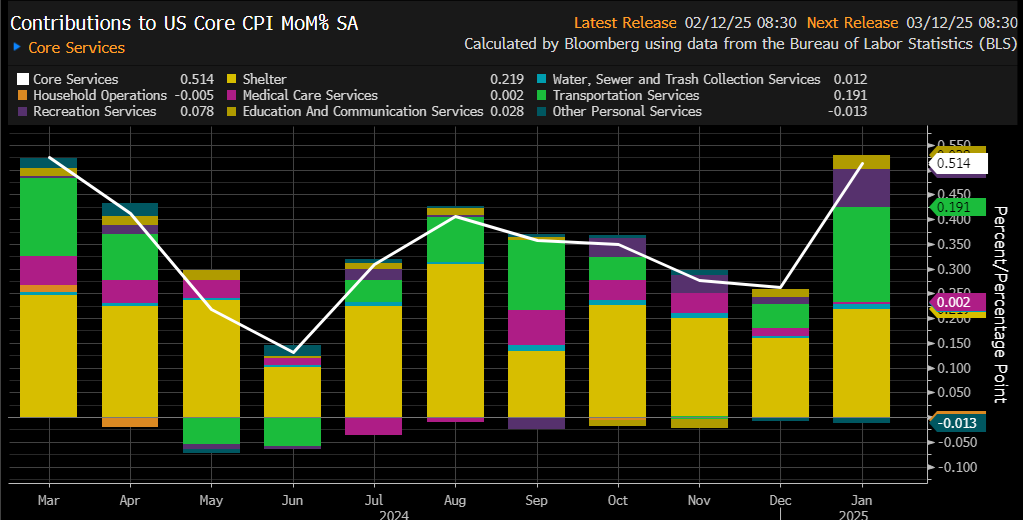
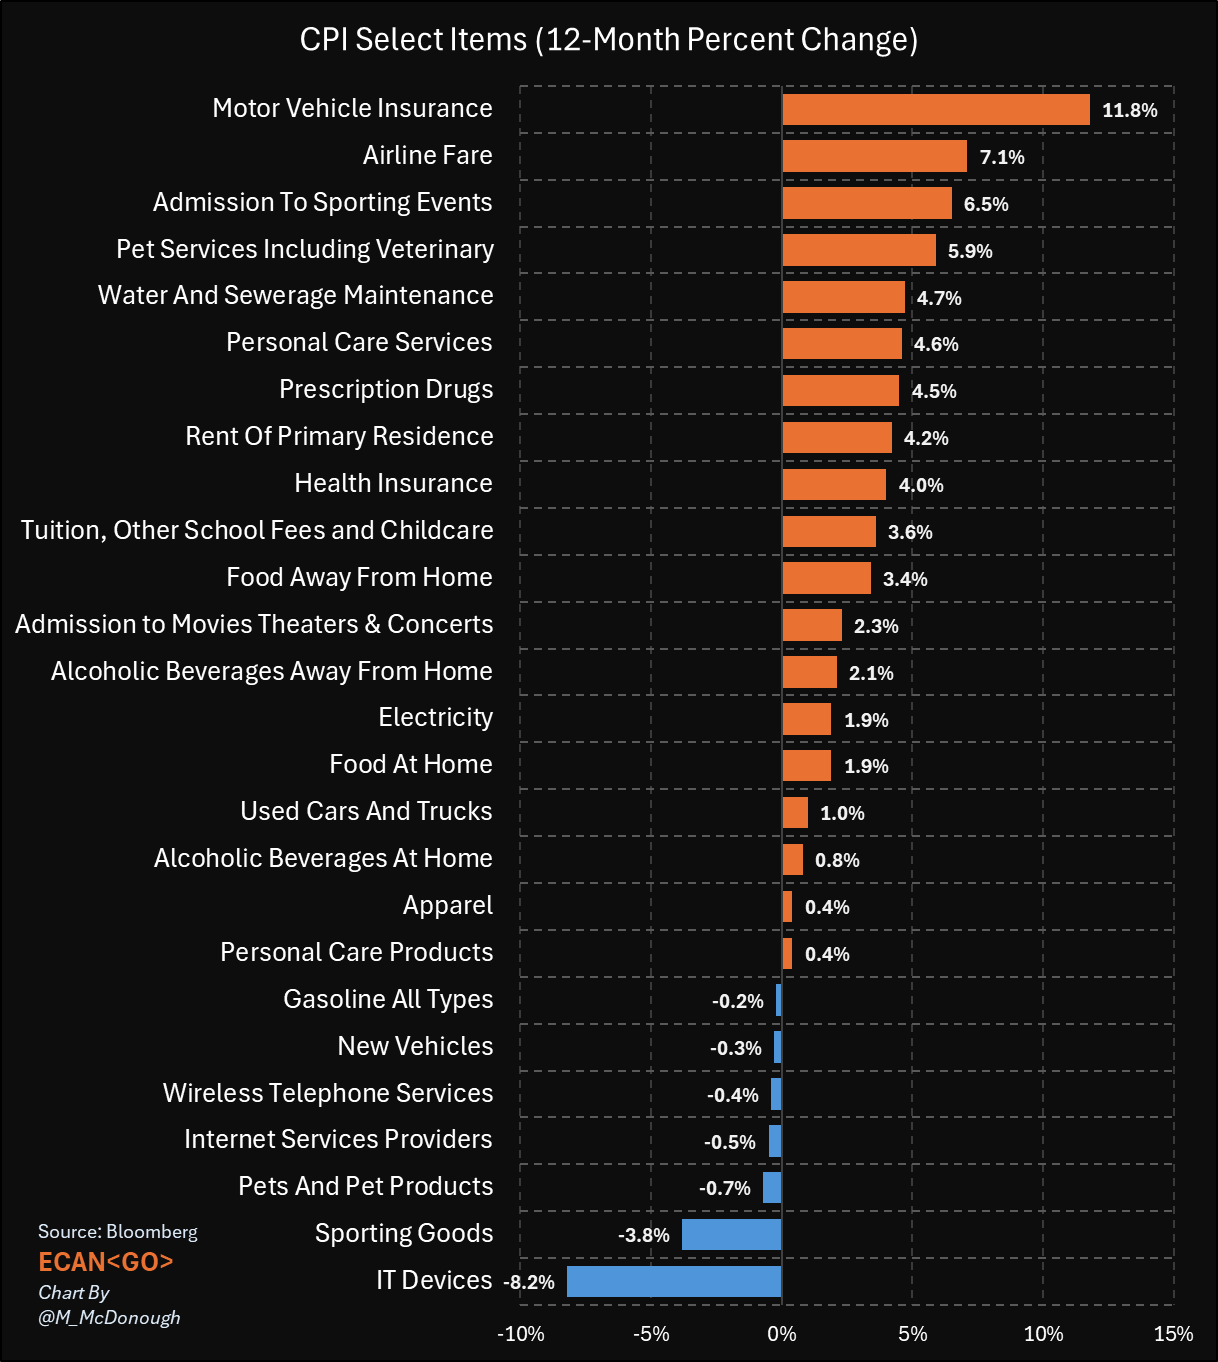
Super core CPI remains hot despite seasonal distortions. Transportation (vehicle insurance at 12% y/y) inflation appears beyond the Fed’s control currently.
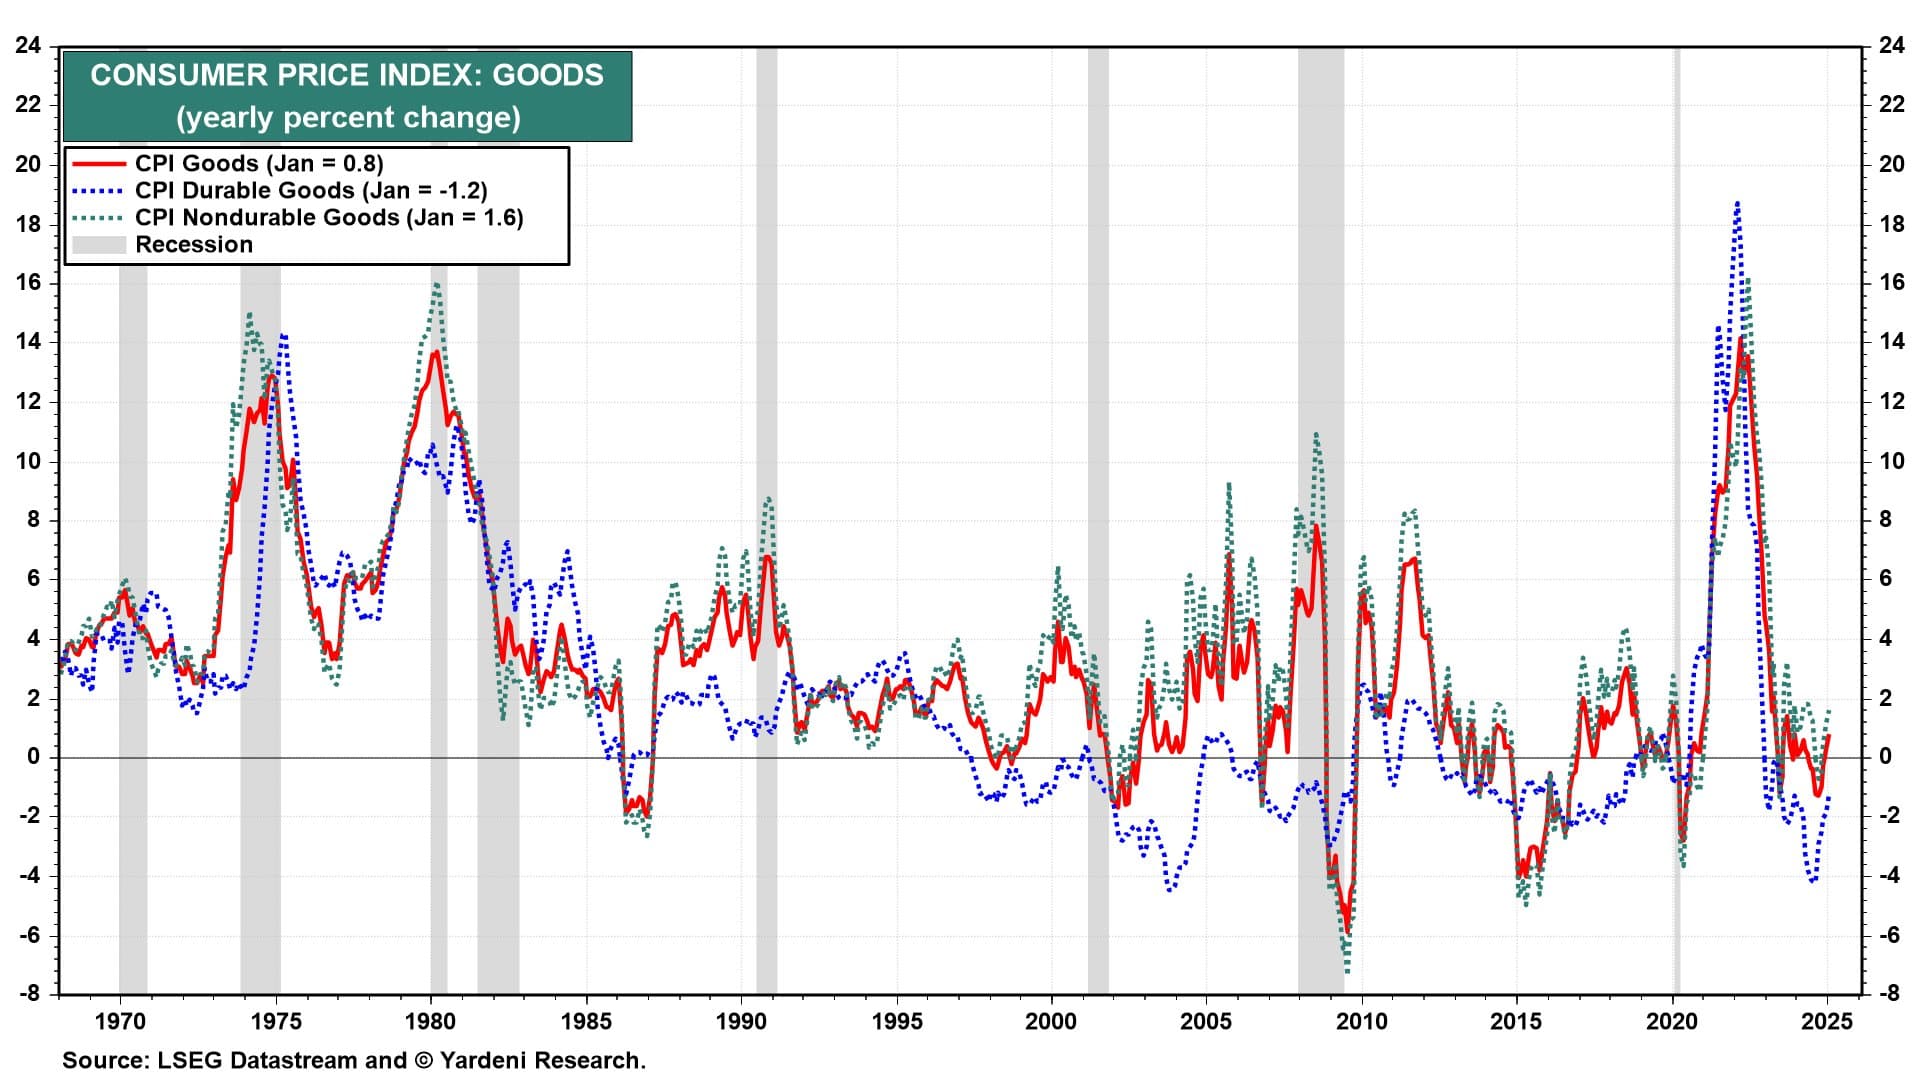
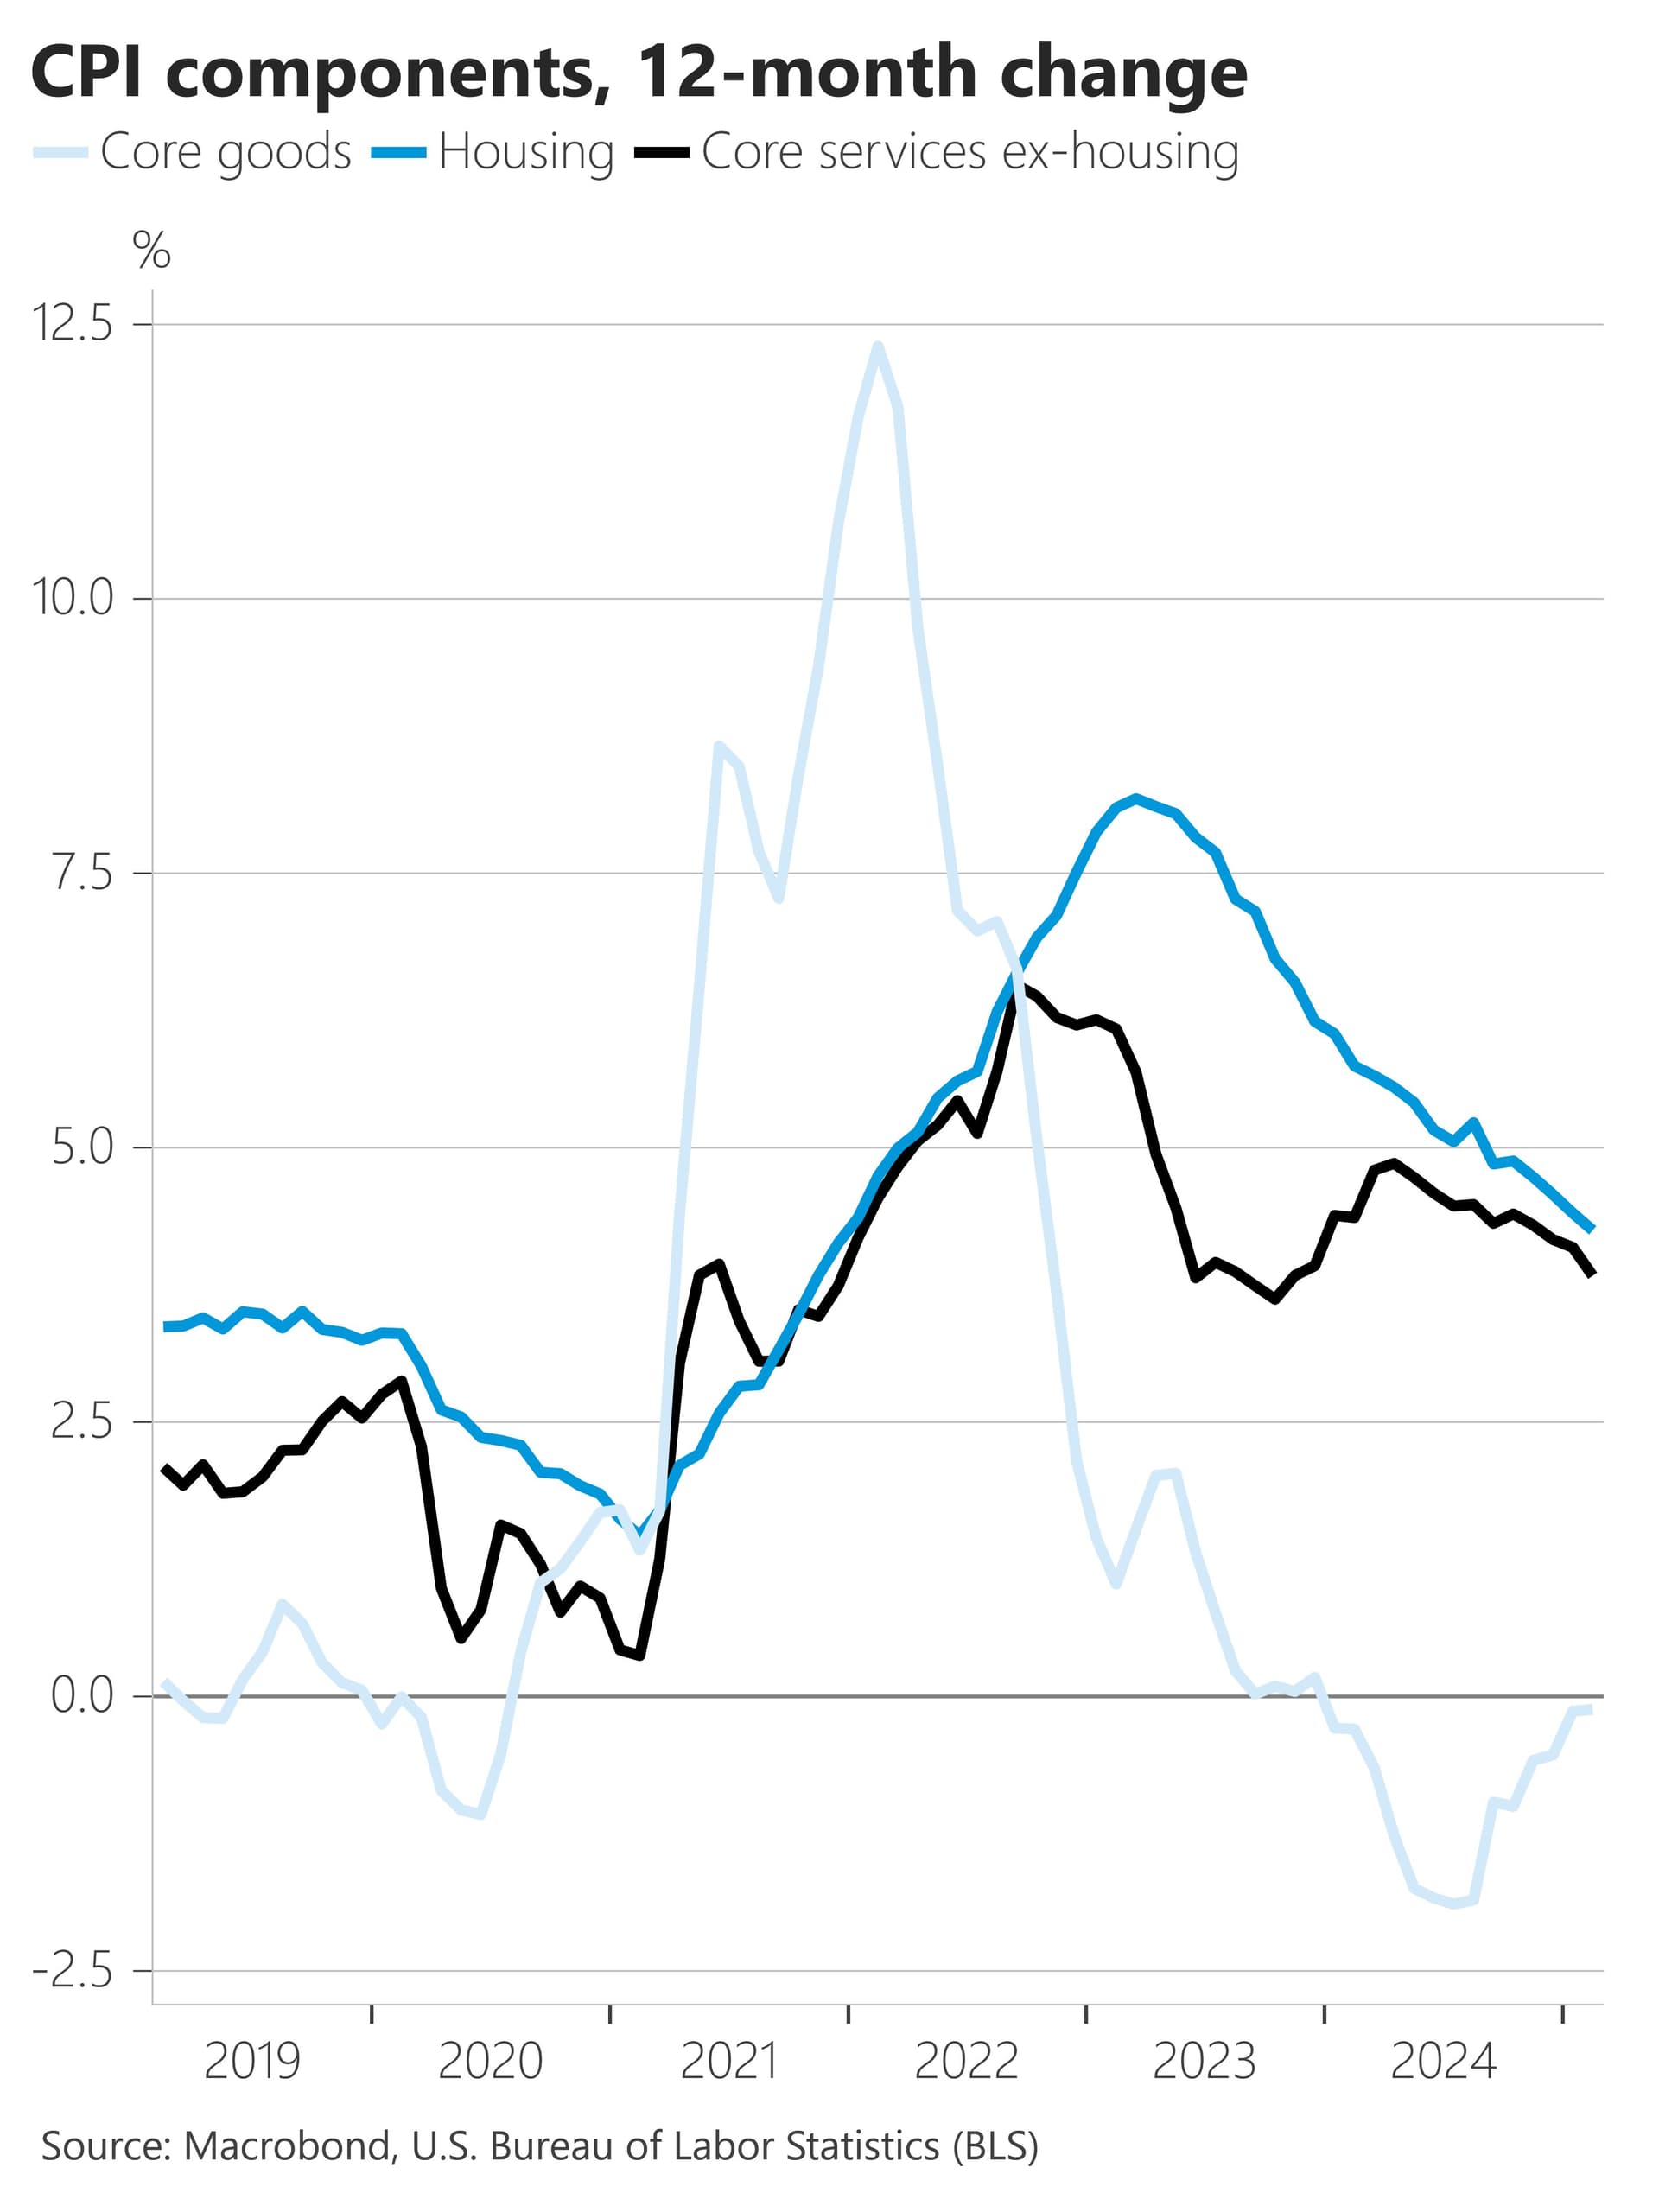
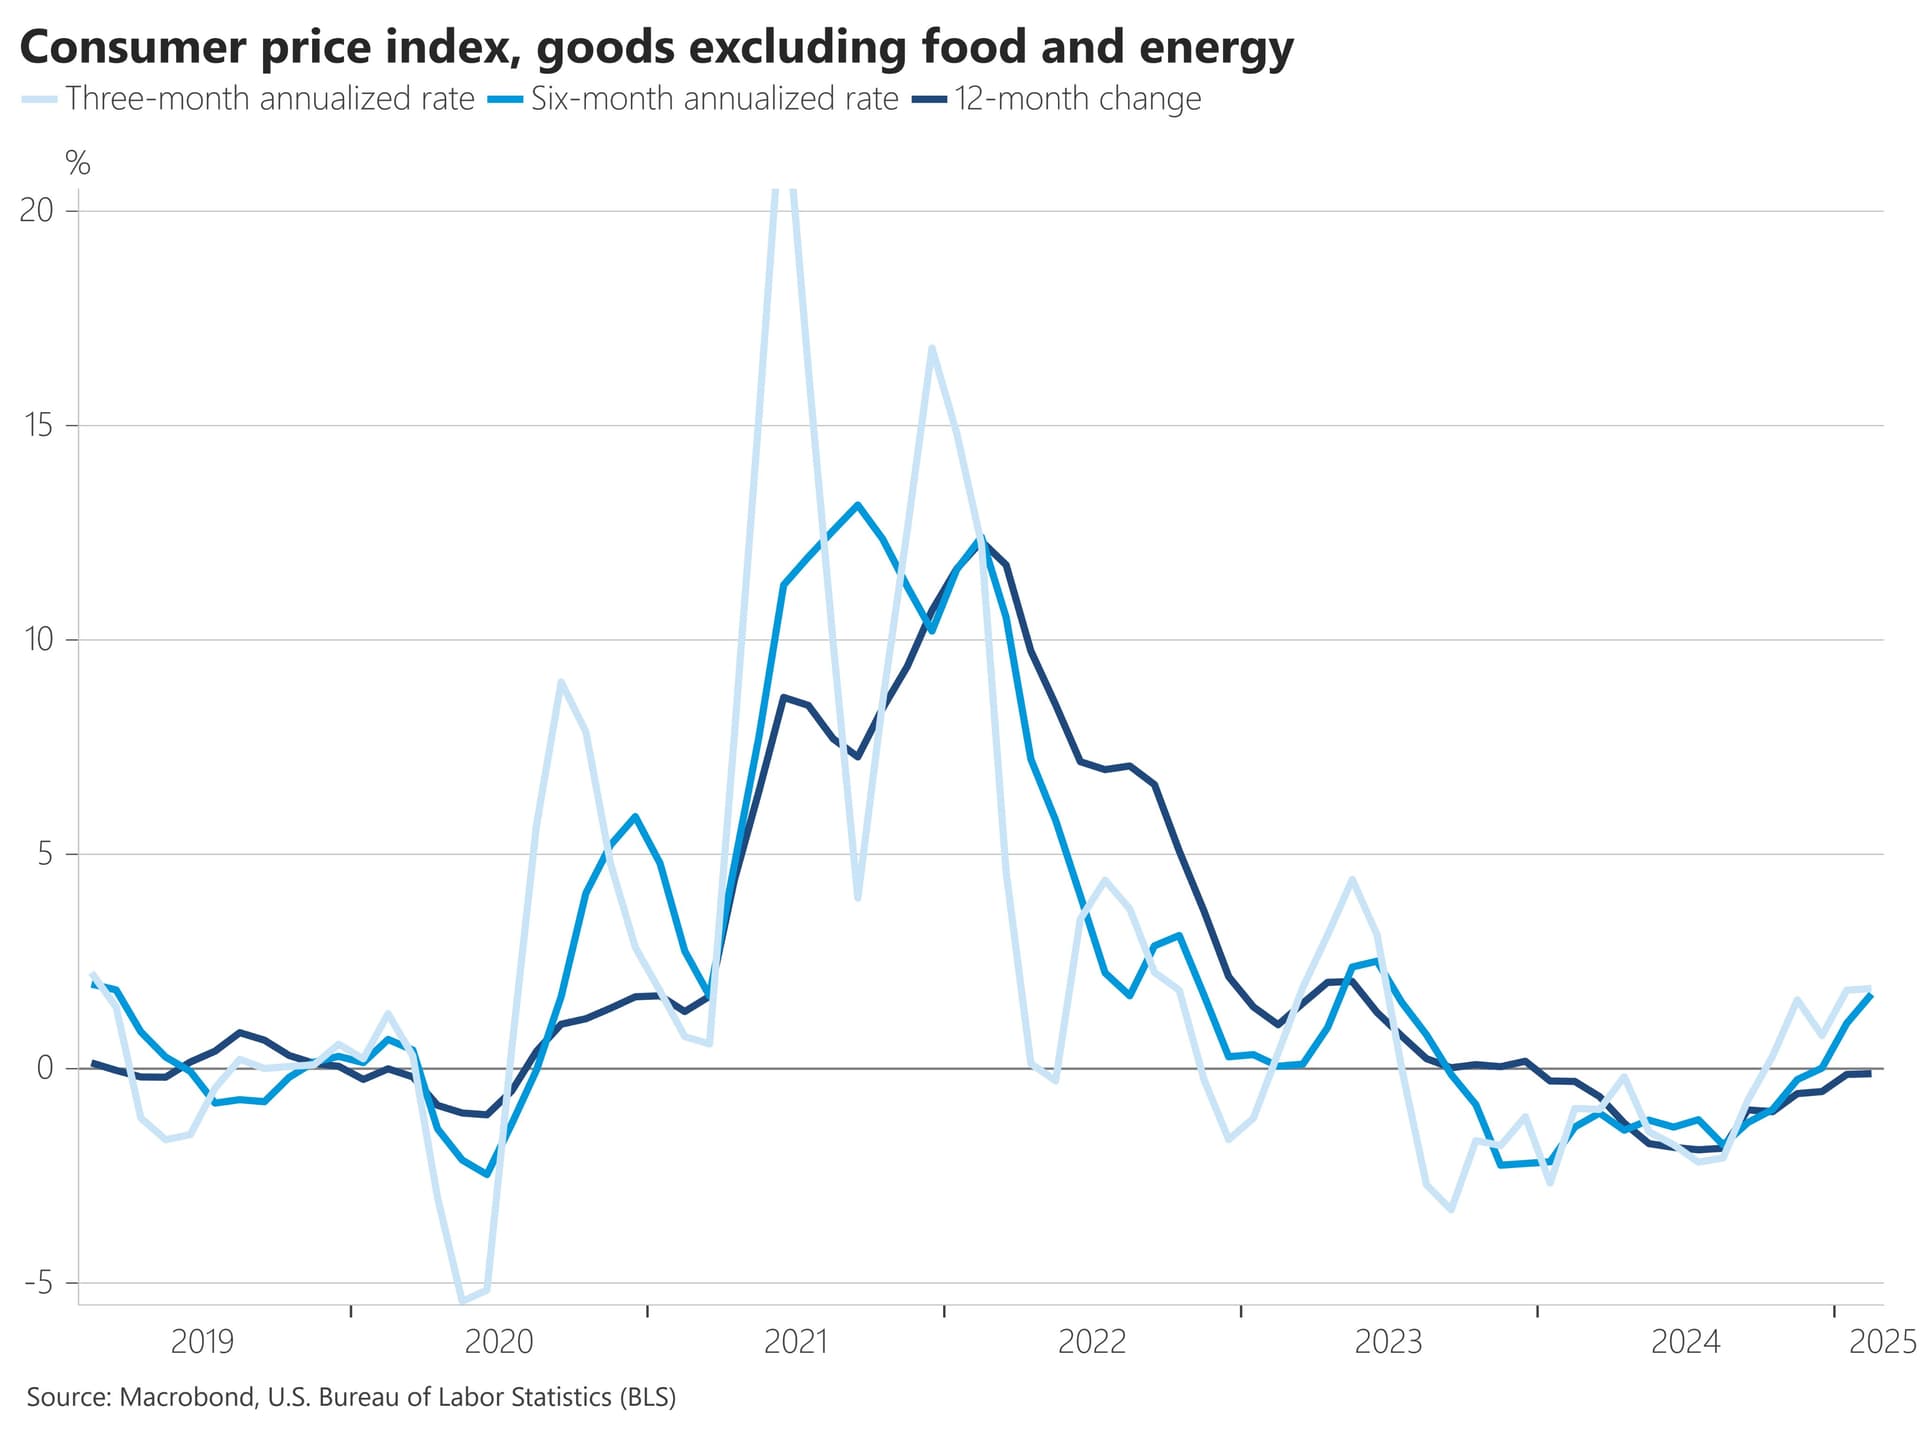
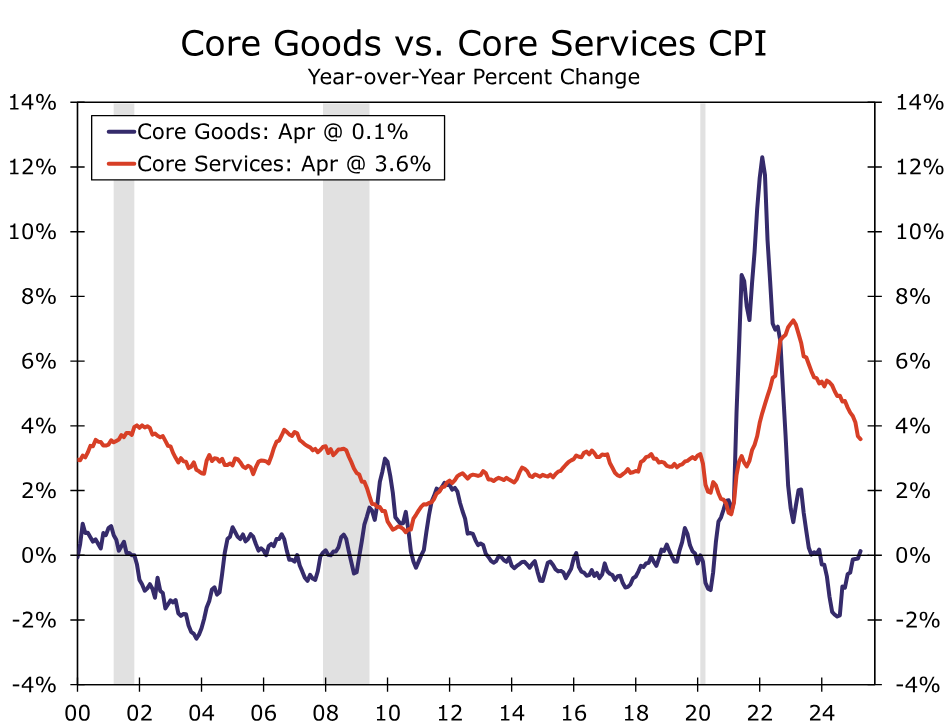
Core goods are no longer deflating (which helped a lot with disinflation trends) and are beginning to rise again to their normal inflation levels.
Market-implied inflation expectations are climbing to the highest levels since March 2023, contrary to the Fed’s stance that they remain anchored.
Some tariffs increasing are inevitable with Trump
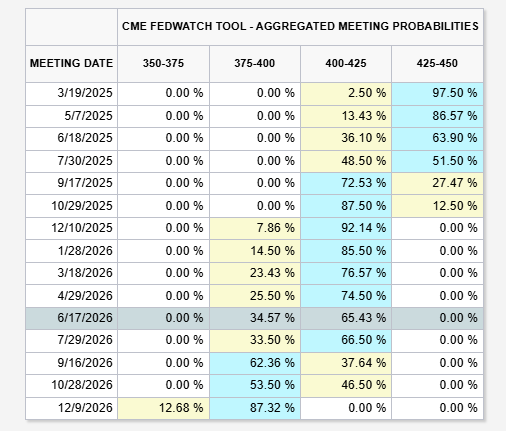
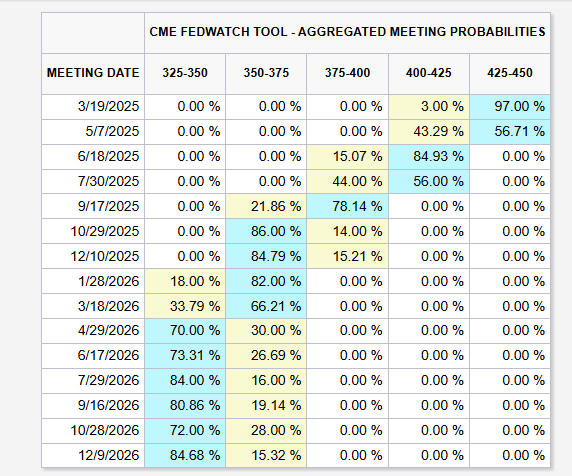
All combined, I think today’s data makes rate cuts in the short term very unlikely to happen, though the odds of a hike also remain low IMO.
Higher for longer could in turn create highter likelyhood that credit and treasuries issues in the economy.
Markets now expect the first 2025 rate cut in September, followed by another only after a year later.
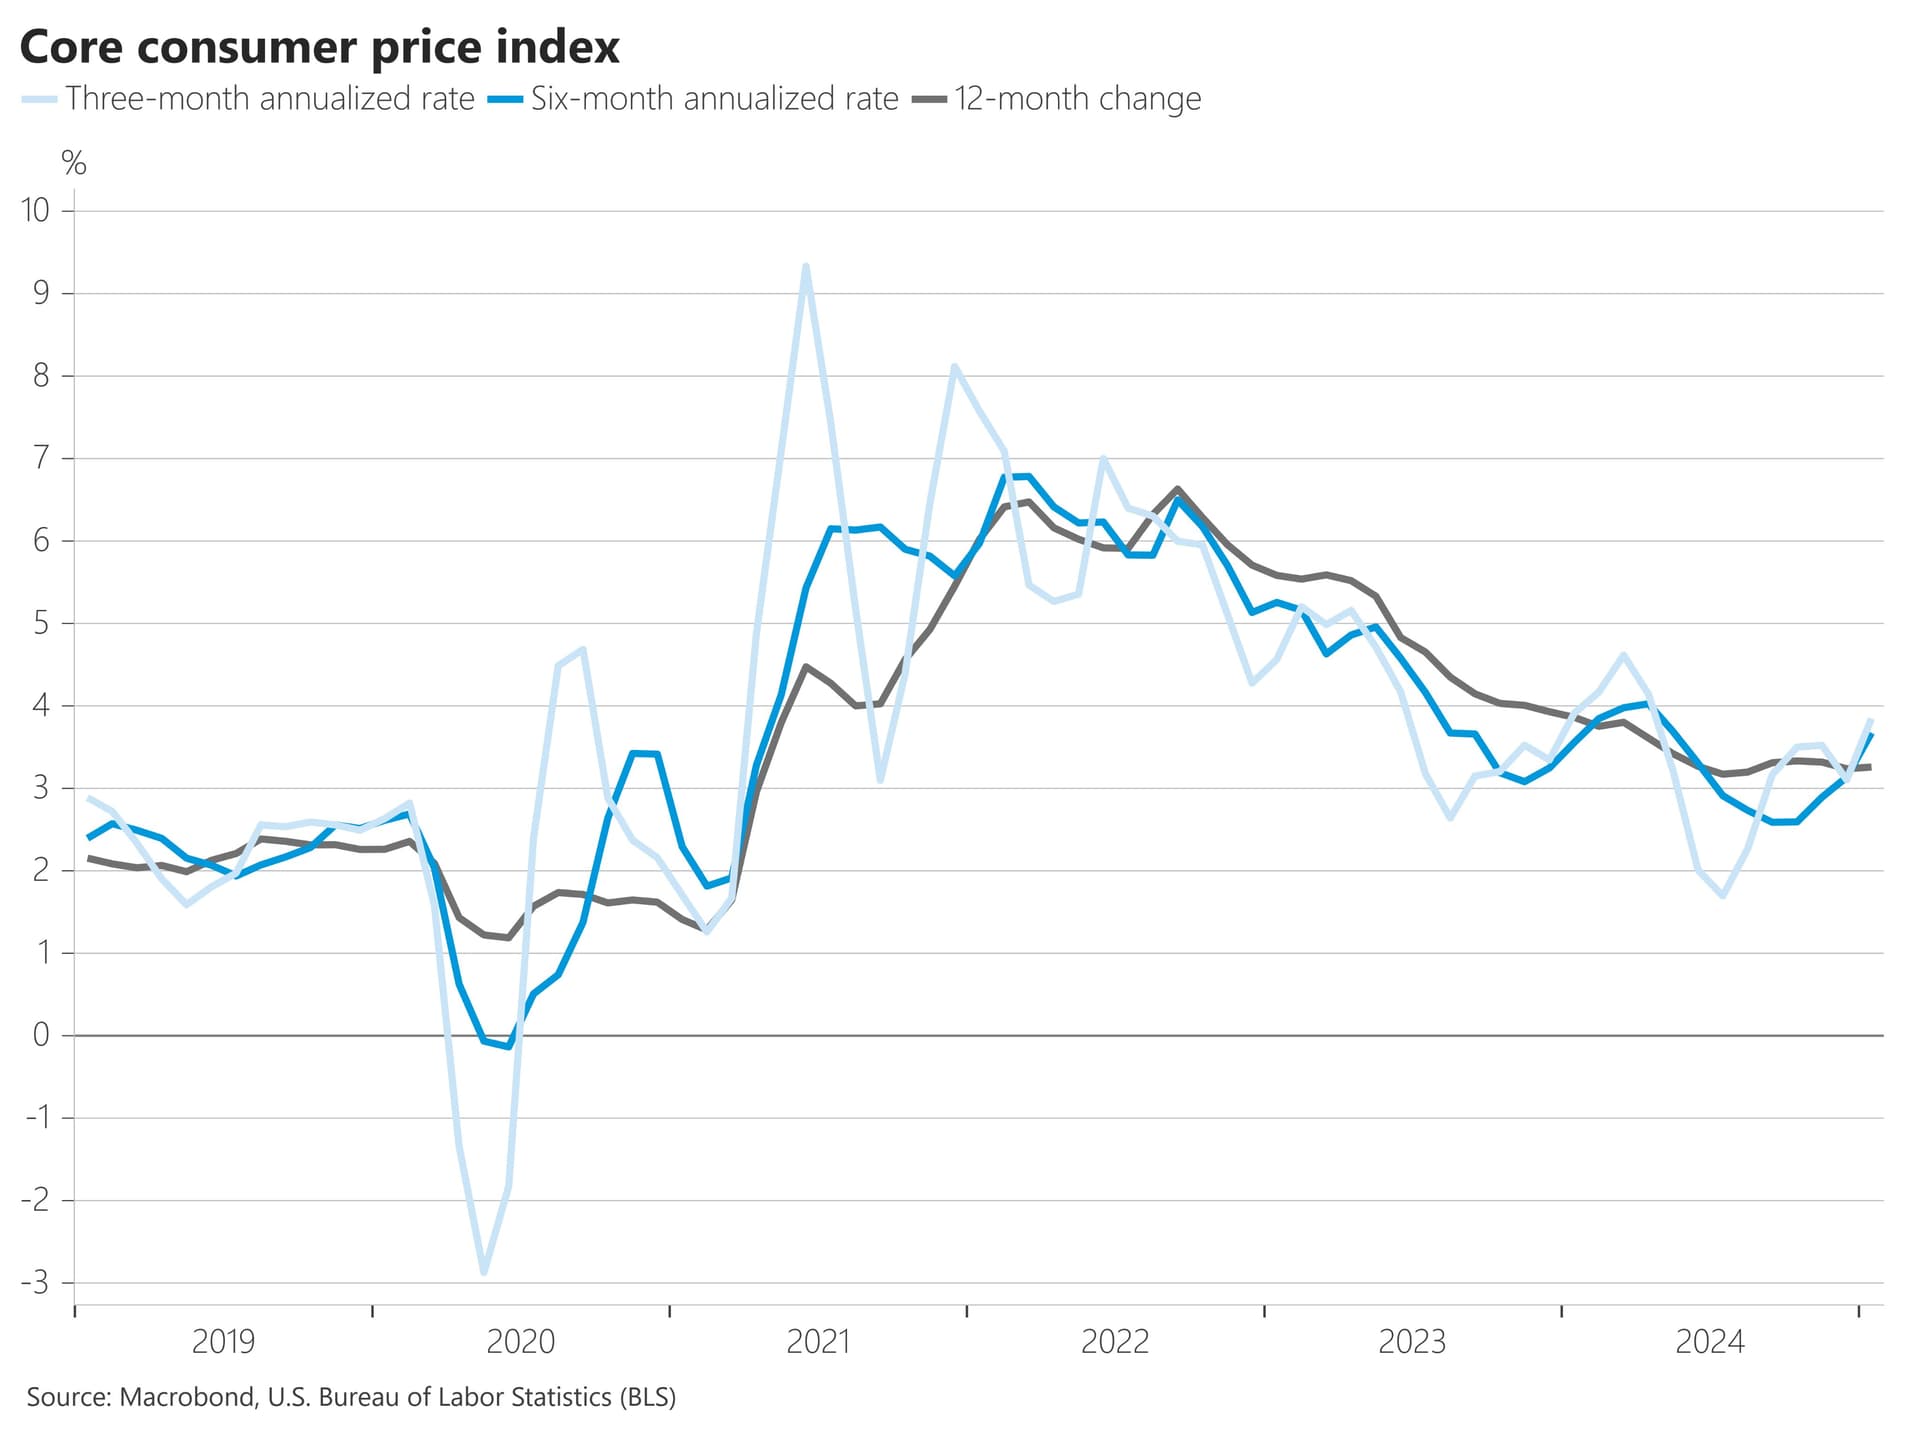
All important trends going up (or at least bottoming) for both core and headline inflation
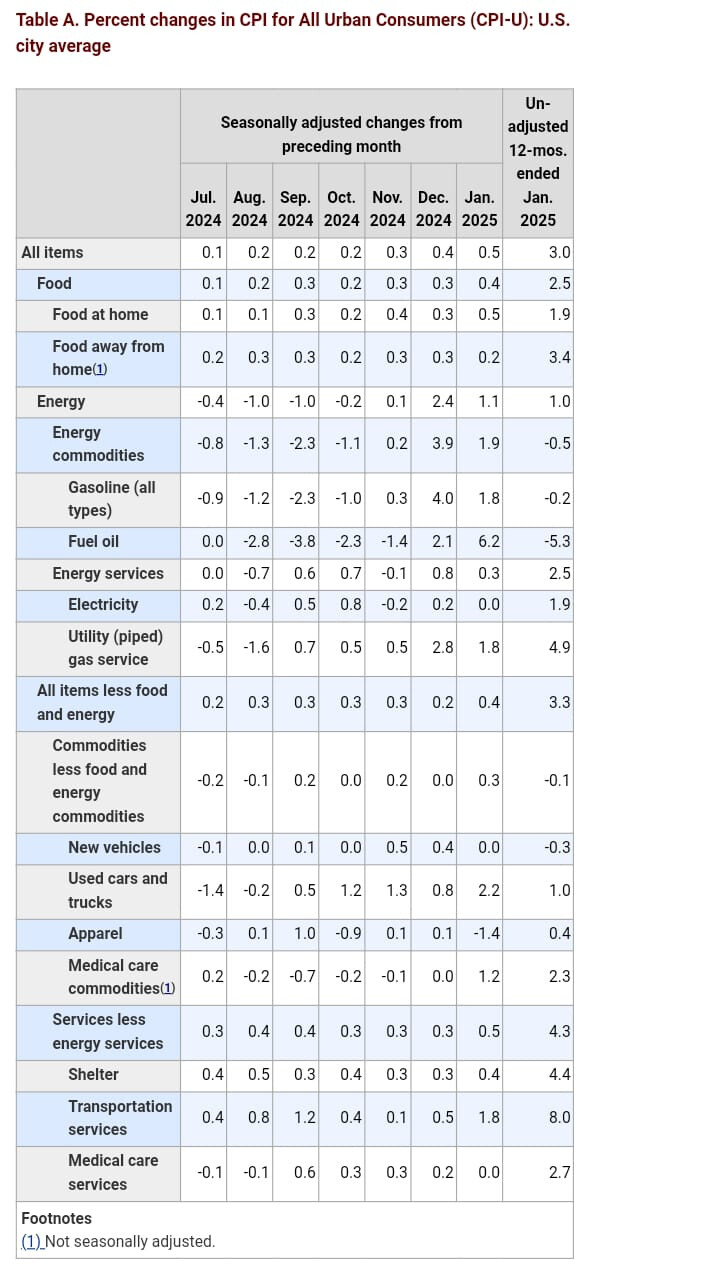
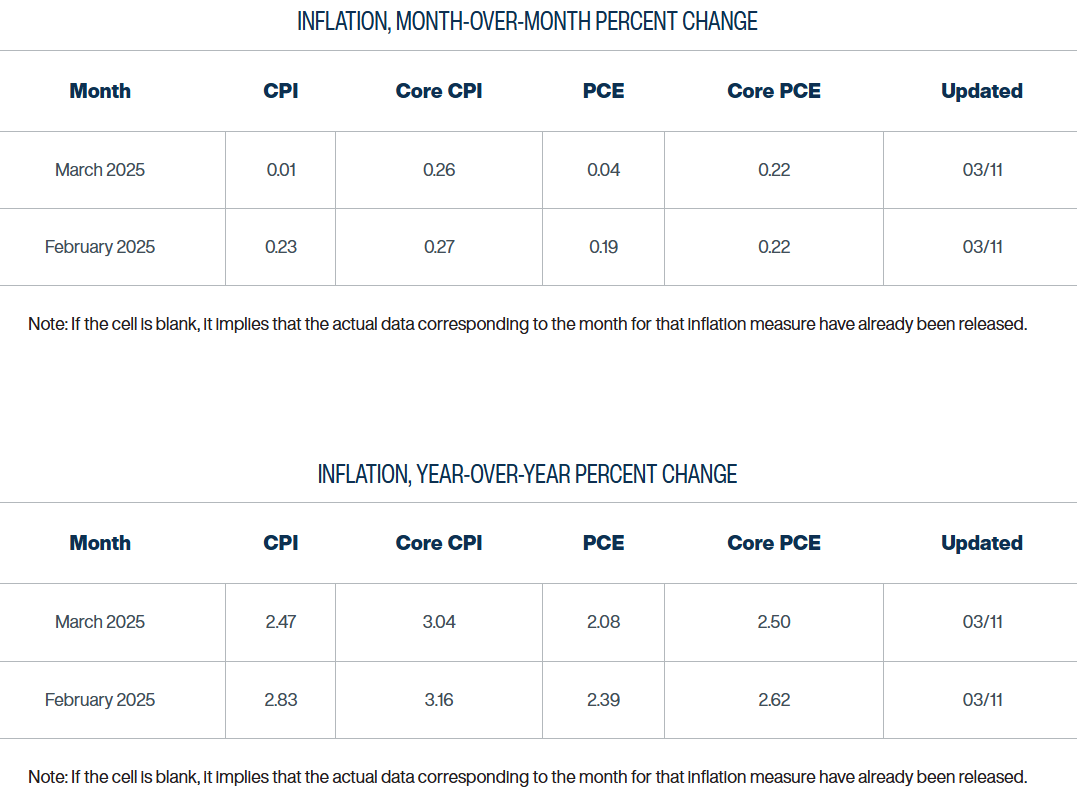
Core y/y rounded up to 3.3% (3.258% in Jan vs 3.238% in December)
Core 6m annualized rate ticked up to 3.7% from 3.2%, and the 3m annualized rate was 3.8% (vs 3.1%)
Headline rate up to 2.99% (vs 2.87% in Dec). The 6M annualized rate was 3.6% (vs. 2.9% in Dec) and the three-month annualized rate was 4.5% (up from 3.5%).
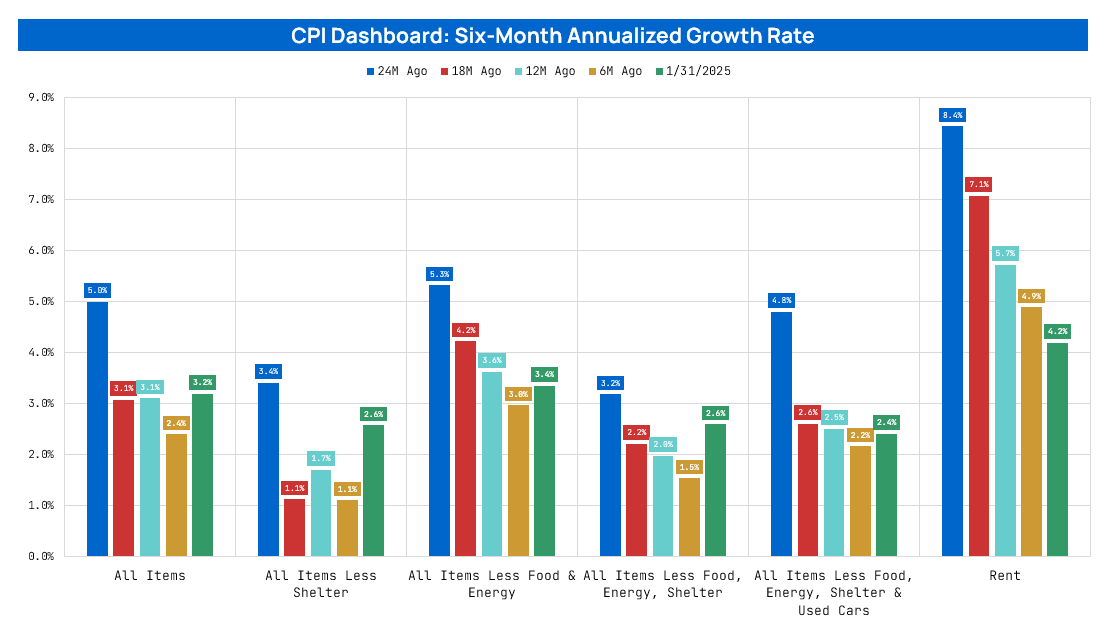
Shelter still slowly going down y/y to 4.4% from 4.6% in December 2024.
Despite lodging away from from increasing 1.4% m/m (2.2% y/y) and contributing to a hotter increase, it still only has a small contribution to CPI (1.3%)
Rent primary residence and Owners’ equivalent rent are still the biggest issues inside shelter (0.3% m/m, over 4% y/y) due to its poor measure
Core good has stopped deflating, and is slowly going back up
Goods were a significant source of disinflation, without this positive contribution and stickiness in services inflation it will become more difficult to see additional progress in inflation
This alternative real-time rent data is very interesting. Do you think it has a very strong methodology and is widely accepted/followed by economists, the fed, market participants? Maybe you can create a Notion page in which you create an assessment how well made, reliable and widely regarded it is?
Zillow, Apartment list data is very followed by everyone. I always see it being quoted or mentioned. But is usually used to understand where shelter CPI could be headed in the future, as a leading indicator.
Even the FED Cleveland and BLS did a study recently trying to explain why these data are different from BLS data. (defending why BLS CPI methodology is the correct one to have)
Even the FED Cleveland has an alternative measure for rent, and Powell has mentioned it before.
So, the FED does pay attention to it, the fact Poweel has mention he expect shelter to continue coming down is likely based on these metrics. But I don’t think the FED makes or can policy entirely based on it, because ultimately it does not matter if BLS does not change its methodology because shelters will always have a lag or be badly measured (which no one really understands how long it is), and they have to deal with that.
I will create a task and a notion page for this because I know nothing about their methodology.
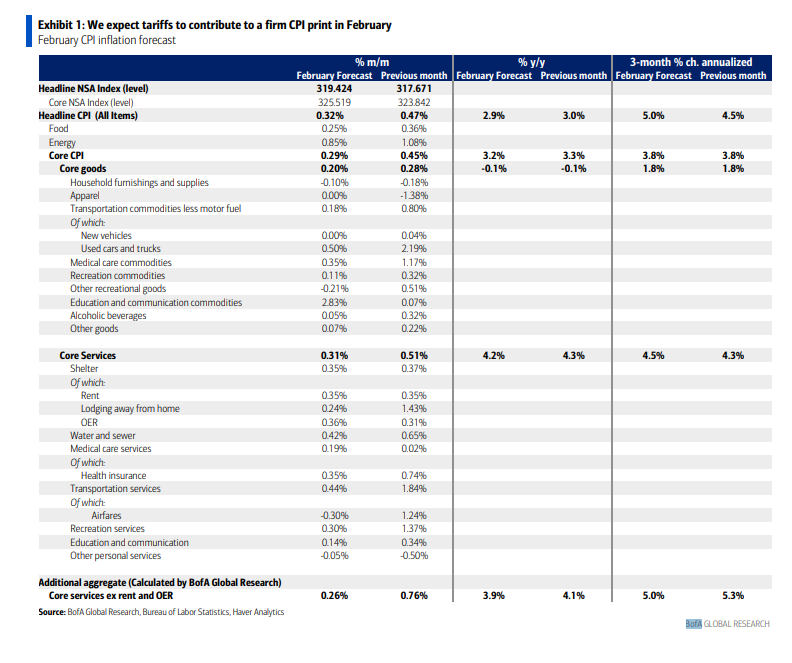
Progress for February CPI is still minimal and is expected to continue to be stuck in the same range since early 2024.
Tomorrow’s report will also be crucial for the markets due to all the uncertainty with tariffs and the economy, so the impact on the FED path could be important because of the fears currently of a stagflationary type of environment in the coming months.
Due to this, I think that even a slight miss on the numbers will not be taken positively by the markets and will continue to fuel the market sell-off, contrary to this any improvements beyond expectations will most likely create at least a temporary rally tomorrow
The fear is also that the front running of tariffs on goods could start to be evident on CPI, because goods have been a good source of disinflation.
Potential Market Reaction: These are just guesstimates; the underlying context and details sometimes can be more important than the headline number.
If numbers >0.4% m/m → negative market reaction ( over -1%)
The market has already increased its rate cut expectations to 3 before February CPI, that’s why any slight miss could create a significant market reaction
I=9 Inflation rose 0.2% in February, less than 0.3% estimate
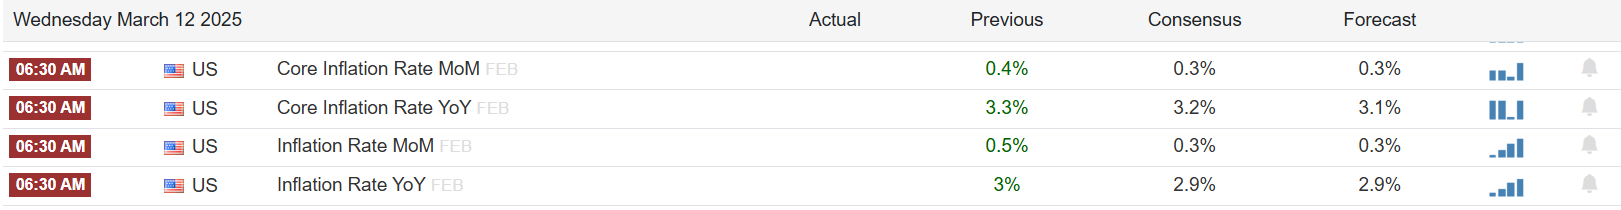
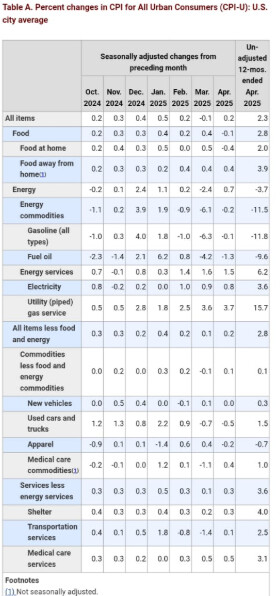
Both headline and core CPI rose 0.2% in February, below 0.3% estimates.
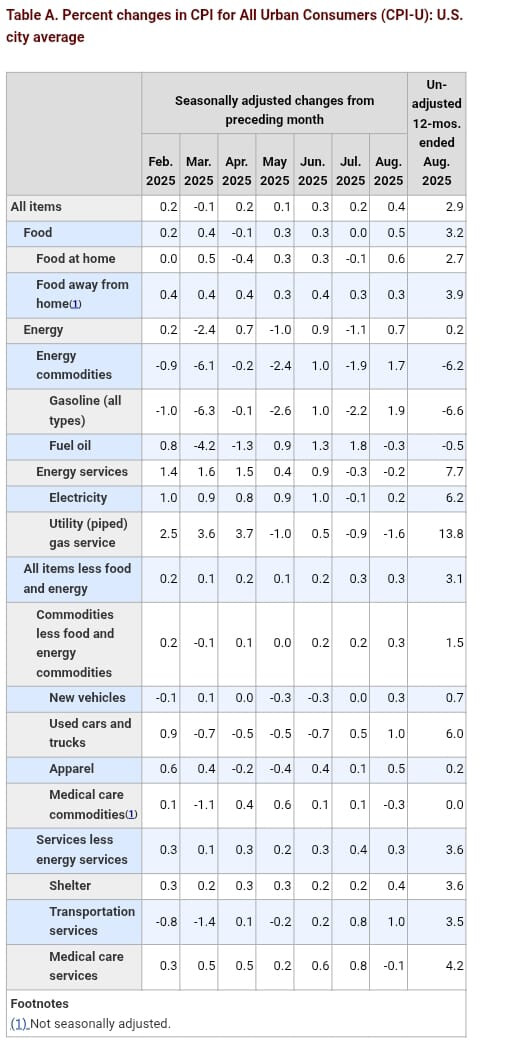
On a yearly basis, headline CPI increased 2.8%, less than 2.9% estimate and down from 3.0% in the previous month.
Core CPI rose 3.1% year over year, below 3.2% estimate and down from 3.3% in January.
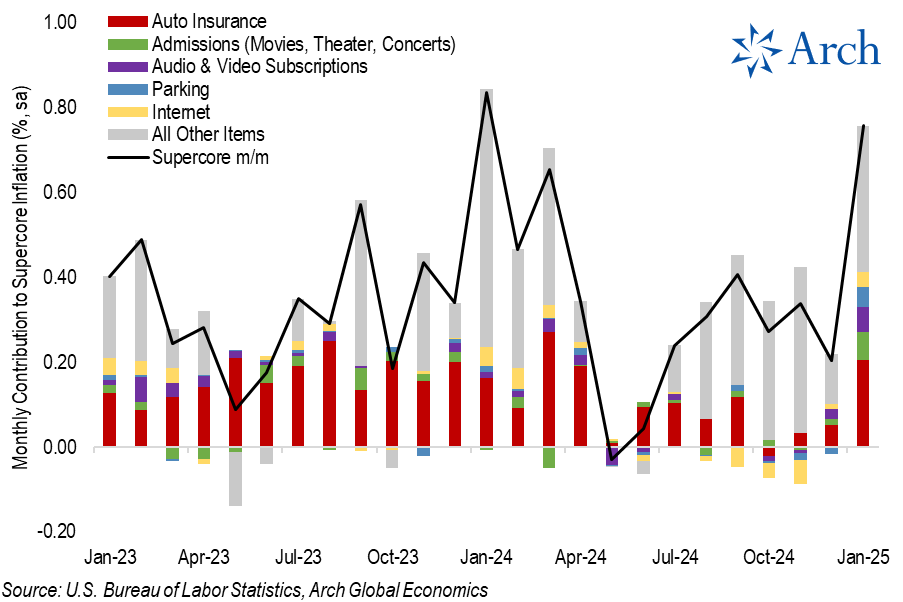
Supercore inflation decelerated to 0.22% month over month from 0.76% in January, dragged down by a decline in prices for transportation services segment.
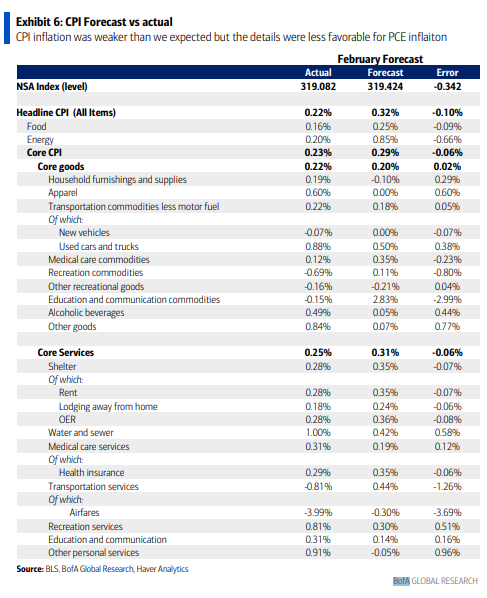
The numbers came in better than expected thanks to airfares which fell 4% and a drop in prices of new cars and gasoline by 0.1% and 1.0%, respectively. Grocery prices (food at home) were also flat after a 0.5% increase in January.
Despite the cooler-than-expected reading, the markets (yields) are not reacting as positively after the initial reaction. This is because some underlying details plus the pass-through to PCE components were hotter (which is the FED inflation metric used):
Airlines fares falling 4% had a significant impact on transportation services and, hence, core services; however, the weakness in airfares may not show up in the PCE, which pulls that price data from the PPI
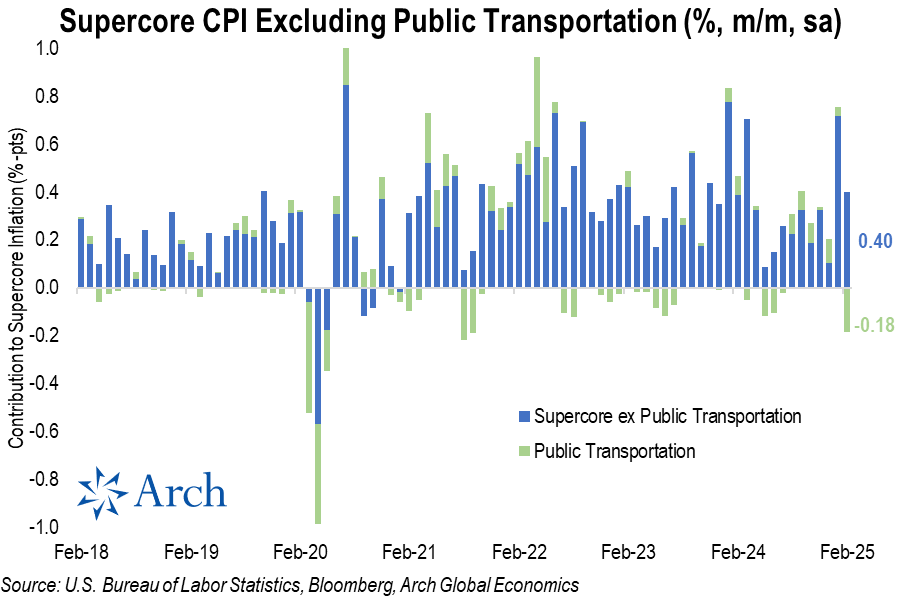
Supercore inflation excluding Public Transportation (which can be volatile due to airline), shows Feb 2025 was the hottest print since last March (outside of last month’s exceedingly hot print).
Core goods prices continued to rebound coming out of deflation, with the second hottest print (+0.22% m/m) since early 2024. Firmer goods prices could in turn lead to core PCE.
According to BoA, before CPI they were projecting a 23bps increase for core PCE. After today’s CPI data, they now see significant upside risk and are tracking a 30-32bps print. That would result in the y/y rate rounding up a tenth to 2.7% from 2.6%.
These reports are still not reflecting any of the tariffs impact from Trump, which could come in coming months, particularly on goods inflation.
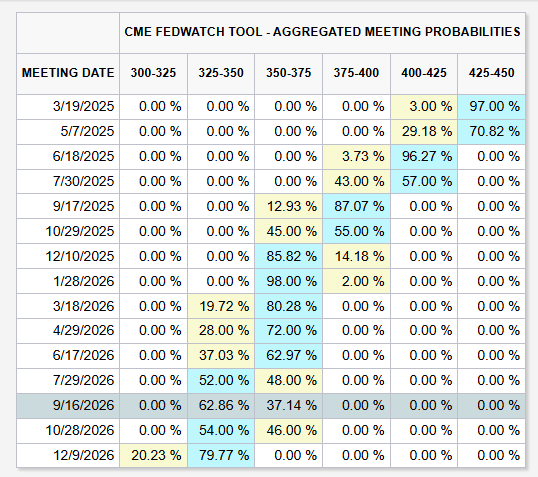
Overall, the details were less favorable for the Fed’s preferred inflation measure (PCE inflation), and the uncertainty with tariffs impact is still present, which led markets to reduce the likelihood of Fed cuts in the near term. Tomorrow PPI will also weigh on details for PCE.
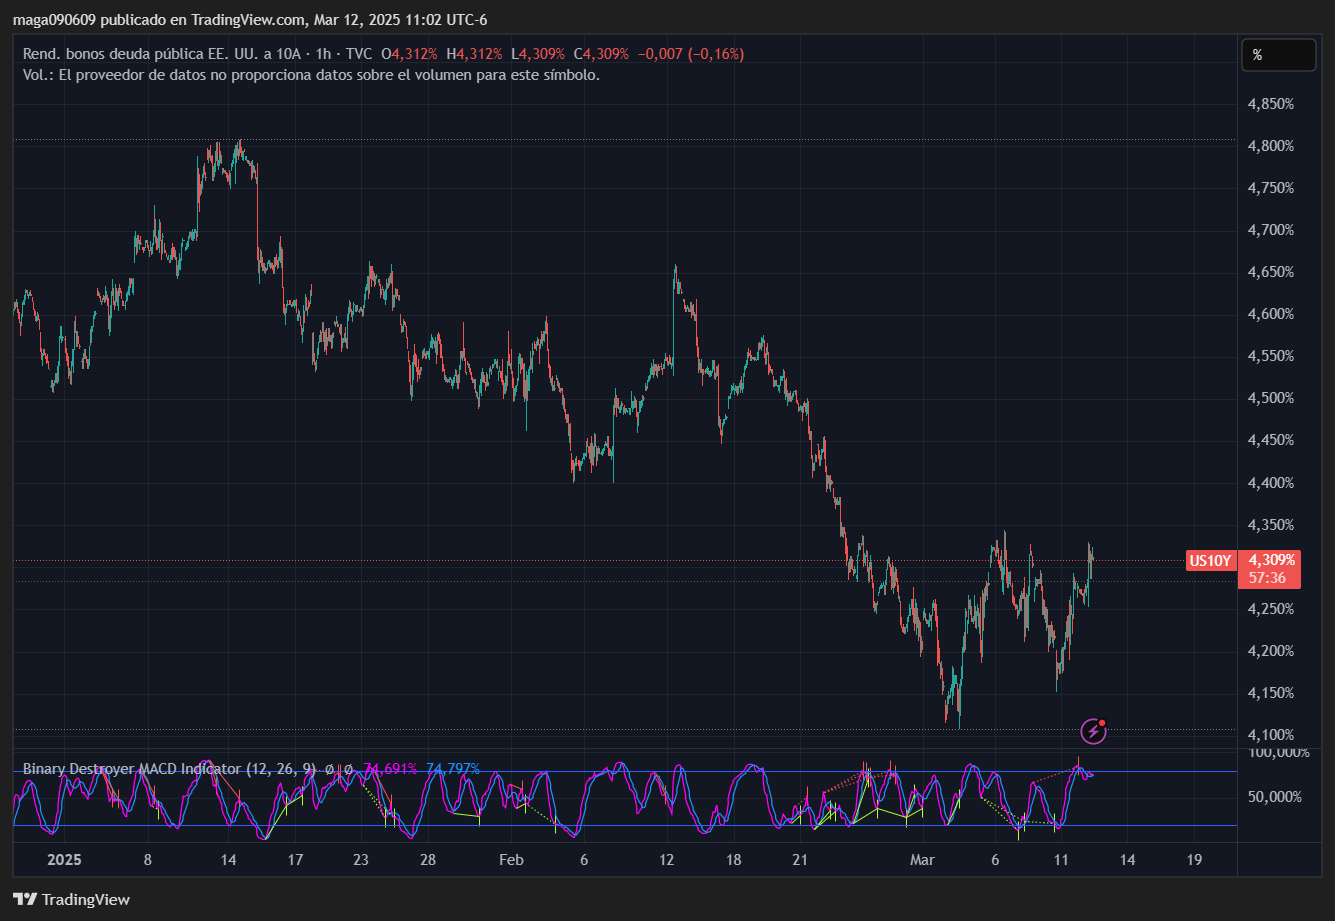
After the initial positive reaction, yields went up again to 4.3, and the rate cut expectations were further pushed until June.
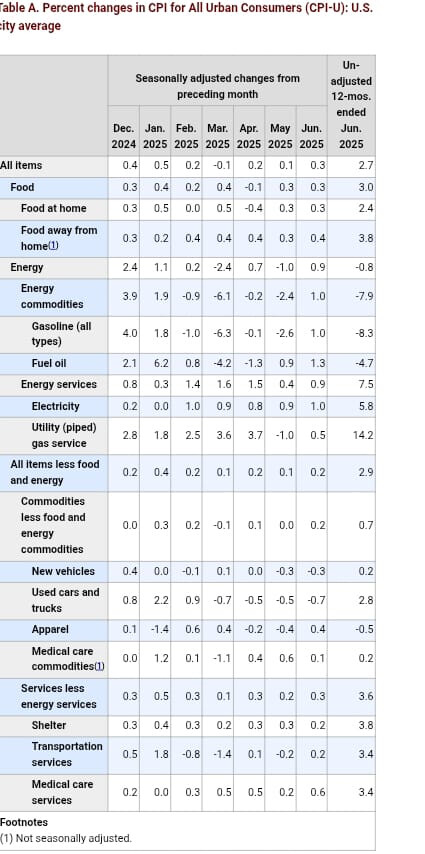
Shelter 0.3% m/m vs 0.4% last month due to hotel rates moderating (0.2% m/m). Shelter is now 4.2% y/y vs 4.3% last month. A positive development on this component is continuing progress even if slow, but still the one contributing the most to core services.
Super core moderating significantly during the month (0.22% m/m, 3.7% y/y), however remains relatively high but with progress. However, without public transportation (being dragged down by airlines), it would have still been a relatively hotter reading (0.4%)
Core goods have recently ticked higher (currently 0% y/y after being negative for months), not providing much disinflation anymore, and if tariffs add to price pressures, this is where you are likely to see it first.
Overall a very cold report, but due to the tariffs turmoil and the risks this means to the upside, the market did not even care about these results today, and both stock and bonds prices declined.
One could think that this type of data would put more confidence in the FED to cut in case is needed soon, but I still think they will not ignore the risks to inflation pressure as easily.
Market Still pricing 4 cuts in 2025
Transportation was the primary driver of the negative super core reading, due to airlines fares continuing to decline significantly, but motor vehicle insurance also declined (not expected to be sustained due to tariffs on autos)
Inflation rose 0.1% in May, less than 0.2% forecast
Inflation rose 0.1% in May, against expectations to stay steady at 0.2%.
On a yearly basis, inflation was up 2.4% as expected.
Core inflation rose 0.1% and 2.8% compared to forecasts for a 0.3% and 2.9%.
S&P 500 futures rose 0.4% while Nasdaq 100 futures gained 0.5% following the report.
The report signals that consumers are yet to feel the pinch of the tariffs, probably because the most punitive ones are on pause or companies have found a way to absorb them.
I=7 S&P 500 futures rise 0.5% as CPI comes in line with the estimates
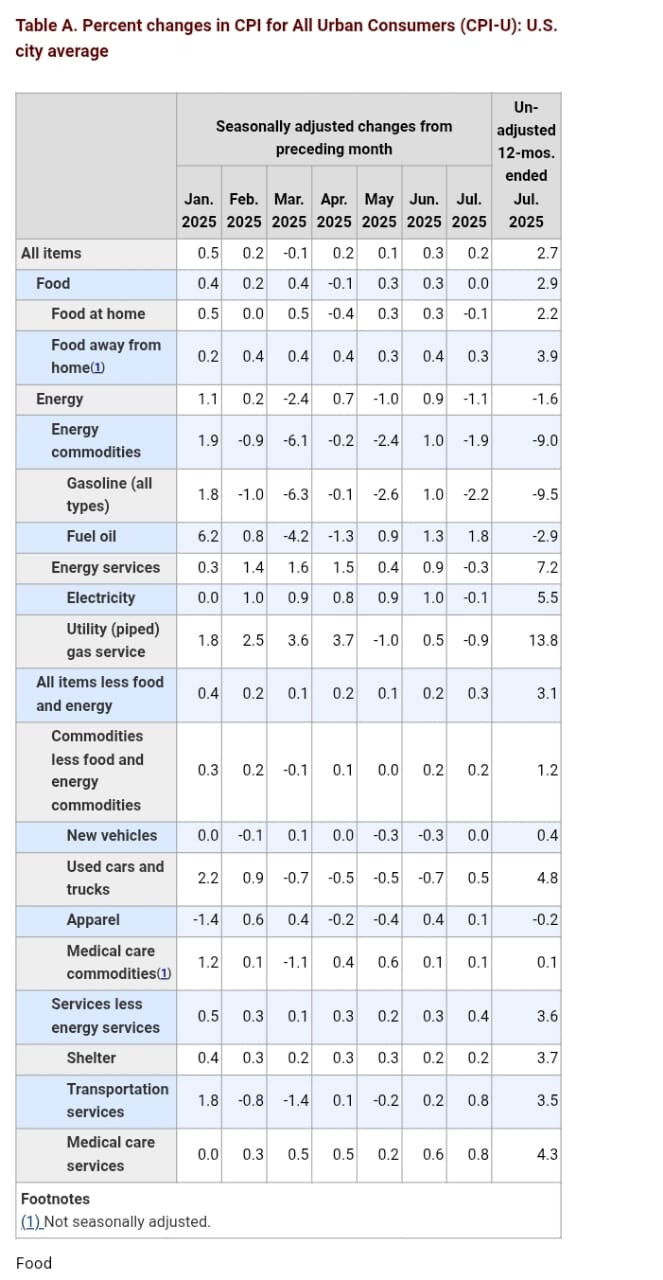
CPI rose 0.2% in July, in line with the estimate and down from 0.3% in June.
On a yearly basis, CPI was unchanged at 2.7% versus 2.8% estimate.
Core CPI rose 0.3% on the month, above 0.2% in June but in line with the estimate.
Core CPI was up 3.1% on a yearly basis, above 3.0% estimate and 2.9% in June.
S&5 500 futures rose 0.5% while Nasdaq 100 gained 0.8% as the report signaled inflationary pressures look manageable and boosts the probability of the fed cutting rates in September.
Services prices rose 0.4%, the most since the start of the year led by the biggest jump in airfares in three years.
I=8 CPI rose 0.3% in September, below 0.4% estimate
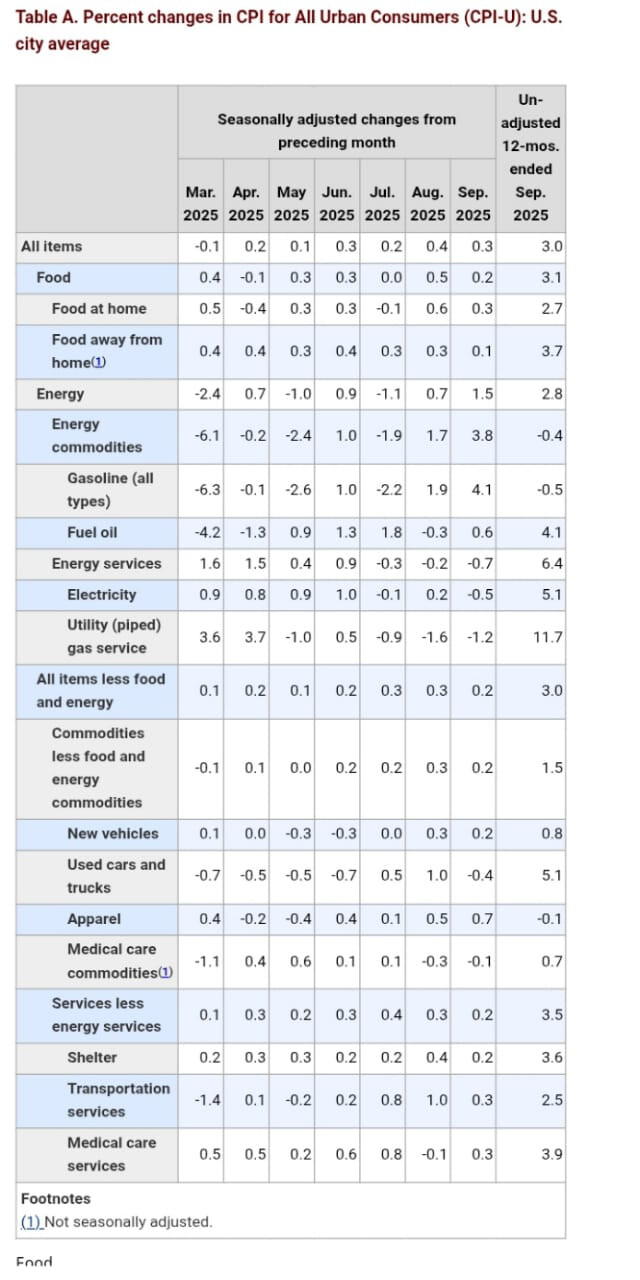
CPI rose 0.3% in September, against expectations to stay unchanged at 0.4%.
On a yearly basis, CPI rose 3.0%, below 3.1% estimate but up from 2.9% in August.
Core CPI rose 0.2%, below 0.3% estimate.
On a yearly basis, core CPI rose 3.0%, below 3.1% estimate and unchanged from August.
S&P 500 futures gained 0.7% while Nasdaq 100 futures added 0.9% following the report.
The report keeps the fed on course to lower interest rate next week. It is expected to cut interest rate by 25 basis points next week from the current target range of 4%-4.25%.
I=9 Core CPI rose 2.6% in November, below 3.0% estimate
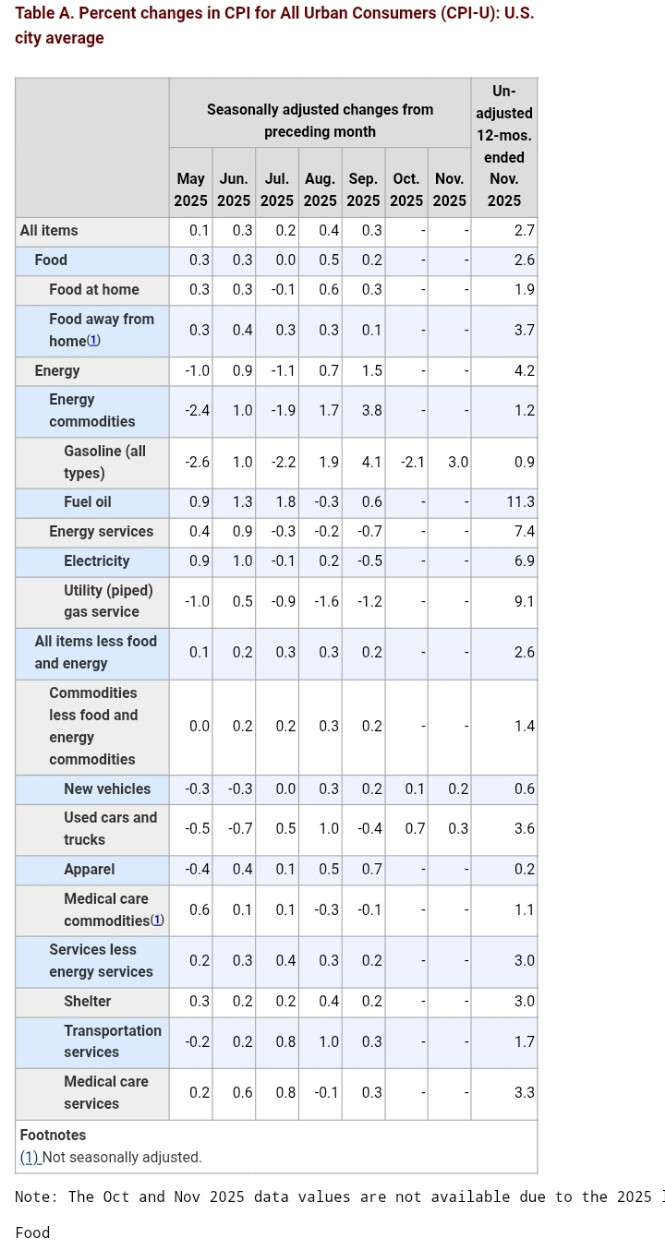
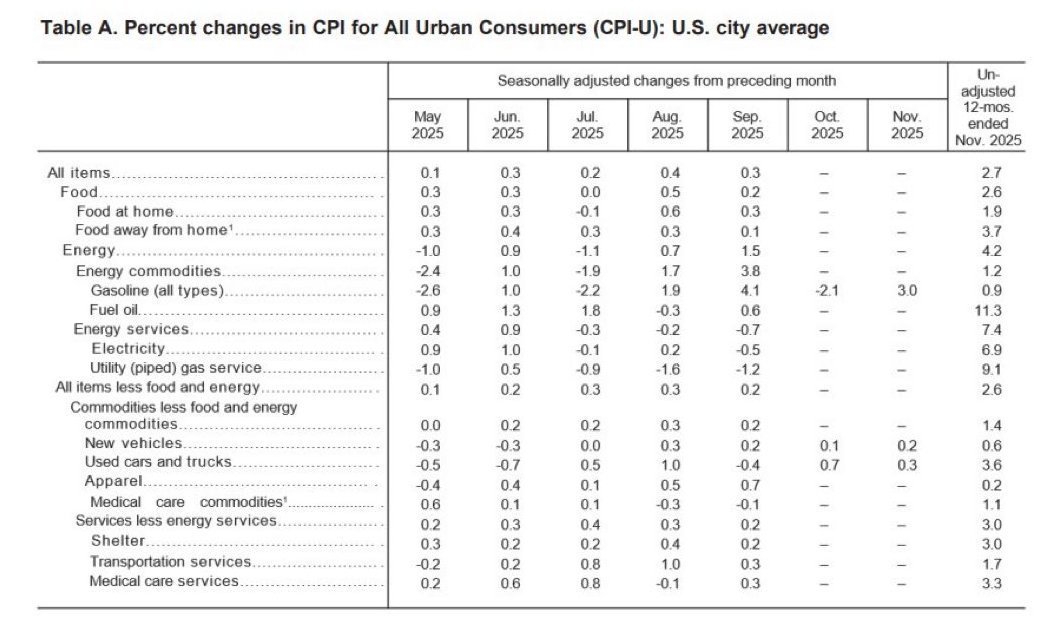
November headline CPI rose 2.7% y/y, below 3.1% estimate while core CPI rose 2.6%, below 3.0% estimate.
Nasdaq 100 futures up 0.9% while S&P 500 futures rose 0.5% following the report.
There are no month-over-month changes since the October numbers were never released due to the government shutdown.
BLS said the core CPI rose 0.2% over the two months ended November, 2025 and that CPI data collection resumed on November 14, 2025.
Reuters noteseconomists think the surprise was partly technical because data collection was delayed late into the month, when holiday discounts were more prevalent.
Supercore services inflation gauge rose 2.7% y/y in November, the lowest reading since 2021.
Fed Chair Powell said last week the CPI data may be distorted due to the government shutdown which ended in November 12.
There were a lot of data collection issues due to the government shutdown. A lot of missing or only partial data collected. Not data that can be trusted for now.
Economists also flag methodology issues around Shelter, which makes up about a third of the index.
“It appears that BLS made a big judgment error in its shelter calculation (effectively assuming 0 in October), leading to inflation understated,” Harvard economist Jason Furman said in a post on X. “It is, however, very unlikely this error was political. If anything the opposite: they stuck to algorithm rather than using judgment.”
UBS economist Alan Detmeister said the price changes in October for the owners’ equivalent rent (OER) appear to have been “set to zero.”
I=5 New York Fed President John Williams said “technical factors” distorted November CPI
“There were some special factors of practical factors that really are related to the fact that they weren’t able to collect date in October and not in the first half of November. And because of that, I think the data were distorted in some of the categories, and that pushed down the CPI reading, probably by a tenth or so,” Williams said on CNBC’s Squawk Box.
“It’s hard to know, we’ll get some when we’ll get to December date, I think we’ll get a better reading of how much that distortion, how big the effect was, but I do think that that was pushed down a bit by these technical facts,” he added.