Consumer Earnings, Savings and Spending

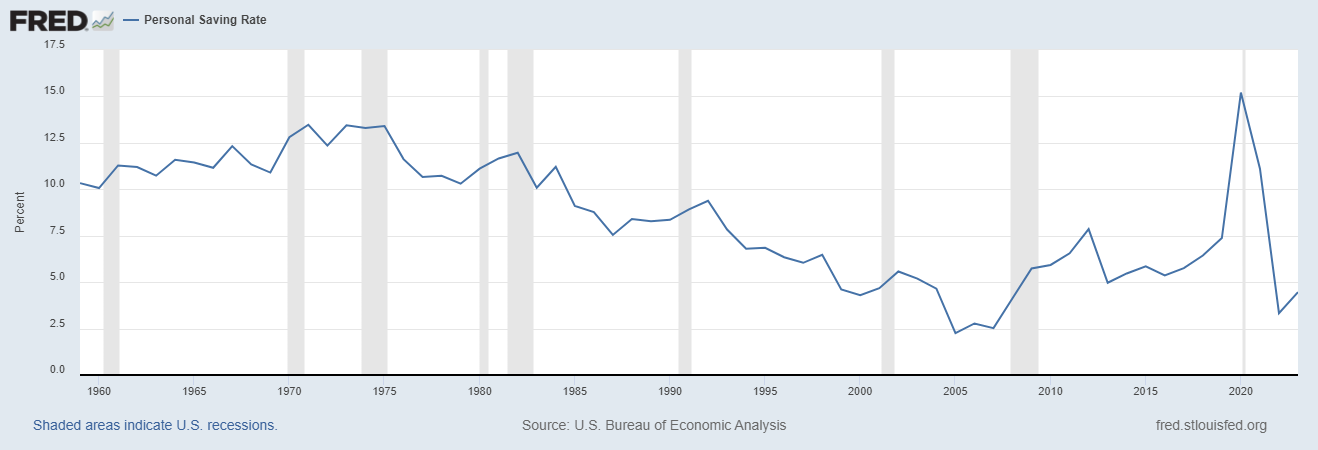
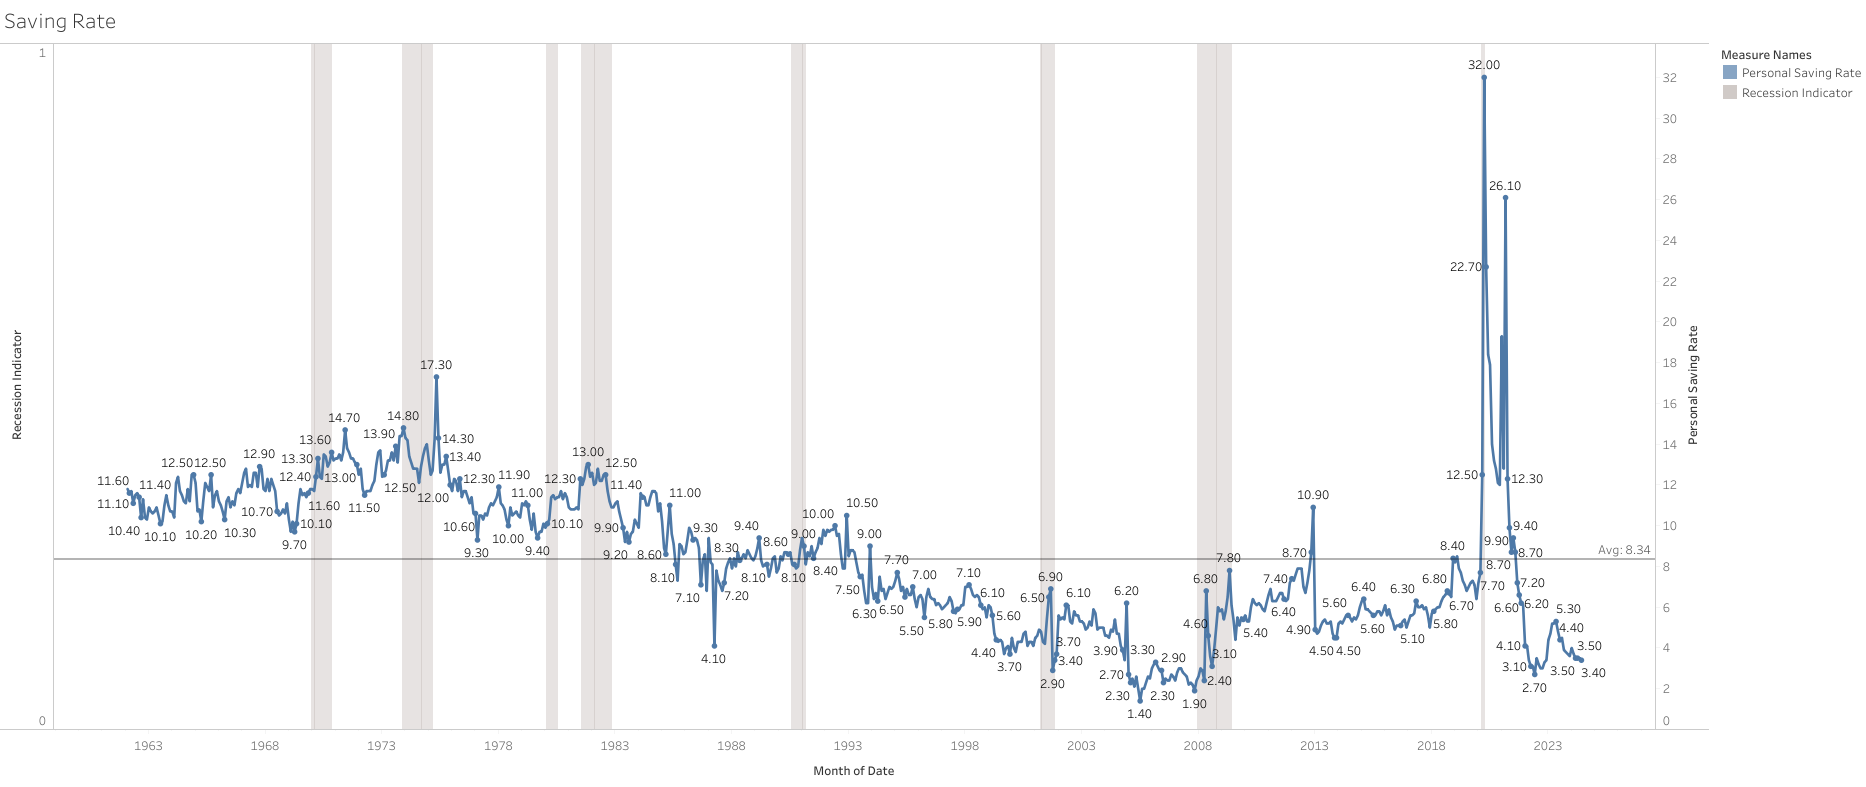
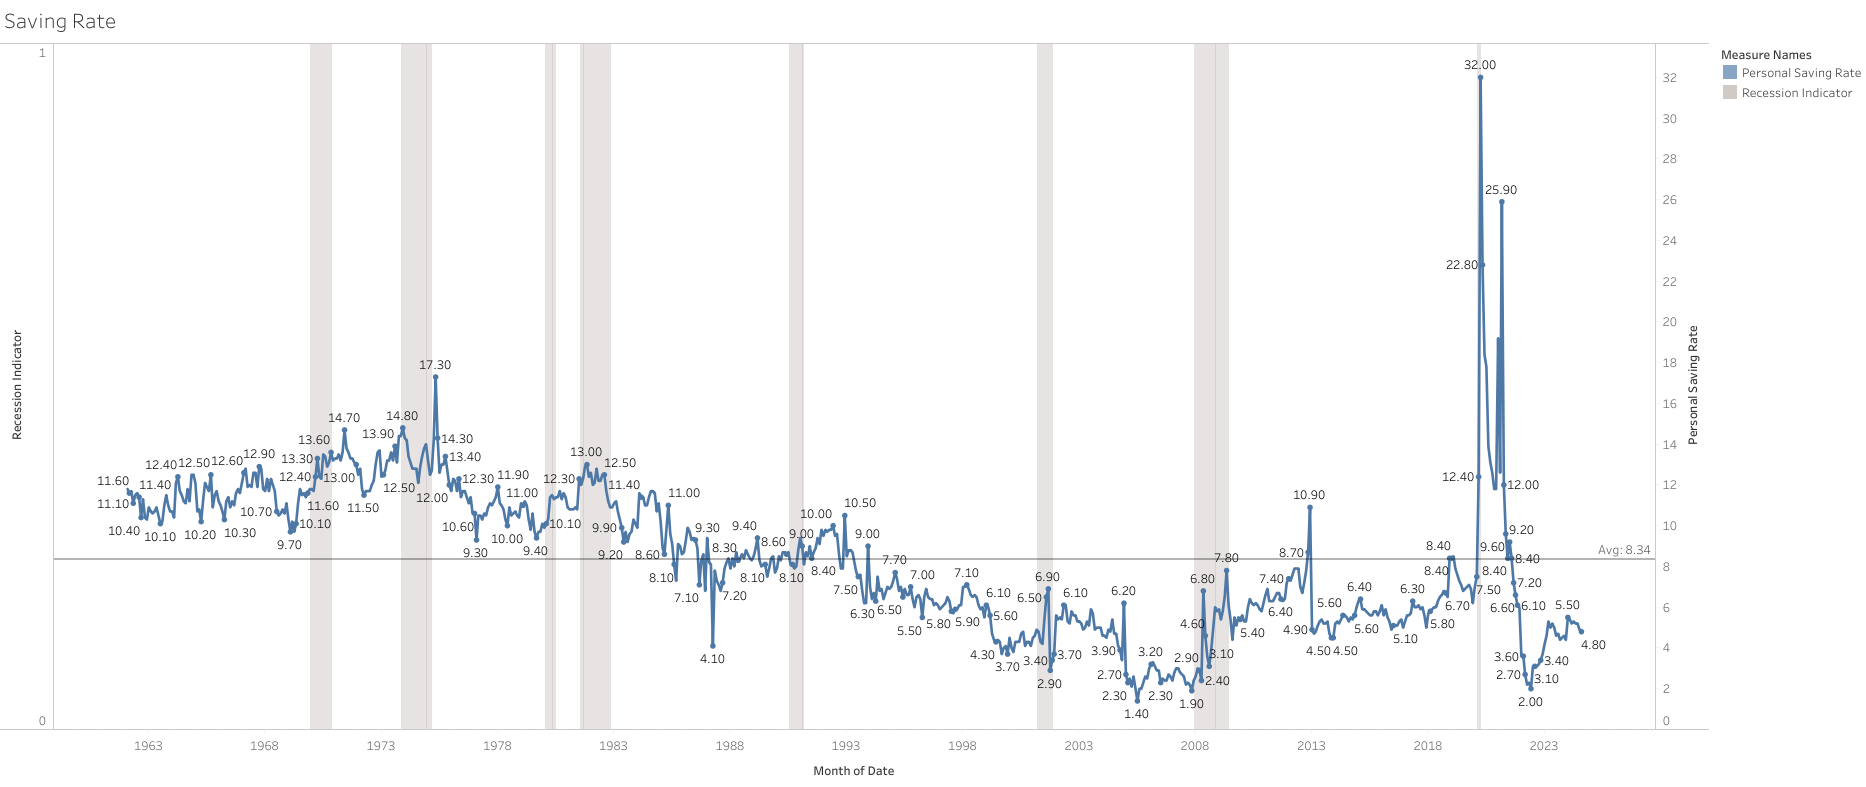
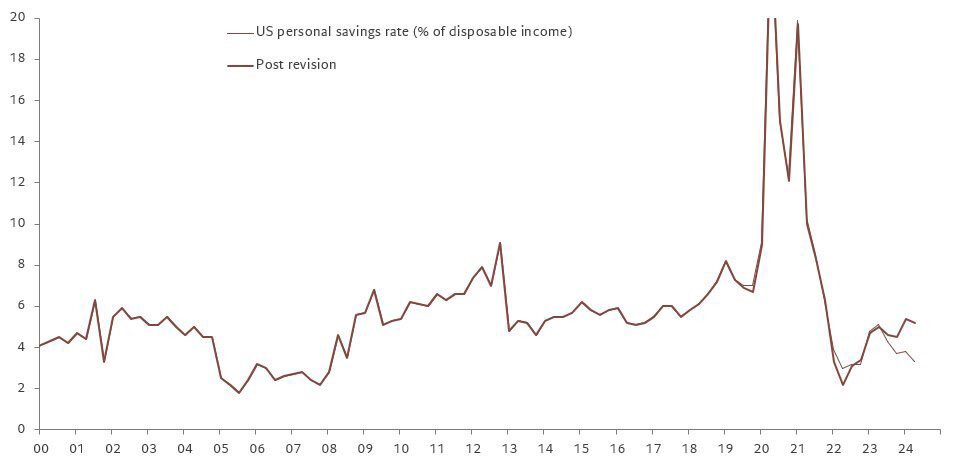
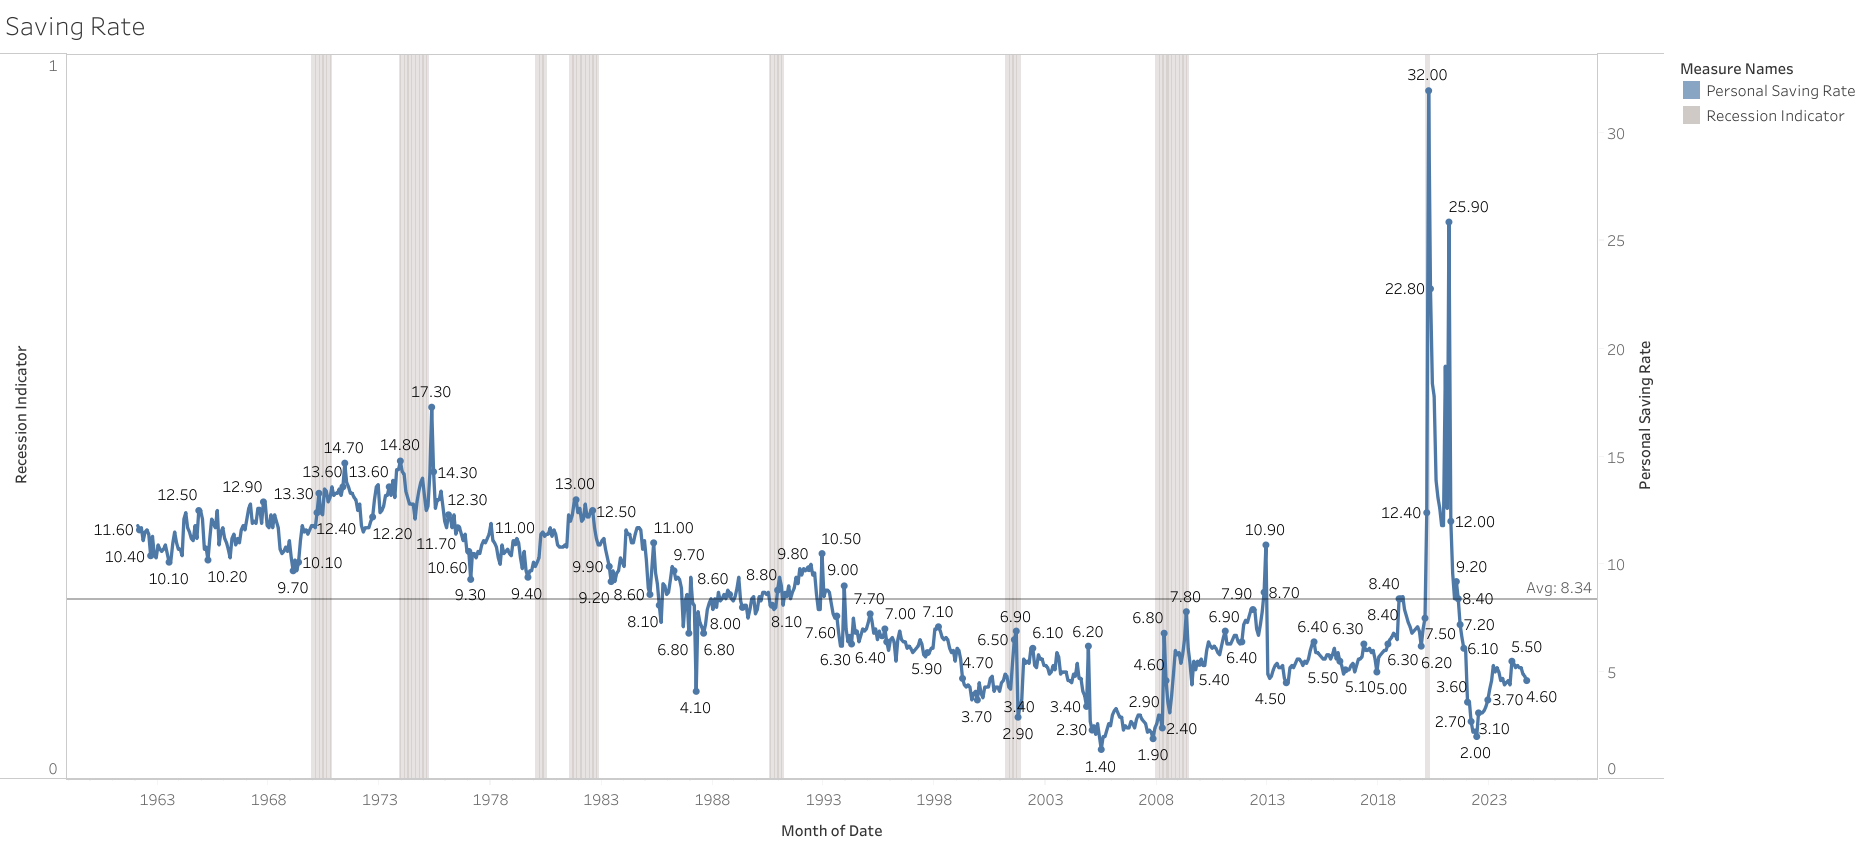
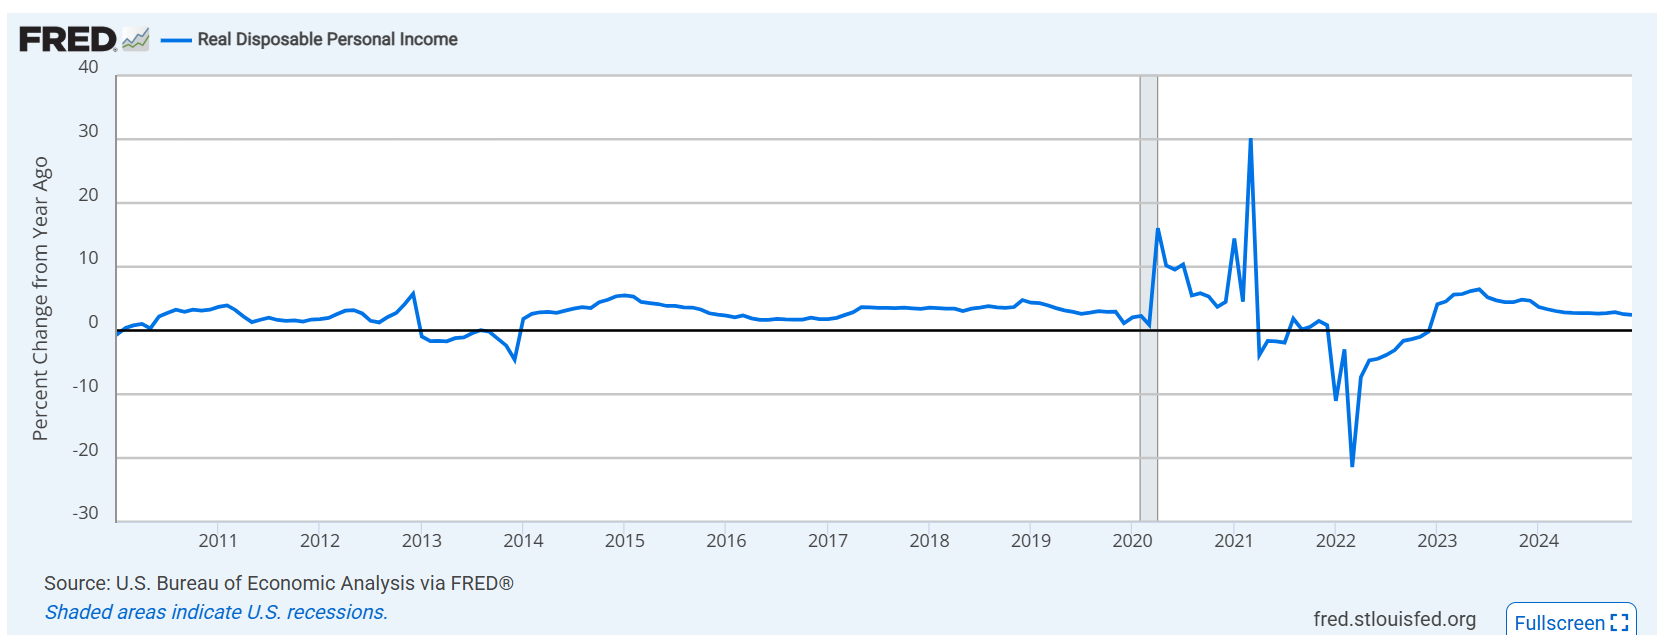
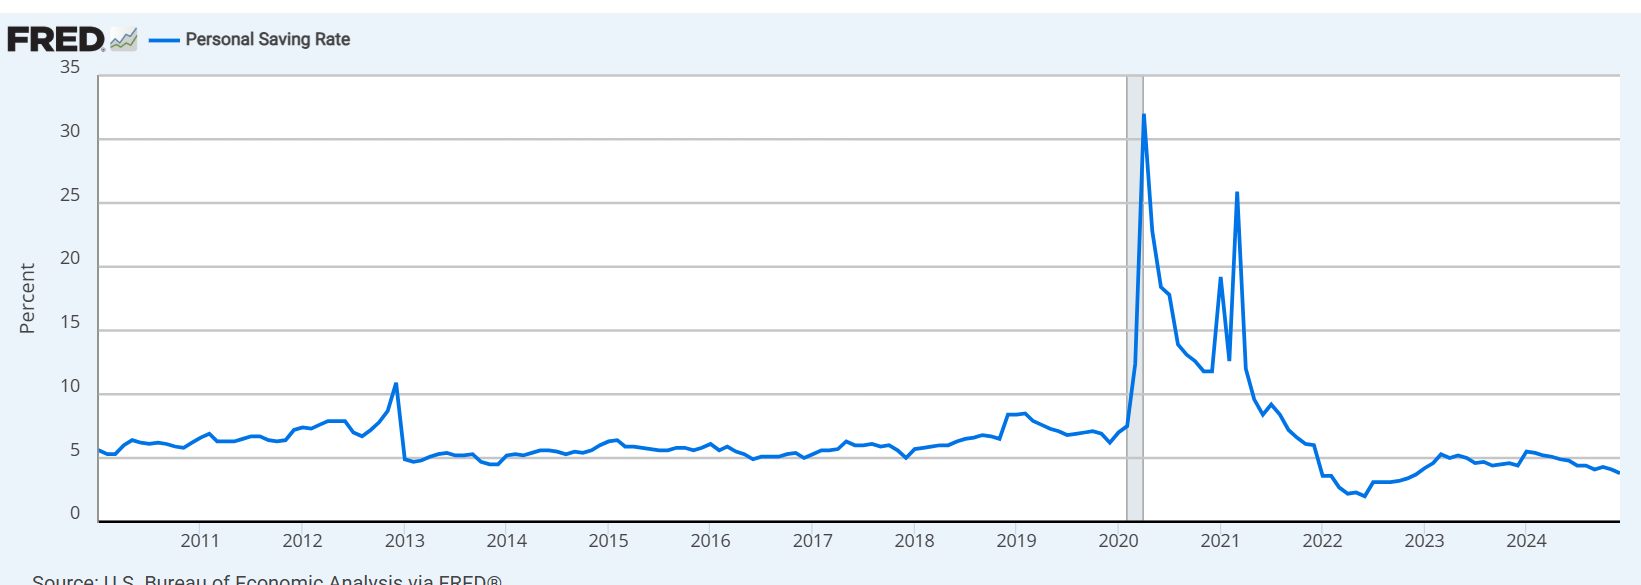
I dont think you cant simply say a trendline is too optimistic and that’s it. Since 1960 the avg and median saving rate is ~8% of disposable income, so pre pandemic savings were on par, actually a bit lower than that (avg 2010-2019: ~6.1%, avg 2016-2019: ~6.2% ).
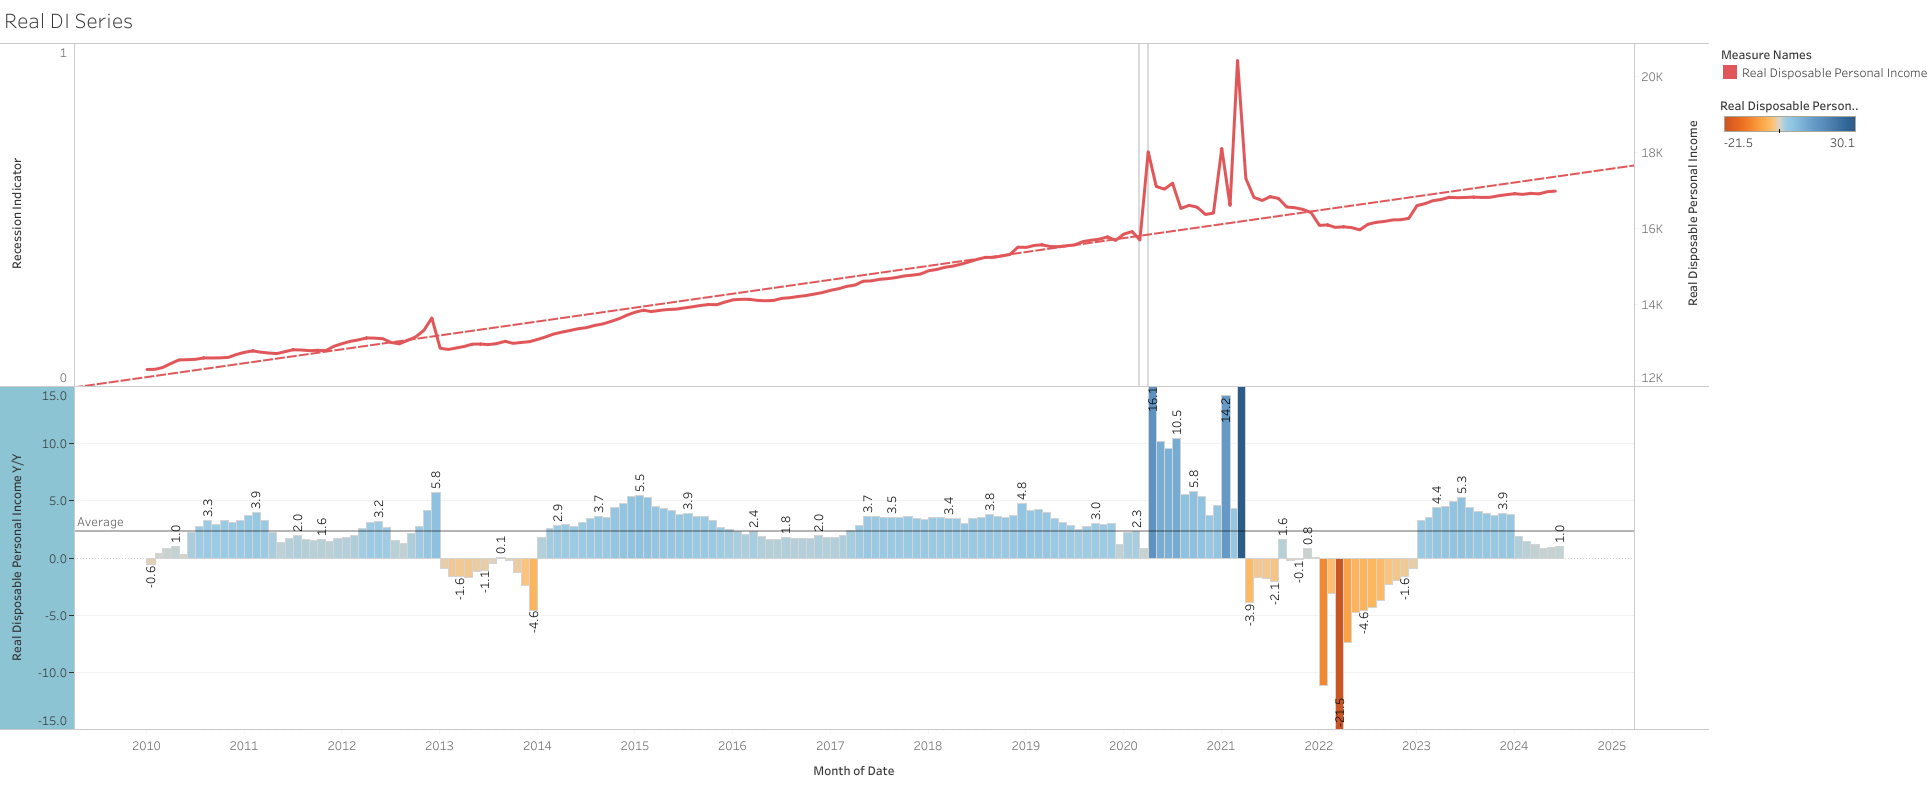
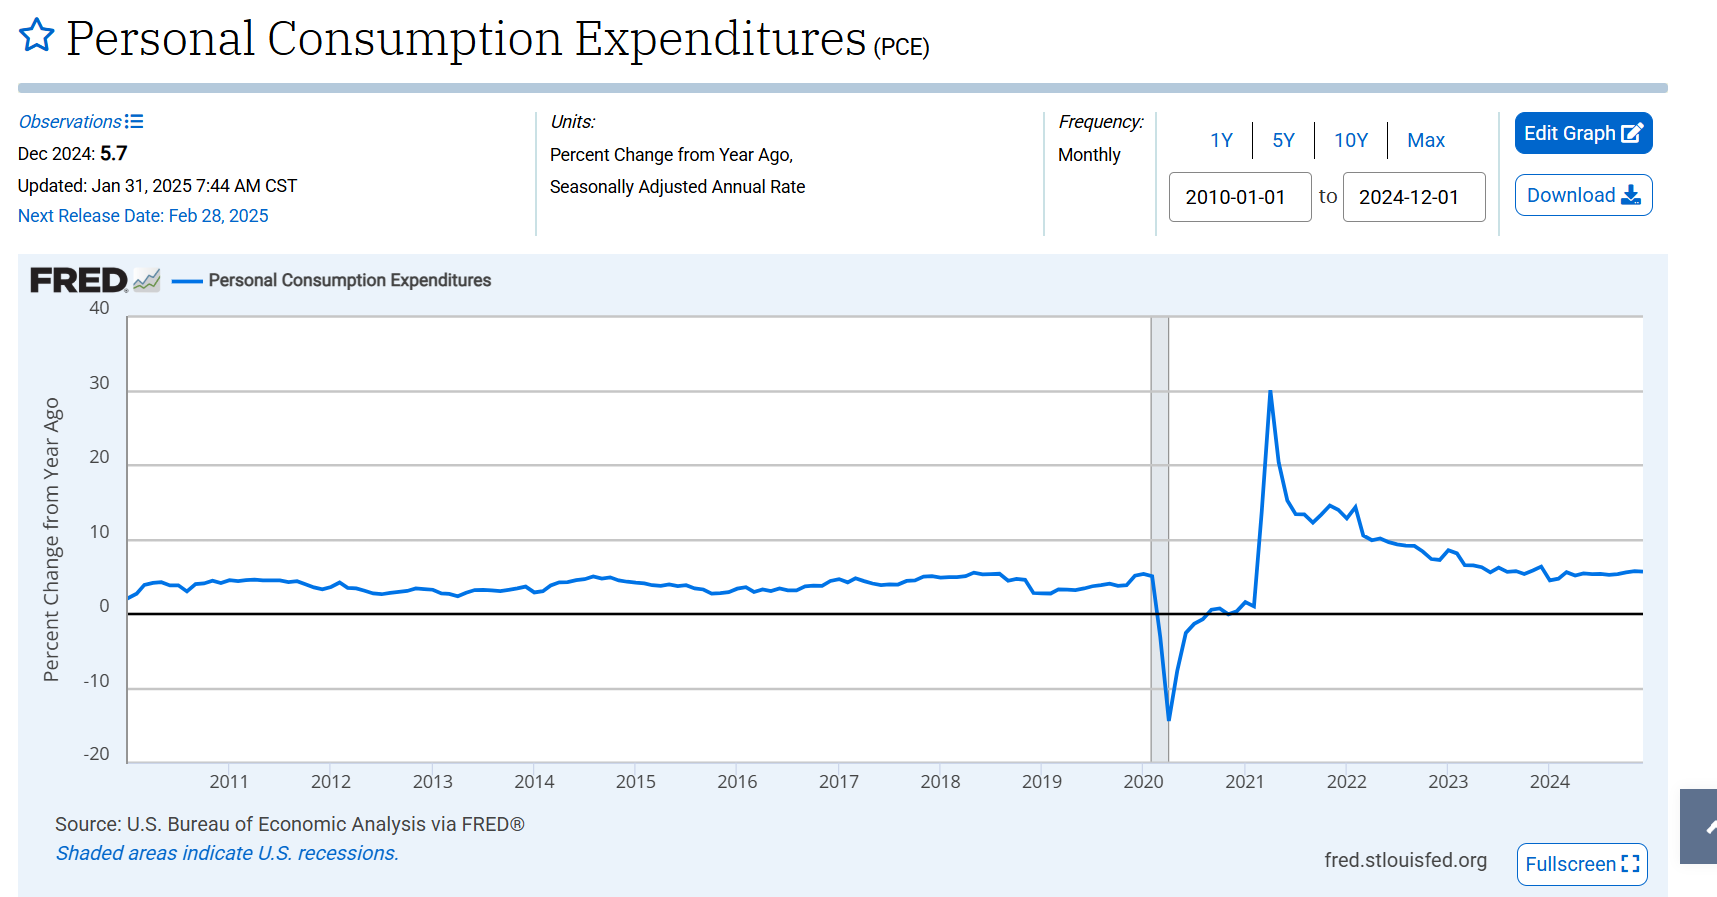
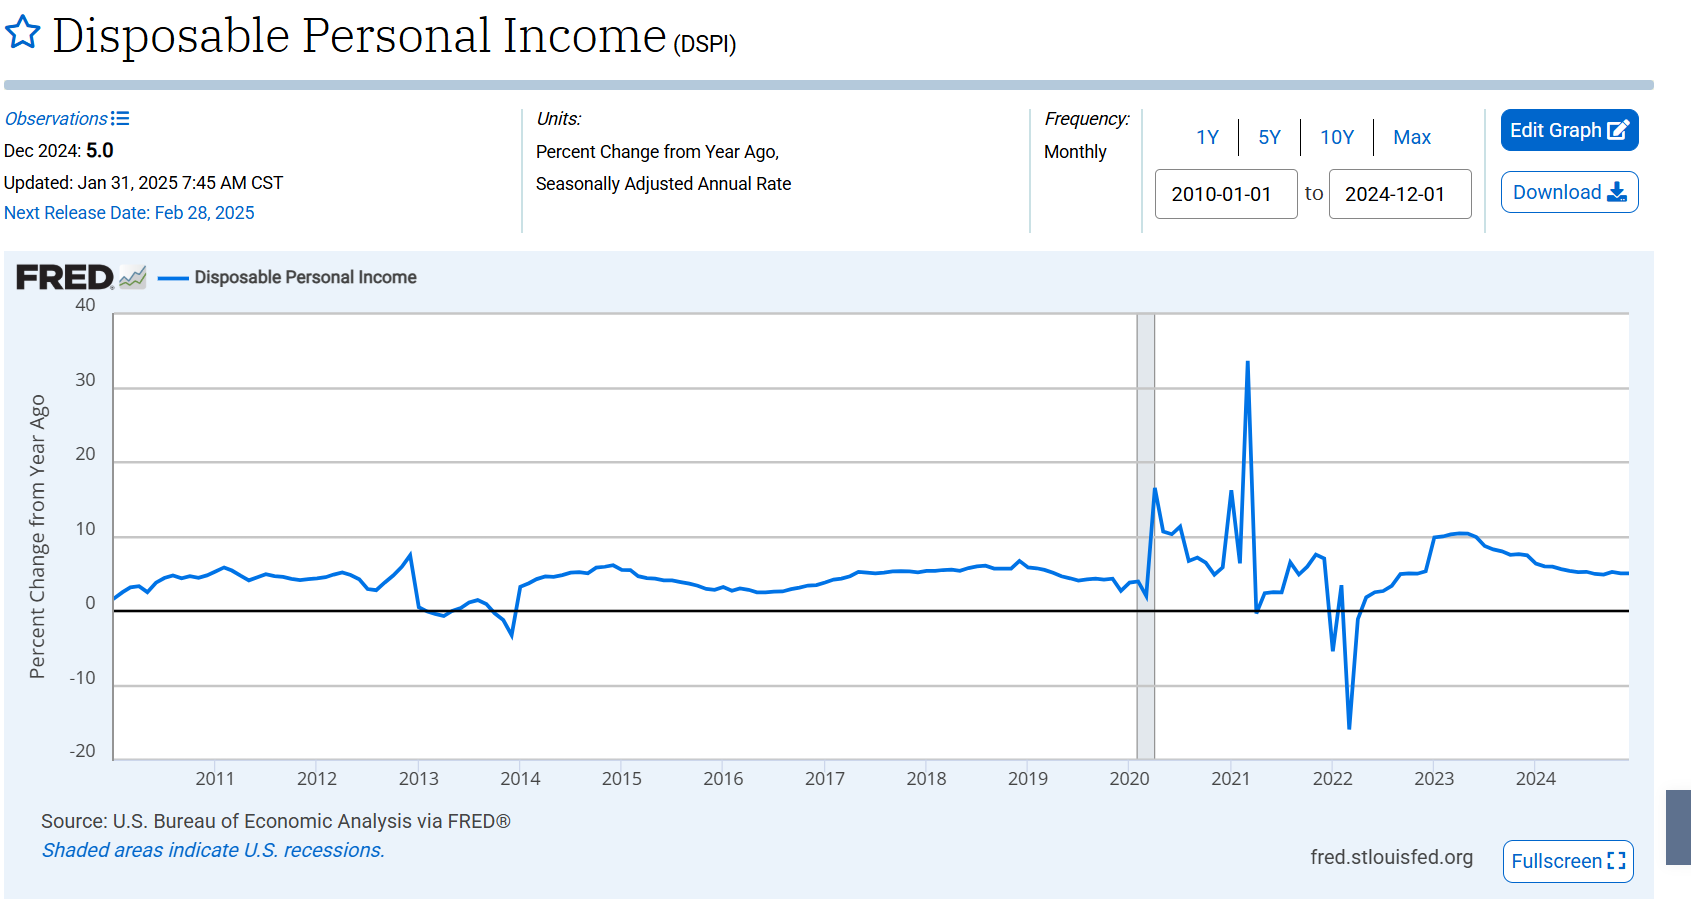
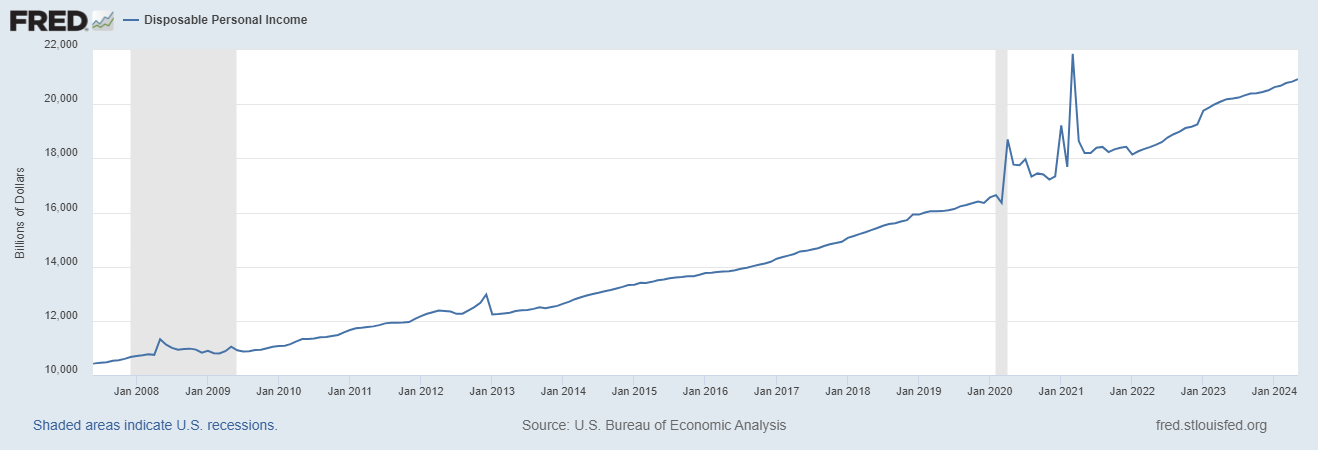
The increase in nominal personal savings since 2016 is mostly due to disposable income growth during this period, not necessarily saving rate increases.

If you think there has been a structural change in consumer saving/spending behaviors that led to a lower than 6% saving rate permanently or a change in consumer income growth trend (which has not been the case until now) that led to a lower savings cycle now, you need to outline your compelling reasons why that is.

I think in this regard if we enter a structurally higher rate environment, savings could be lower due to more money going to interest, but I also don’t think the very low current saving rate will be the new normal either. It could probably be somewhere in the middle, or closer to 6% even.
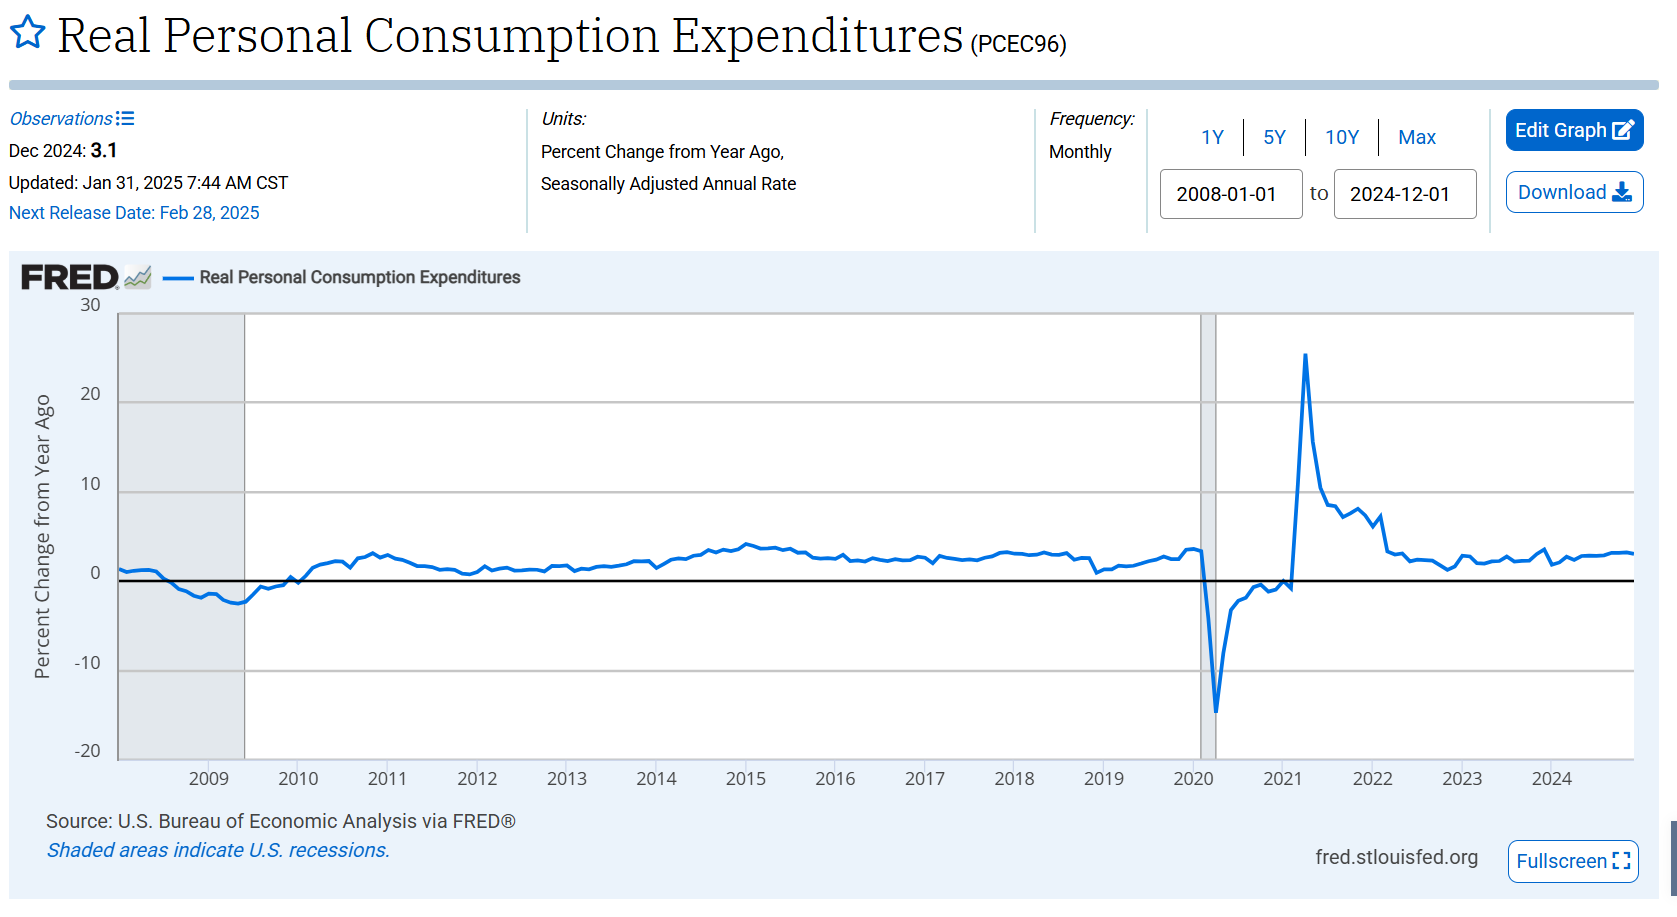
But we also don’t know if people instead of savings will adjust spending over time, and the saving rate will go back up to the mean again, or if growth in disposable income will compensate for that.

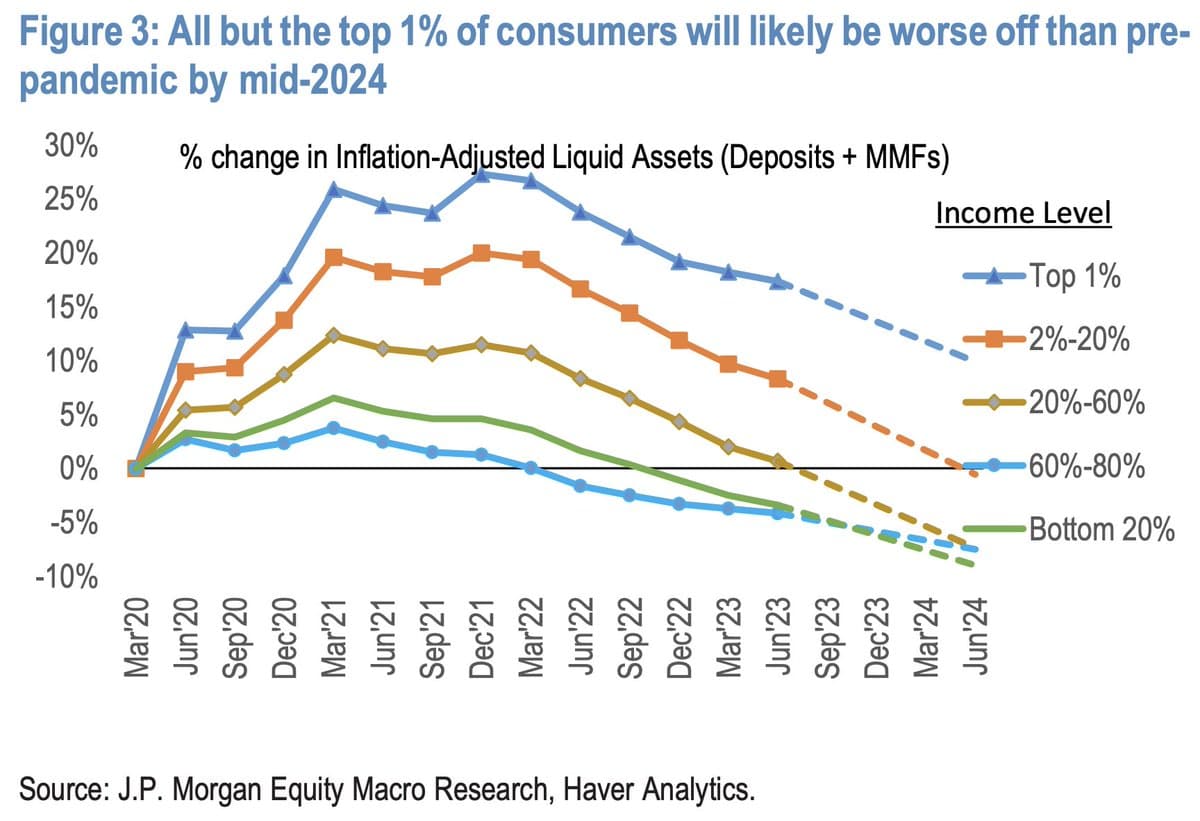
But yes, some excess savings could still be there on other scenarios, but I would not expect to be that much either as I would not do any extreme change, and I would argue for now if it is the case, they are probably mostly now in the hands of the more wealthy, who don’t have the propensity to spend them.

So yes, agree, that savings and income in lower percentiles could be more important, however, data by cohort is not the best, but I will try to see what I can find.

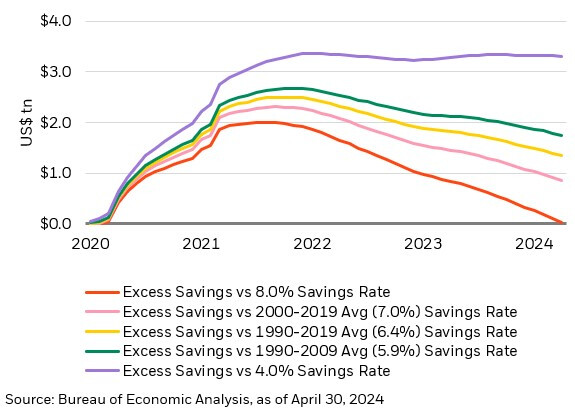
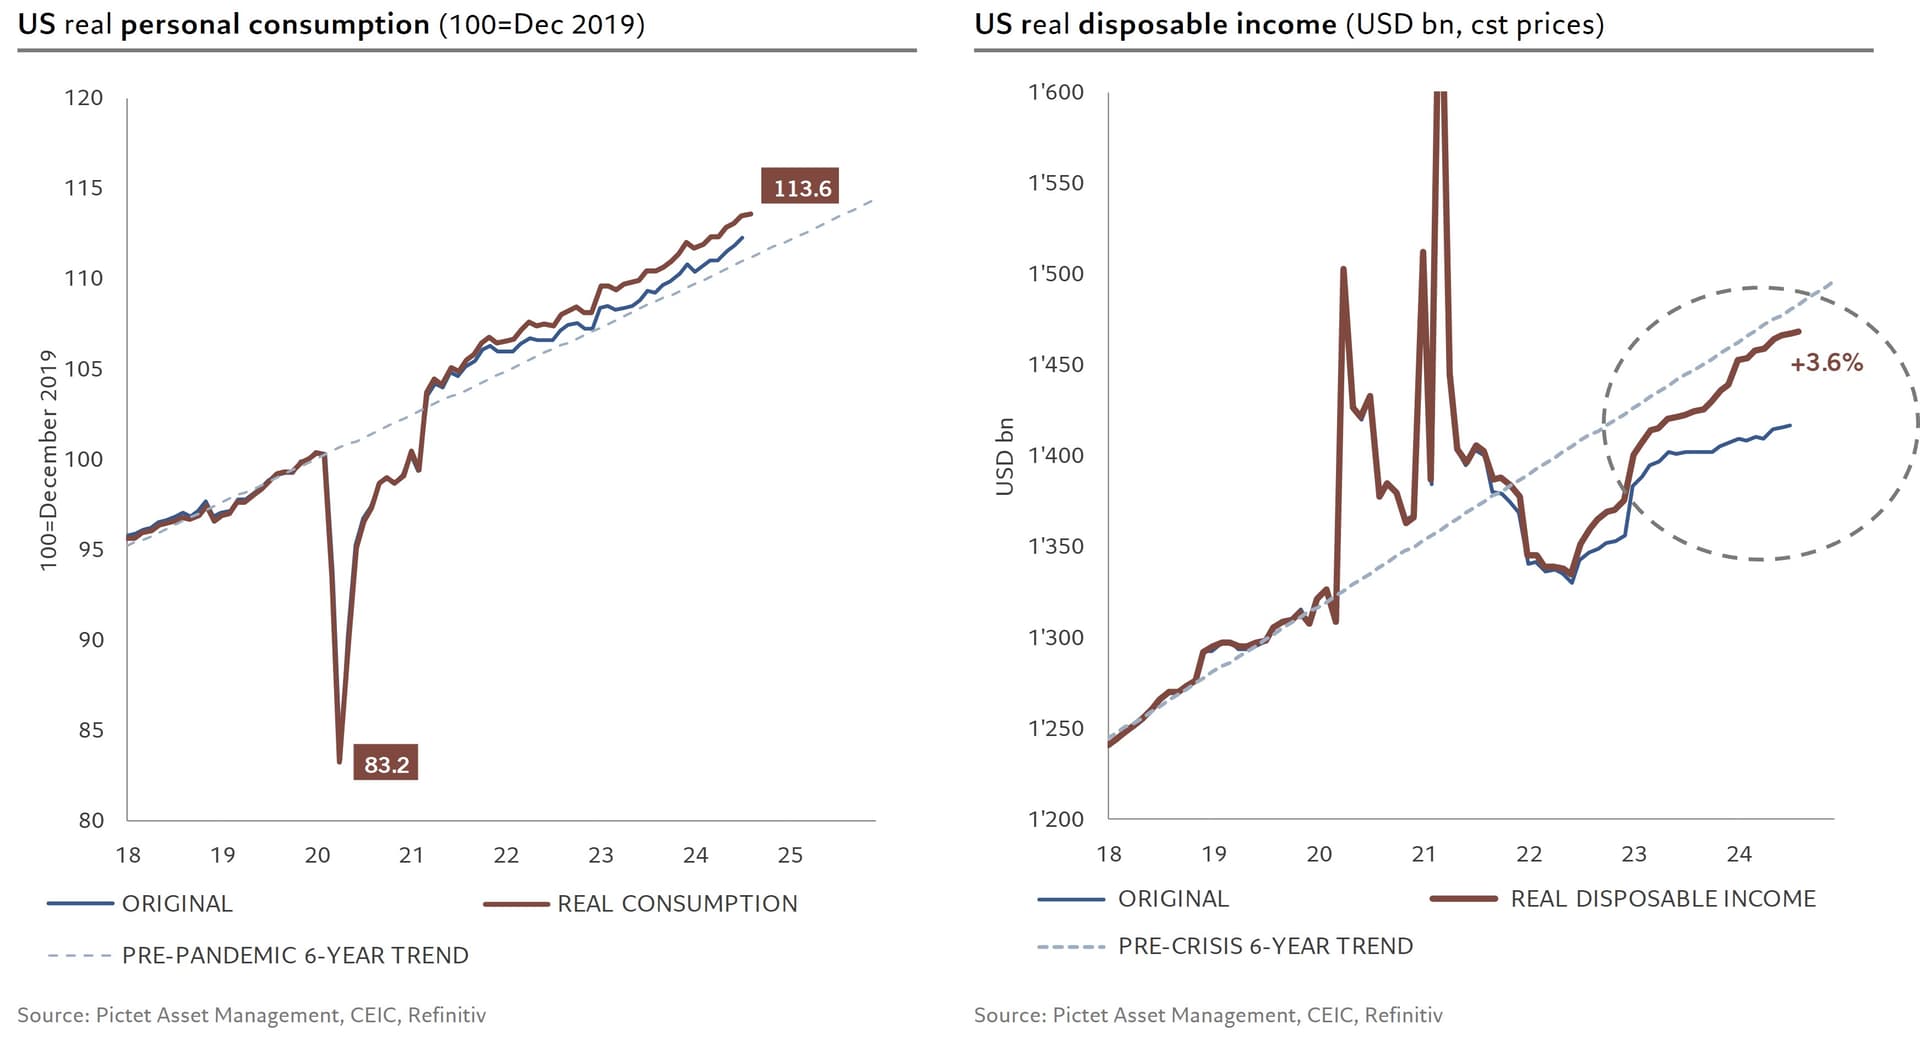
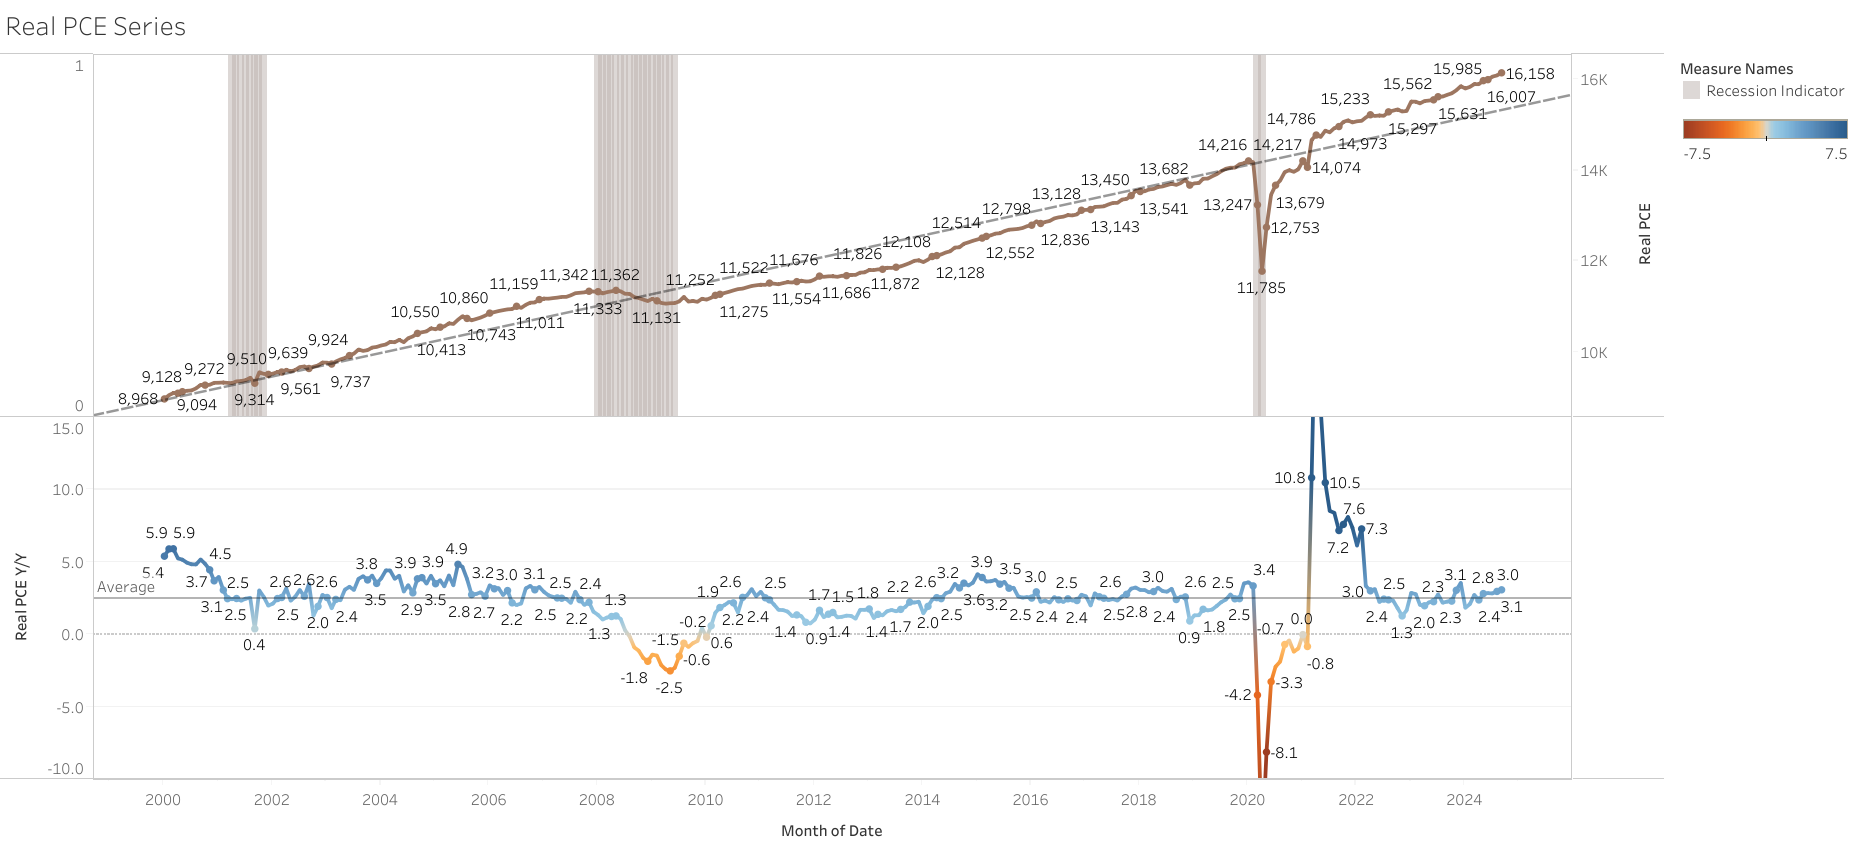
If people misleadingly use the chart on other sites, that’s another problem. The researchers were clear in their methodology and acknowledged the fact in the post that the analysis would change if a different trend was used.
So, what I would say is they probably should have done/publish different scenarios, as with everything is always best.

Yes, sorry, I don’t know where 32T came out, is only 18T in liquid assets.

Unfortunately my structural understanding of the savings rate overall is low. That makes it very hard for me to tell how it should develop in the future, but I obvs. agree that it is low right now. If we would find that basically only the rich are saving and everyone else is running out of money and needs to start saving then we can predict that consumer spending will become an increasing problem going forward. (Maybe we can even model this)

Yes, i think i would have preferred it if they would have used different scenarios with different saving rates and compared excess savings to those scenarios. So as an example comparing excess savings with a constant 5, 6 or 7% savings rate.

I agree that exact excess savings are not very relevant because the money is likely in the hand of the more wealthy anyway and the difference to other scenarios is not enormous.

Nevertheless, here my methodological argument in more detail, why I think the trendline approach in this case with the specific timelines they’ve used was a bit aggressive:

  • They chose a 4 year period in which monthly savings rose by around 50% in total and extrapolated that into the future. (Dataset in article)
  • Expectable disposable income growth was more in the 6.5% yearly range based on long-term trends.

→ Except in a scenario in which disposable income growth suddenly doubles, they predict that the savings rate will constantly rise every year using the trendline as savings grow faster than income.
The extrapolated savings rate in Q1 2024 was already 8.9% and would have gotten higher if projected further out.
(Q1 2024 extrapolated and annualized savings rate of 1,850.8M / Q1 2024 disposable income of 20,721.8M)

I think if we use extrapolations & trendlines ourselves, those are the kinds of things we need to be careful about.

But I don’t think you are doing this correctly, you are comparing hypothetical savings vs actual disposable income. In any case, an extrapolation of disposable income would also be needed to see if the savings rate is indeed increasing.

The economy is currently very different compared to pre-pandemic, and I don’t think a hypothetical savings vs. actual income analysis is correct.

Trendlines or extrapolation are not projections/forecasts either. I don’t think anyone is thinking or arguing savings should be 1.8T annually currently, due to all the shocks and changes that happened since then.
They are simply useful to analyze broken trends or changes in the economy, and the consequences that this could have, if its permanent or temporary, etc.
If any indicator was as an eg. growing 10% per year in 2010-2019, and now is only growing 5%, obviously there is a gap opening between what the economy or sector was used to and the current reality, that would be important to understand and analyze the implications of this.

So,this analysis is just hypothetical to analyze how a consumer could feel about their level of savings vs 2019. It just simply says that if the before-COVID trend would have continued, the consumer would have already accumulated this amount of savings, so everything else equal they currently probably don’t feel better or worse than how they felt (or got conditioned in those years) in 2019 about their savings (I would argue they are feeling worse actually, but not because of this).

I don’t think anything is wrong with that, since is just to analyze their sentiment about it, not to make a projection. It is indeed true that since 2010, the consumer was used to accumulate a significant amount of savings. It was maybe aggressive, compared to other periods, but psychologically speaking they got used to that growth in their savings.
I actually think that if this changed, and now savings growth will be lower, is a shock to the consumer going forward that could maybe change some of their behavior, but I am not clear about the consequences at the moment (good or bad), or if it has any that is significant enough.

I actually considered that and ran the numbers before my last post.
From 3.2020 to 3.2024, disposable income grew by 26.7%, which is remarkably similar to long-term growth rates. Therefore I decided to ignore the differentiation in my explanation, but I agree with you that this is not the best practise and it’s better to be clear and precise.

So, if we stick with the same methodology and extrapolate disposable income growth rates of 18.5% between 3.2016 and 3.2020 into the next 48 months, we would arrive at a theoretic disposable income of 19,303 and a savings rate of 9.6% by 4.2024.

To be very precise on your arguments as well:
I don’t believe that one could justify a purely numbers-based study that uses an aggressive temporary trend as it’s core premise by bringing up arguments about sentiment that the study itself does not mention, explore, or display.

Don’t get me wrong, the argument is interesting, but we have no idea what caused the increase in savings between 2016 and 2020 or before and how “people” actually felt about it.
So, arguments about sentiment are another train of thought that cannot justify why someone is using misleading trendlines.
We actually need to be vigilant in spotting misleading methodology as early as possible always because people can be sloppy or lie with statistics, and a failure to detect those could lead to judgment mistakes on our side.

A few more thoughts about sentiment and savings rate:
There is obvs. not “people” or a general sentiment but different social milieus (I think this framework is interesting), different demographics etc. This means a higher national savings rate could affect the sentiment of an individual person or not at all (depending on if this person is related to the increased savings rate.)

As for the causes, why the savings rate was higher and is now lower I don’t want to speculate too much, as there are probably studies about the topic but ideas include (you probably already mentioned most of them)

  • back then people saved more towards homes + paying down mortages - a strategy which is unattainable by now due to higher loans + high real estate prices. Therefore people consume more.
  • Economical/thrifty demographics are retiring by now and younger demographics appear to spend more on status symbols/be more materialistic/short term thinking.
  • Real disposable income growth was likely disproportionate/uneven among people with many getting no or minor salary rises while inflation rose. Therefore they got into a situation in which they could not save more. (And it was not an active decision to spend more like it was likely in other consumer groups)
  • Support programs during Covid could have let some people into more careless spending and less saving esp. in 2022.

Sorry I shouldn’t have used the word sentiment or felt, because I did not want to imply to know if consumers feel good or bad in terms of emotions.
I agree real sentiment is very difficult to measure, and would be very difficult to separate the sentiment coming from savings only too.

My point was that these studies aim to analyze whether certain conditions are better, worse, or the same compared to before a significant event happens, rather than making projections.
“Excess savings” is exactly that, refers to a period when aggregate consumer savings were significantly higher than what consumers were used to have before the COVID-19 lockdowns and stimulus measures.

These particular studies now just aim to determine whether this is still the case, to try to conclude if consumers still have some of this unusual incentives to continue spending as they did in 2021, 2022, and 2023.
Because what I still defend is that there is a psychological and behavioral effect when conditions change, that could influence consumer behavior, but I would like to research more about this.

I am by no means defending the SF Fed either; I don’t even know about them. However, this is the same type of analysis everyone is using for this purpose (even in other countries), with slight variations in assumptions.

I am more in favor of the analysis method used, as I find it interesting and valuable to think in these terms sometimes.

Would I have used different assumptions, probably yes. But given that the average saving rate since 1960 is 8%, I don’t see a problem with assuming it increases around that level in a hypothetical scenario. However, I also recognize it is more unlikely since the US hasn’t seen those rates in a long time, and at some point, it would have stopped growing as well.

At this point, I believe excess savings have become somewhat irrelevant and no longer significantly influence the economy. Therefore, I don’t prioritize knowing the exact amount of excess savings remaining, whether it’s $500 billion or zero.

Ultimately, no one truly knows the exact true, as any growth trend used is speculative. You might argue that the trend they used is too aggressive, but we can’t definitively say what would have happened without COVID.

So, my main critique of their study continues to be only that it should have included multiple scenarios: a very conservative one, a moderate one, and their current (“aggressive”) scenario, and probably assign some probabilities.

Yes, sure, I agree with all of this.

The thing is that one cannot compare reality with an unrealistic scenario and reach conclusions based on this comparison.
So while the study did not make projections it should have chosen more realistic scenarios what would have happened without COVID and assign probabilities to them as you describe it.

I would also argue that the SF Fed should be sophisticated enough to recognize that the trendline they have been using was too aggressive and would lead to wrong conclusions compared to probably 90%+ of scenarios that would have happened without Covid.

The problem I continue to have with your argument is that you can’t call this unrealistic, I don’t see it as completely 100% unrealistic and I don’t discard it either.
I also don’t give that low probability, lower than others more conservative probably, but definitely higher than 10%.
I struggle to see your justification for why it is so very aggressive as you say, other than because it looks that way.

In 2019, the saving rate had already increased to 7.4% on average (2016: 5.4%, 2017: 5.8%, 2018: 6.4%), and I don’t have clear reasons why it couldn’t have continued to increase during these 4.5 years since then to 8-9%.
Thinking about it, it seems more likely than not that it would have continued to slowly increase for some years more.

I would think aggressive if it’s over 15% or something like that, but 8-9% seems ok to me compared to history.
So, why do you think it couldn’t have continued to increase more without COVID?

More than interested in excess savings at this point, I just don’t want us to say something without having the correct reasons for it.
If we would do the same analysis, we would need to justify, why we think the trend would have changed after 2019, and savings rate would not increase anymore

So, if you can, I would like you to outline your reasoning for it, because I struggle to see it that way, and would be helpful to me in the future if I am missing something in my whole reasoning?

Note:
I think this methodological discussion is very important because it describes some core principles of how we think about extrapolations etc.
Writing more precisely formulated replies takes actually quite some time for me because I am not a good writer, and I am starting to fall behind on some other responsibilities, so please bear with me if my answers are becoming formulated a little bit worse or unprecise, and I might sometimes use the wrong words or forget to add some arguments. It would be great if you could imagine what I want to say with my arguments as much as this is recognizable or clear to you even if it is not formulated perfectly.

A few thoughts

  • The last time the savings rate was more consistently in the 8-9% range was in the 80s. I tend to heavily weigh data from different times in history lower because back then, there was a completely different economy.
    Therefore i also don’t think taking an average since the 60s for a quick assessment if something is reasonable is best because the economies have been too different. Instead, I usually prefer shorter timeframes. Note: I am not sure neither which timeframes are the best but maybe starting with the internet area after the dot com bubble burst or something like this sounds more reasonable to me.
  • Since the mid-90s, the savings rate was never above 8%, except for some outliers.
  • As said, they are using a very step trendline to extrapolate their non-Covid scenario. This makes the extrapolation worse with every year. They are only extrapolation a 4-year time period in this case, but if they use the same trendline for 10 years into the future, numbers would have gotten totally absurd. (To be fair they did not actually do that)

There are also some more fundamental points I don’t like

  • The whole methodology appears to be arbitrary to me. They are doing the study 4 years after Covid started. Therefore it appears to me that this might be the reason why they choose a 4 year trendline before Covid started. If they had done the study 7 years after COVID-19 and if they had used 7 years before COVID-19 for the trendline (starting from the drop in the saving rate after the short spike end of 2012/early 2013), the trendline and their projections would have looked very differently.
    Note: 4 years could also be some kind of standard, but if this were the case, it would not make the methodology even more arbitrary.
  • Instead what i would have expected is some careful choosing of the exact trendlines (timeframe) they are using and some good explanations why they think that this trendline would provide good results and why they would believe that esp. the last 4 years is a meaningful base for a trendline. What would be esp. important are the particular forces at play in those 4 years and why it would be reasonable to assume that they would continue so that the same trend could be maintained.
  • Even better than this approach would have been if they outlined their observations of key factors in the saving rate in early 2020 and projections how this would have developed into the next 4 years based on knowledge available at this time or projections that credible other institutions made at the time. Then they would have said “this is a range of scenarios that would have been most likely at the time” and “this is the probability/distributions of those scenarios in our assessment”. They then could have concluded that based on the probability-weighted average of those scenarios the monthly savings base to compare excess savings to would be X and the excess savings in their humble assessment would be Y.

I am totally aware that the later approach is more time intensive than just drawing a line and there are some scenarios in which it might make sense for us to draw a line based on some reasonable understanding which trends are important and which timeframes to choose.
I believe in almost no scenario it is advisable for us to simply draw a line based on an arbitrary timeframe to make an argument like it appears that the SF Fed did. (And if we ever did we had to make sure that to capture more of the mid-point of the scenarios and not an particularly aggressive one)

Overall in my opinion the guiding star in our approach should be rigor and depth + transparency in the methodology and assumptions + humbleness in our conclusions + preference of refraining from an assessment altogether if we lack the knowledge to make that(or do it only with strong disclosures), than to publish something misleading, randomly drawn or highly uncertain with confidence.

Just some of my thoughts, on why I don’t agree with you on this particular case

I am extremely skeptical of the argument that just because the economy has not seen a rate above 8% since 90,s, it can’t be like that again.

In 2019 it was already above 7%, and the economy did not see a 7% savings rate since the 90’s either (with 1 exception in 2012: 7.9%). So based on your argument, 7% would not have been that much possible either, but it was.
The economy is always changing over time, but it does not mean that certain conditions can not repeat.

Currently, my only point is that neither of us has analyzed the conditions/fundamentals of savings in those years to know if it would have continued to increase or not.
So, I think It’s very rushed for you to say is extremely aggressive without actual research on the conditions back then.

However, I agree with the methodology you outlined, it’s much more robust and ideal in every scenario, and for very important topics we should try to approach it like this.

But, we’re discussing excess savings, it’s not a particularly critical topic, likely not even for them, to deserve spending extensive time to achieve the level of precision you’re proposing.
It’s just enough to know for me that consumers have spent most of them already.

Nevertheless, using forecasts in early 2020 would have been a worse approach for me. Forecasts are always way wrong. And we don’t even know if this is even available, or who to trust.
I will always prefer to use different trends from different timeframes, and justify them. Because the goal for this is to compare actual (current reality) vs before trends in the economy, not against projections of what could have been.

The SF fed has been doing this same analysis since early 2023, they are not choosing 4 years because of this.

I am not saying that it could not have been possible, but I am saying that a 9.6% savings rate after 4 years based on that trendline is quite a high savings rate compared to the timeframe of the last 22 years since after the dot-com bubble or the last 14 years since after the 2008/2009 recession.
It’s also a high savings rate compared with the savings rate seen between 2013 and 2018 period in which it was more like 5.5% on average (I did not calculate the exact average) as it is around 75% higher.
So the way I look at the chart is that I see an uptick end 2018/2019 but it would be far from obvious for me that this is not temporary and can be extrapolated into the future as the baseline.
I also think what cannot be disputed is that a trendline which shows 50% increase in 4 years is a relatively strong growth trajectory for something like the savings rate. A trendline like this on the savings rate can always be only temporary because there is natural limit how high the savings rate can be.
Overall I think the SF Fed should have outlined all their reasons why they choose the timeframe why they thought the steep growth trajectory would have continued in their basecase. (But to be fair maybe they did. I did not read all their publications in regard to this study)
From a researchers perspective I think our principle needs to be critical and take informations with a grain or multiple grains of salt if we have reason to doubt someone methodology. (To the point at which we need to decide if the insight are valid or valuable and should be posted or considered or not)

If they are doing this analysis since 2023 and are always using the same trendline + continue to update the analysis with scenarios in 2025 and 2026, then the "non-COVID“ savings rate would have gotten higher and higher. (I am not going to calculate how high but if you are interested you could.)

I think what almost “bothers” me the most is that they are comparing two very good scenarios with each other to make the argument that the “excess” of one of those scenarios is gone already.
My point that I want to make is that the consumer would have a lot of money in BOTH cases therefore publishing a headline saying “Excess money is gone” feels wrong to me because it is missing the larger point that the consumer has a lot of money in both cases and still has a lot of money to spend based on the metrics they are examing.
So the whole „excess savings are gone“ argument only works IF we would have seen the strongest monthly savings + savings rate in over 30 years if there would have not been Covid.
(There are other reasons why the consumer might not actually have the money - as discussed - like how it is distributed + wealth is way more important anyway than savings during the last years to see how much money consumers have left + I also agree with your argument that a worsening situation can have a psychological impact - but those are other considerations and is not what the publication examined. Based on the metric they focused on the conclusion has to be „the savings situation of the last years was good“)
I am exaggerating a bit here, and I am not sure if this is the perfect example, but it’s a bit like saying: "Hey, this startup grew 100% each year in the 4 years before COVID and had exceptionally high growth rates of over 100% during Covid. In total, in the 4 years after COVID-19, it grew 10x, but it did not grow 16x ((100% growth = 2) ^ 4), as implied by its previous trend. Therefore, the headline is “Startup underperform’s historical growth rates,” even though maintaining the growth trajectory was unrealistic to begin with, and the whole point of what is happening - which is that the startup was very successful - is missed. (A lot of news reporting and headlines are actually very misleading, so misleading headlines like this can realistically happen)

Why is it better to take trends as the base than projections?
My understanding is that the observations of trends and correlations is quite superficial and easy (and should therefore only be the starting point for more research) but only with a deeper logical understanding of the driving forces behind those trends and correlations someone could reach reasonable projections how the future will develop.
To make another example: Everyone can draw trendlines based on the Meta Platforms Chart, taking different starting points for those trendlines and trying to project where the price will go but he would still have no idea at all where it will actually go, because he does not know which starting points to take and he is missing the necessary deeper logical understanding what the intrinsic value of the company is, which forces are driving it and when the price would be low and it is time to buy and when it will be high and he should sell.
I think this can happen to analysts/economists as well if they are not very thoughtful about which trendlines they are choosing. By choosing very good trendlines they are already getting closer to actually making a projection (because they consider way more factors) and this approach might be sufficient for most cases in which it is not economic to work on a detailed probability weighted projection. (as outlined last post)

The point that I want to make is that I think that projections if well done can be way more accurate than trends. And our goal in an analysis like this would be to compare reality with a realistic base case, correct?
If we would just compare it to some random trends that would not even have realistically happened what would even be the worth of our conclusions.

Overall, I believe that our method should be influenced by a range of factors like the importance of the topic, our knowledge we have in that field etc. so we can decide if it makes more sense to rely on predictions of good sources, do our own trend analysis or even our own predictions.

I also tried to illustrate how the prediction process works approx. in my opinion here.

1 Like
  • I agree that a 9% rate for the past is high, which is why I already said it should have a lower probability in a scenario-based study, though not an insignificant one either imo.
    I also agree that the savings rate will reach a stopping point, but the exact level is uncertain for the both of us. Around the financial crisis, is clear there was a shift with consumers who began saving more and paying down debt. We don’t know how long this trend would have continued without the COVID shock, and at which growth rate.
    It’s far from obvious for me whether the savings rate would have continued to increase or stabilize at 8%, or even declined.
    Since neither of us can know this without doing the research ourselves, it’s best imo not to make definitive judgments (as it seems you already did) on any study without proper analysis on our part, this has been my main point only.
    We also don’t know until when they intend to do this study or if they will change their trend at some point or not, so is better not to make a judgment about something we don’t know, but I also have not read all their documents to know if they have given more clarity or not.

  • This study is not about overall savings but specifically about excess savings accumulated after COVID, so I don’t understand your point on why you are bothered by that, and neither the conclusion you would have had. Their conclusion has to focus on “excess savings,” not the overall savings situation.
    And to be fair, they mentioned that consumers still have their “normal” savings and assets available for spending, but the metric they are examining is only excess savings, not total savings. (if you are bothered by the headline, we agreed a long time ago most titles/headlines are used for clickbait)
    Excess savings is not a misleading or invented phenomenon either; it is well-known and studied the excesses the COVID lockdown and stimulus measures created.
    It is natural there is research focusing only on these excesses due to the significant influence it had on spending and hence the impact on the economy for some years. While the consumer still have significant savings and wealth it does not seems to have the same influence as these excesses had.
    If you want or need a study about the aggregate savings for consumers, there are probably other studies focusing on that, but this was not for it.

  • Thank you for your structured approach in the image. It will be very useful when considering projections in my models. I never suggested substituting projections with a trendline in our main research, though, as they serve very different purposes imo.
    In an analysis like this, the only goal is to compare how conditions are currently vs before, not vs an alternate reality based on projections.
    Trendlines must be chosen carefully I agree so the timeframe is very important to consider and the fundamental conditions, but they are only simpler tools to spot economic changes and understand if something significant has occurred or not. Changes or broken trends happen regularly and can have implications. For me, is only useful with this in mind, not to make projections, for that, we have the models.

Somehow, it is surprisingly difficult to find common ground on that topic.
I understand all the methodologies used, the study’s goals, etc., and understood them from the beginning. (I hope I am not missing something stupidly simple, haha)

My points are

  • There is a good chance that, as you say yourself, the study findings could be completely wrong. This needs to be immediately considered when judging if we should include the findings of a study into our thought process or workflow. (Including the wrong things confuses, takes time, and leads to worse judgments)
  • As an investor, it is irrelevant if there are excess savings compared to a very positive reference scenario with a very high savings rate. It is relevant that both scenarios are very positive for our judgment on how to think about the savings data point of the last years in the context of the economy. This is what we should focus on in our analysis.
  • I still don’t understand why a trendline is better than a sophisticated model/projection from 2020 as the reference for determining excess savings. Both are projections, and the models might be more accurate.

Maybe we should have a call sometime and discuss this in more detail, not excess savings, but the disagreements.

  • I agree with you, in any case, we should consider all the scenarios. However, I never said this significantly changes any of my economic assessments. Excess savings have been irrelevant for a while in my analysis. I only posted this because you asked what Mohammed was referring to.
    My current focus is primarily on the labor market, consumer income and credit conditions, as these seem to be the major driving forces at the moment.
    I prioritize these factors over savings or wealth levels, given the poor distribution of these.

To try then and give more context, I found this chart that tries to answer the same question by cohort
Disclamer: I don’t know anything about the methodologies since these charts are only shared for free from their research reports


Another one that tries to make scenarios with different saving rates
image

  • That’s a completely different point you’re making. This study focuses on excess savings and their impact on spending. If you find it irrelevant to your investment decisions, that’s subjective and can vary from investor to investor.
    In this case, I disagree in how you see it. Excesses (not just for consumers) significantly influenced the economy (eg. inflation). You cannot simply say they are irrelevant to understand them now, we definitely need to also focus on these shocks when they occur.
    And I would argue that for investors it was relevant to know they existed and when the effects were mostly gone, excess savings—> more spending —> more revenue —> more profits.

  • I would like to explain this better, but I’m struggling to find a better way to do it. Trend analysis is frequently used but never as projections. You’ve likely heard phrases like “growing above or below trend.” They are useful only for recognizing such patterns.
    However, if you’re worried that I am thinking of substituting projections with trendlines, that’s not the case.
    If I ever use a trend analysis will be just to highlight significant changes in growth or other indicators. This helps understand whether a notable shift is occurring and analyze the reasons and if it’s permanent or temporary. There can be very good/fundamental reasons, not always have to be a shock.
    Beyond that, trendlines are not useful as projections to me.

1 Like

Thank you for the charts.
I agree that moving to a call is a good idea.

Overall it is important that we develop ways to discuss in written format so that everyone can always follow along but for this time I think it is better if I explain you in person what I mean with my last two points.

Ps: I agree with your last two points in general but they are not addressing my arguments

1 Like

Q2 2024 Consumer Spending Remained Robust

Spending growth continues to be above that of income growth.


Since spending growth is above income, consumers have compensated by reducing their saving rate.
IMO, the saving rate is already at very low levels, so an additional significant drawdown is less expected, could get to ~2-2.5%.
Hence, unless there is an increase in income growth, spending could start to get somewhat weaker.

The weakness in real durable and non-durable goods spending in Q1 saw a recovery during Q2 2024.


Sources:
Tableau
Google Sheets
Model Format

1 Like

August 2024 report showed significant upward revisions to Personal Income

Despite income and spending falling short of expectations, the most notable development this month is the significant upward revision to disposable income across all series. This revision has, in turn, lifted the savings rate from previously concerning lows to a level that no longer signals such weakness.

This shift alters the economic picture, especially in the short term, as my previous concerns about sluggish income growth and consumer spending beyond their income growth are now moderated. With these revisions into account, it will take a much weaker labor market to significantly impact consumer behavior. (important to note that there has been recessions where consumer spending barely declines or doesn’t decline at all eg. 2001, 1970)

I was already anticipating only a very mild economic downturn in 2025/2026, and this revision doesn’t seem likely to alter my GDP outlook substantially, particularly as a trend toward further weakness is still present, especially in the labor market. However, I will await more data before updating my forecast.

1 Like

Great post. It gives me all the context I need including your overall assessment, what those developments mean in the context of your overall assessment and an indication when you will update your forecast.

I in particularly liked the source from Pictet Assessment Management because it gives a detailed comparison for before and after the revision in nominal terms and as you know I love nominal numbers because this makes it easier to understand the size of an economy and compare it with revenues of companies, other economies, market caps etc.
Ideally I would always like to see nominal numbers alongside growth rates because it helps me and the community condition on dimensions of things.
In addition help for people to understand what numbers are referring to is always great. In this example I assume Pictet numbers show monthly disposable income so we should highlight that by making a note or adding „monthly“ to the picture before uploading it.

To improve our methodological understanding:
What caused the revisions? What is the methodology how data is collected and revised and how often does that happen?

Yes, sure, I usually do have charts with both rate of change and absolute numbers and can try to include both always, and in the summary tables I am creating, I am also including both.
But remember that these in particular are real figures, at 2017 prices, so they are not comparable to other nominal numbers, and are not really the size of the economy anymore.

Apart from the quarterly revisions, GDP has always an annual update (PCE and Disposable are part of this), that can include revisions to several years, this year was from 2019 to 2024. Sometimes revisions don’t change that much original numbers, but this year it was very significant.

This is why most likely in the image I sent you in telegram, the 2008 GDP original numbers changed so much with posterior revisions.


Government transfers and income from assets were the major contributors to the revisions to personal income

There were also revisions to GDP and GDI and corporate profits, which I will probably be making the posts on these days. I am working first on the auto questions you and Aaron tagged me.

Q3 2024 Consumer Spending continues to be robust and supported by continued income growth

Consumer spending accelerated quarter over quarter, while disposable income decelerated. Both remain on a similar trend year over year

  • Real consumer spending grew 0.9% q/q in Q3 2024 (0.7% in Q2) , and 2.97% y/y
  • Real Disposable income grew 0.39% q/q in Q3 2024 (0.57 in Q2), and 3.16% y/y


Spending on goods had a particularly strong quarter, spending on services stable at robust levels too.

  • Real Durable goods grew 1.97% q/q in Q3 2024 (1.33% in Q2) , and 3.6% y/y
  • Real Non durables goods grew 1.20% q/q in Q3 2024 (0.47% in Q2) , and 2.32% y/y
  • Real Services grew 0.65% q/q in Q3 2024 (0.68% in Q2) , and 3.08% y/y


Compensation and government transfers are the primary drivers of disposable income growth currently

Income from assets growth decelerating


Saving rate declining, but after last quarter revisions the risk coming from low level of saving rate is not longer as evident

Consumer Spending Ended 2024 on a strong trajectory

  • Disposable personal income** (DPI) increased $79.7 billion (0.4%) as expected
  • Personal consumption expenditures (PCE) increased $133.6 billion (0.7% vs 0.5% expected)


  • Real disposal income 2.43% y/y in December 2024
  • Real spending at 3.1% y/y on December


  • The saving rate is at 3.8%. Have been declining since income growth has been below spending growth for most of 2024