Wikiarticles: Personal Consumption Expenditure - InvestmentWiki
Personal Income - InvestmentWiki
That is very interesting and an argument we did not consider before. If we reach the same conclusion it could massively change our macro outlook
Wikiarticles: Personal Consumption Expenditure - InvestmentWiki
Personal Income - InvestmentWiki
That is very interesting and an argument we did not consider before. If we reach the same conclusion it could massively change our macro outlook
Massively? Why would you think so?
Yes, older people usually have wealth accumulated, but throughout how many years are they going to spend this? 15, 20,30? Especially as life expectancy increases.
75 trillion, by 60 million boomers, is only $1,250,000 per person that they would have for retirement, and is probably much less than that for the majority.
And without removing what they left to their family, which is probably not that insignificant
Don’t you think that people in retirement has to be very cautious in how they spend their money?
Adding to that they have the healthcare costs that they have to plan, could be that healthcare stocks are the ones that could benefit from all of this long term.
I don’t expect them to go in a spending spree in 1 or 2 years, and some are not even retired yet too.
Also, in a recession, they will most likely be even more cautious to spend their wealth, as assets prices decline, and hence their wealth do too.
It does not change much imo at first impression.
Hmm some fair counterarguments, especially that this wealth is likely very unevenly distributed, and therefore spending power of most people is way worse.
I think in order to figure out how significant that is we need to get more details like on the distribution, the spending vs. saving behavior, any tax on it to be paid, any recurring revenues from it (e.g. saving on rent, etc.), and then develop some references like how this compares to other countries, how the wealth of retiree in the u.s. developed over time, etc. + Get independent numbers that confirm ed Yardenis estimated amounts.
Overall I think what is important here as well is to develop an overview of peoples earning sources + spending behaviors. (E.g. the 7.6 trillion in unearned incomes sources he mentions is interesting and numbers like the total aggregate amount of wages in the u.s. by social group would be interesting)
If we know how large the income source of people per year is and very importantly how it is distributed we get a clearer picture of how relevant the covid excess savings in that context have been and it makes it easier for us to judge how large the impact should be if people run out of it + it gives us important references to other numbers like credit card debt etc.
In terms of priority, I would say this research is important but not urgent so rather low prio for now. Once you start the article and choose a name I will rename the name of this topic to match the article’s name.
My intuitive logic:
Will retirees spend more than before their retirement? No
How will retirees source their spending during retirement? Selling assets (mostly stocks and bonds).
Conclusion: Cet. par. this is bad for the economy because of weaker domestic demand and valuations (earnings multiples) will be lower than during the period when baby boomers (a particularly big cohort which will begin their retirement during the next decade or so) were saving for their retirement (i.e. buying stocks and bonds).
Good argument. I think we should create a standalone “Effects of Demographic Change” article at one point to study those effects and get an understanding of timelines.
Probably there are data sources or studies out there which could show us the effects on GDP when large cohorts retire and some studies on how those retired cohorts spend their money and which shifts of product demand will come with it.
This article will also play a role in helping us to predict how much the labor force participation rate is going to drop and how this affects labor shortages and therefore inflation.
When I was studying I remember seeing papers about retirees spending only a fraction after retirement than they did before. This was some years ago, but still makes have the same intuition that this is a headwind for economic growth long term, more than something positive
I can work on it, as this will probably be an important structural change for the economy and inflation.
Yes I think it falls into the category long term important but not urgent. So I think we can start to map it in linear and allocate some time once we have a good take on some immediate pressing topics like understanding the trajectory for small businesses
It has been said that after excess savings came down, credit is the one sustaining spending at the moment.
“US consumer borrowing slowed to a more than two-year low in May, reflecting the first decline in non-revolving credit since the onset of the pandemic.”
Non revolving usually does not go negative.

https://twitter.com/zerohedge/status/1678576670721097729/photo/1
A post was merged into an existing topic: Consumer Debt and Credit
10 posts were merged into an existing topic: Retail Sales
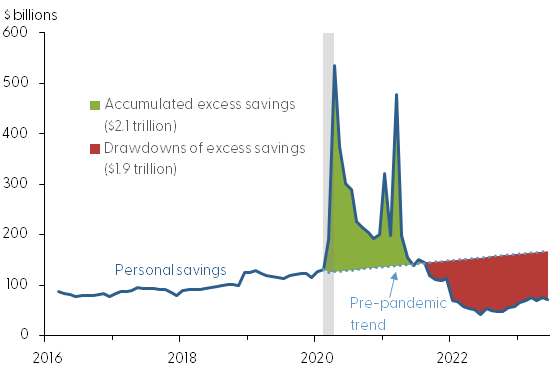
San Francisco FED study estimates remaining excess savings of only $190B, and to be likely depleted by Q3 2023.
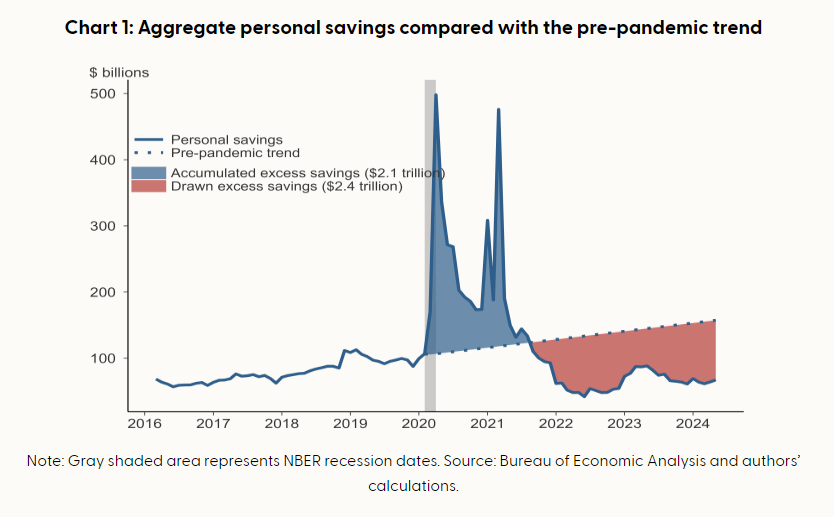
The red area in Figure 1 shows our updated estimate for cumulative drawdowns, which reached more than $1.9 trillion as of June 2023. This implies that there is less than $190 billion of excess savings remaining in the aggregate economy. Should the recent pace of drawdowns persist—for example, at average rates from the past 3, 6, or 12 months—aggregate excess savings would likely be depleted in the third quarter of 2023.
While Consumer spending is still robust, this is now mostly supported by less and less savings by them. Consumer spending growth is way above income growth. IMO this is not going to be sustainable, and we could expect a slowdown in spending at some point. Especially if job losses at some point accelerate a slowdown in income, and if deterioration in asset prices happens too.
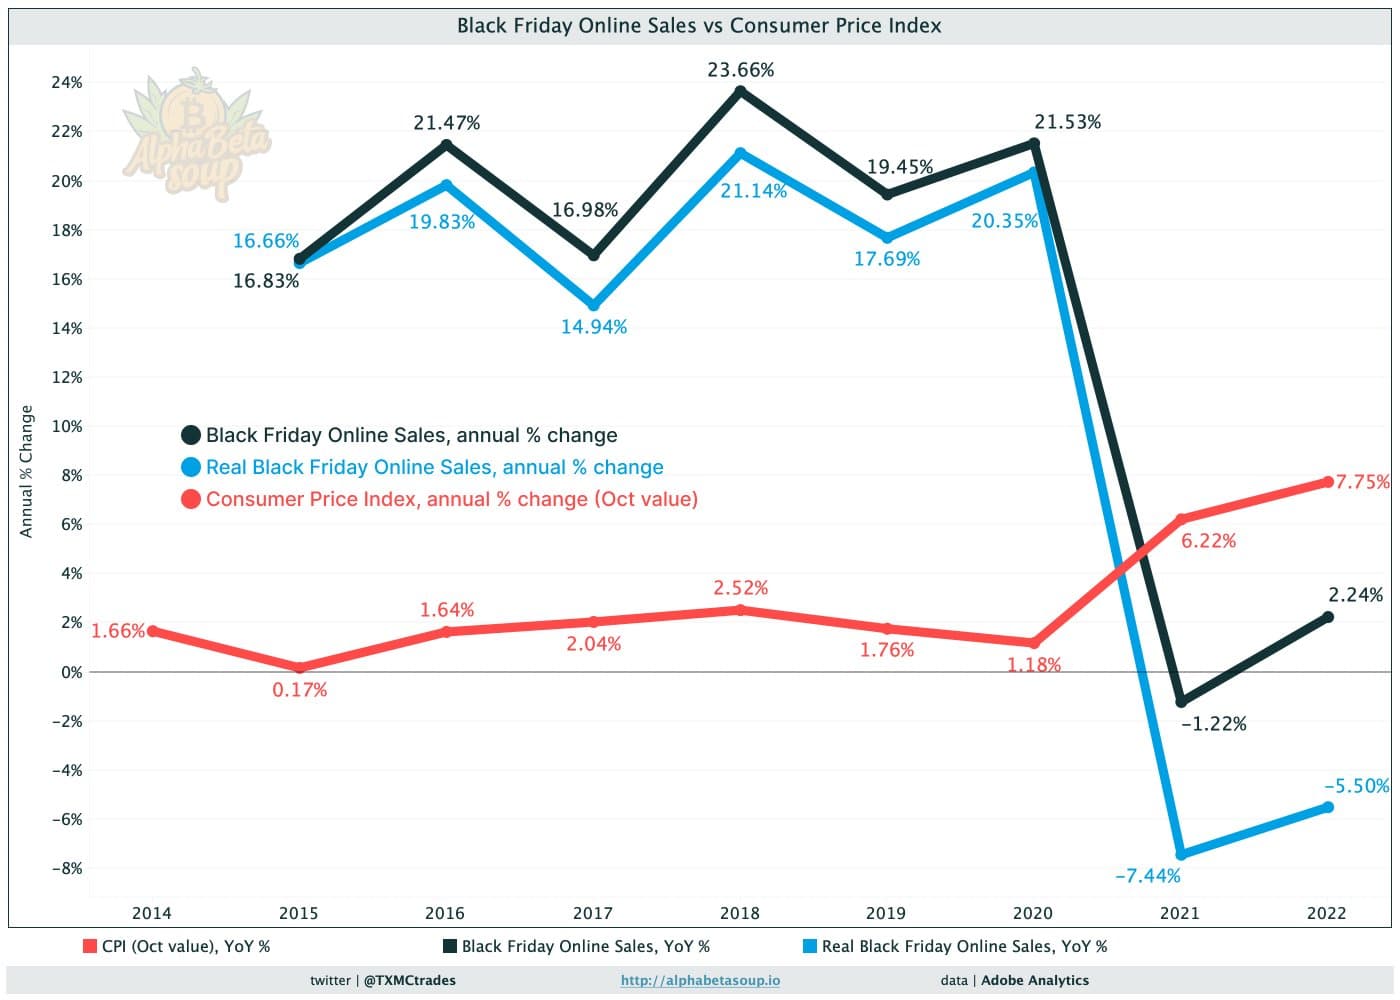
Black Friday online sales increased 7.5% y/y in 2023. Pretty good compared to the flat growth the last 2 years, but still not getting to the growth saw pre covid.
“We’ve seen a very strategic consumer emerge over the past year where they’re really trying to take advantage of these marquee days, so that they can maximize on discounts,” said Vivek Pandya, a lead analyst at Adobe Digital Insights.
“We do expect growth to weaken because those discounts will weaken and they are dictating a lot in terms of buyer behavior this season,” said Pandya.
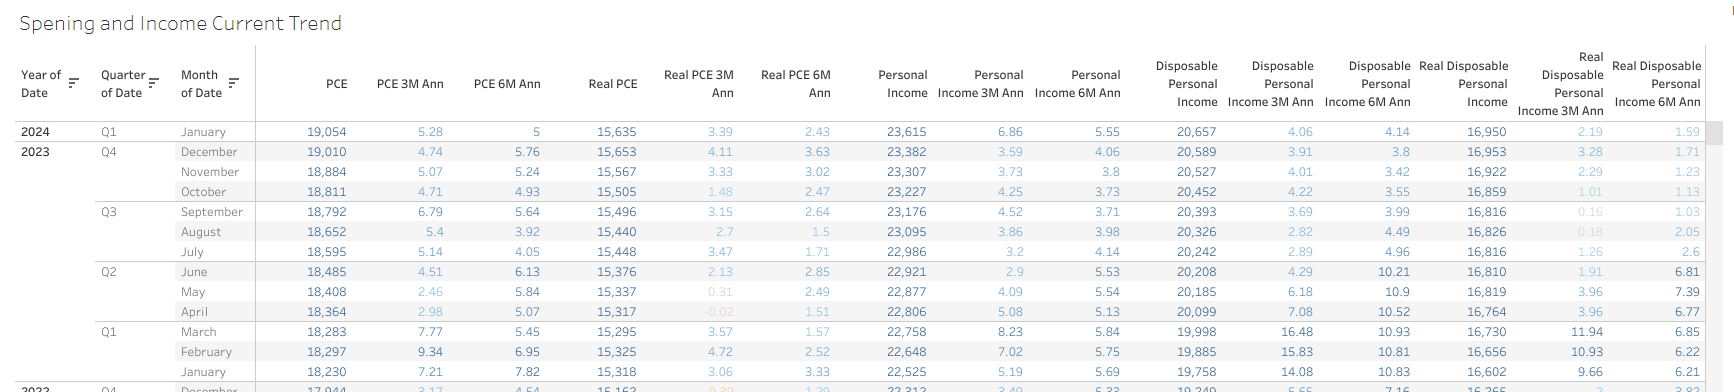
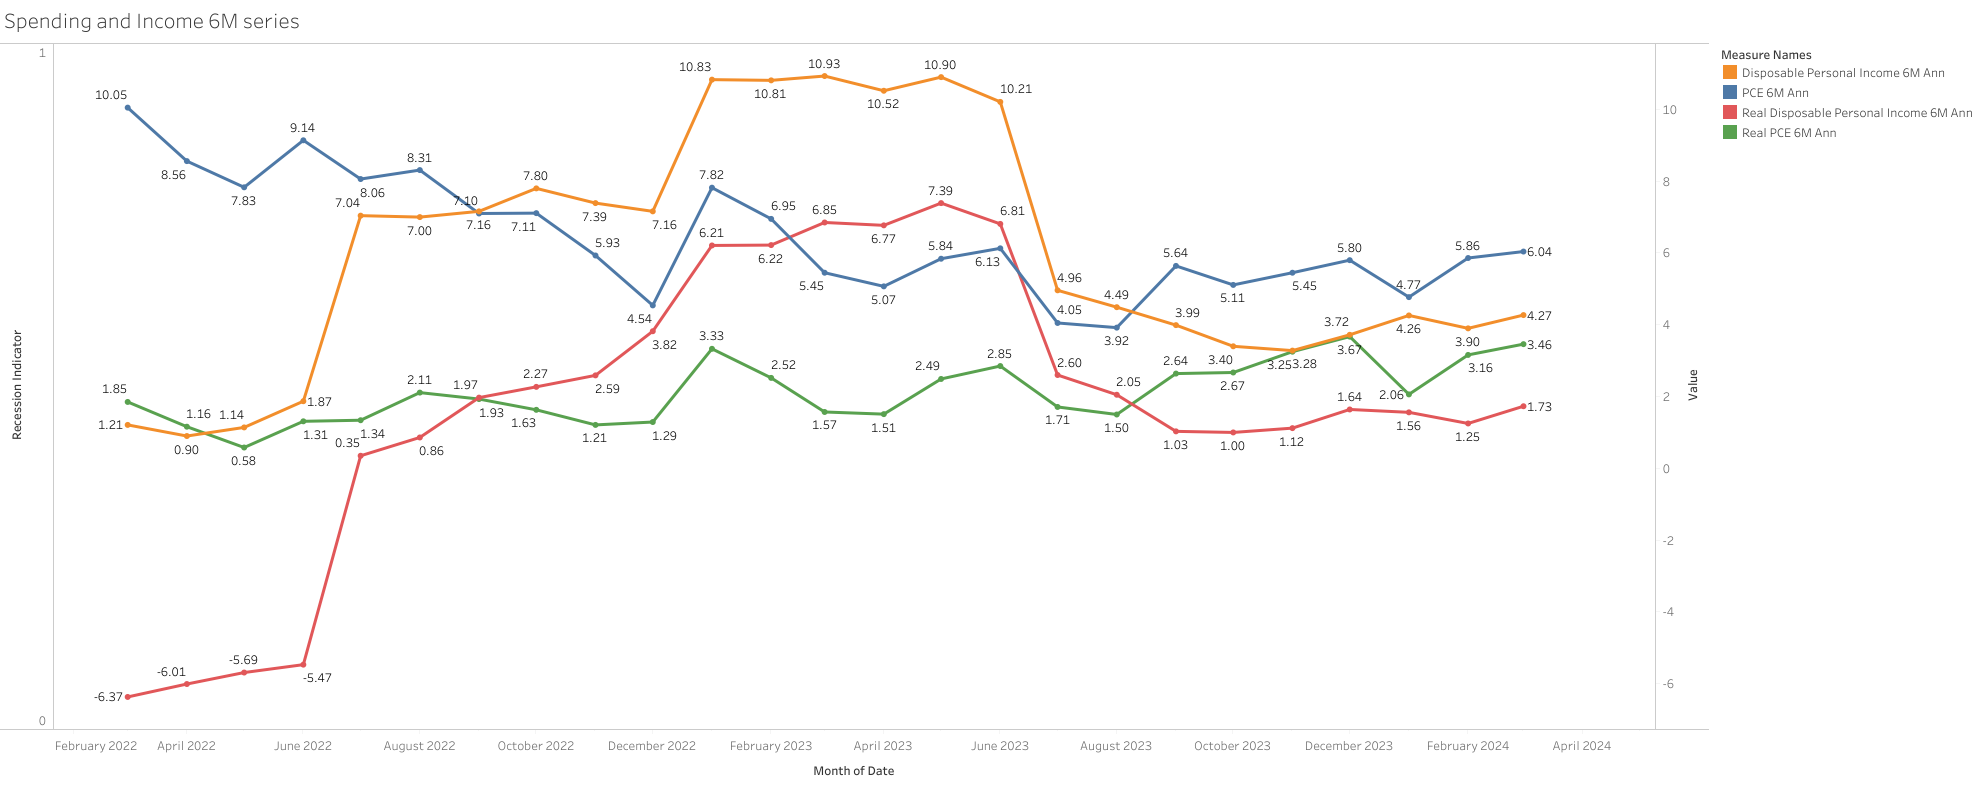
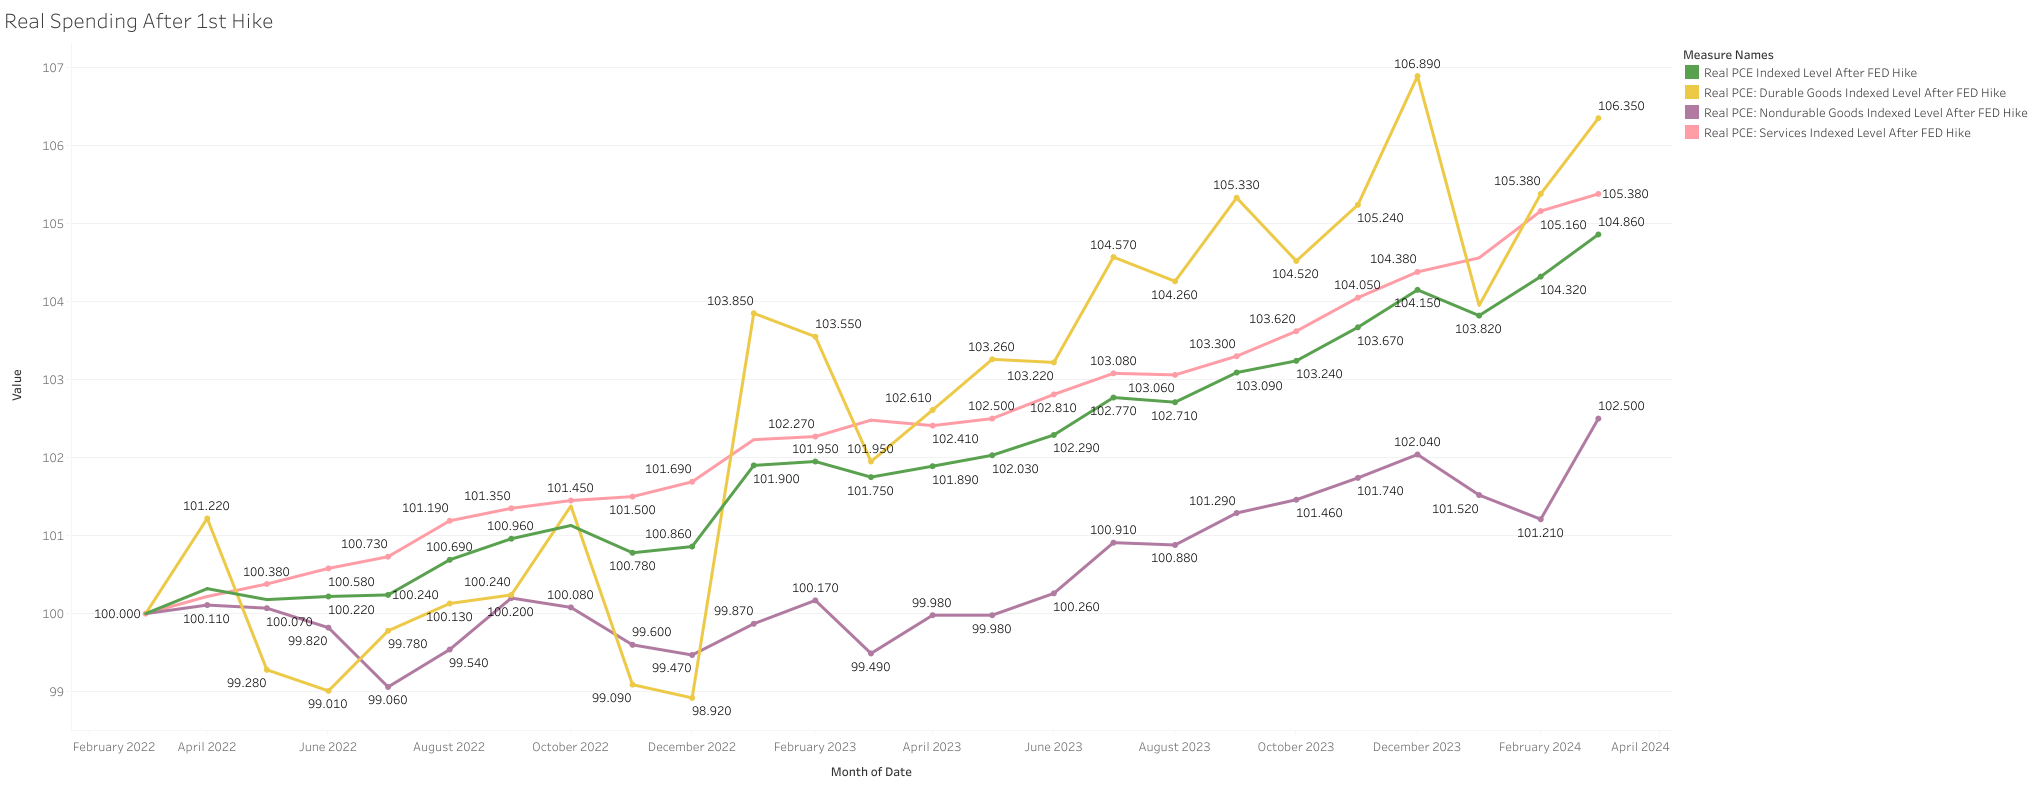
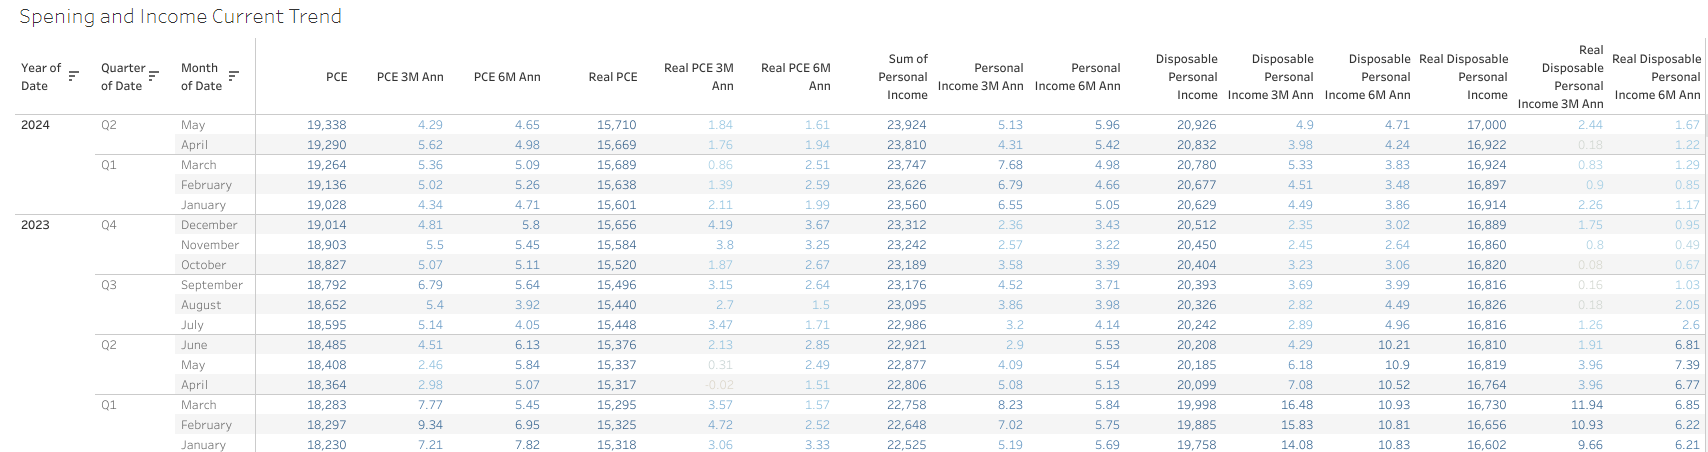
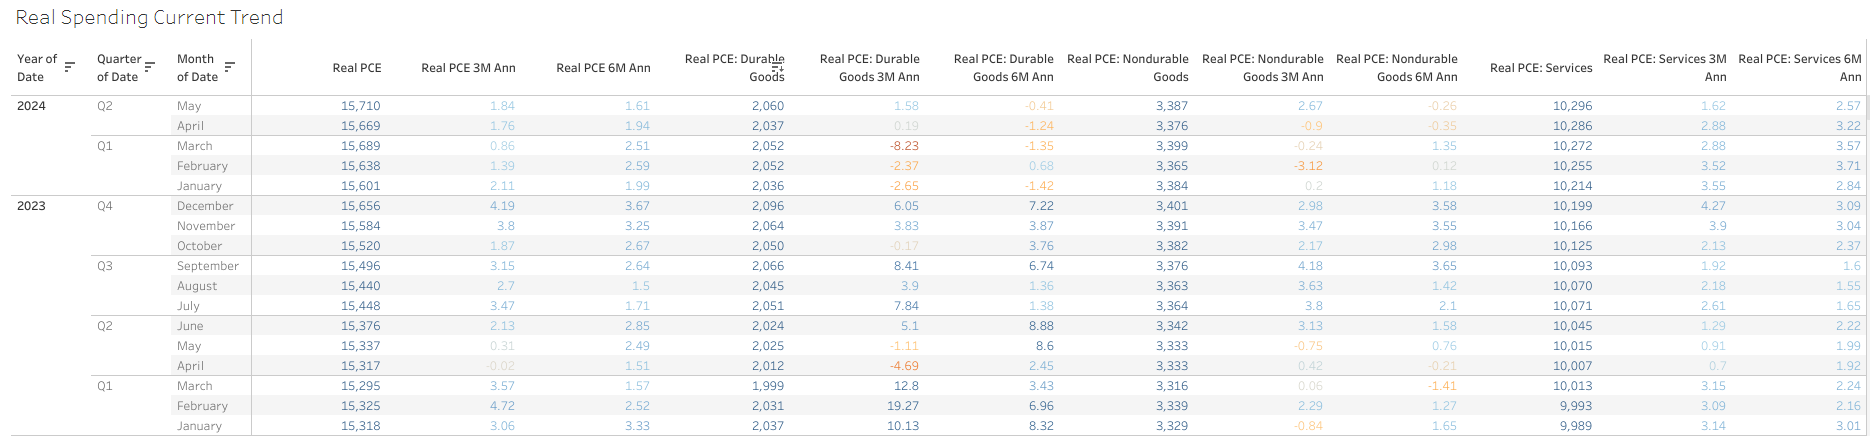
Spending and Income, nominal as well as real, continue to be relatively good. So, still no support for an imminent recession from the consumer side.
Real Spending had a negative print in January, but is common to have negative months once in a while, but will monitor it in case is an indicator of a change in the trend.
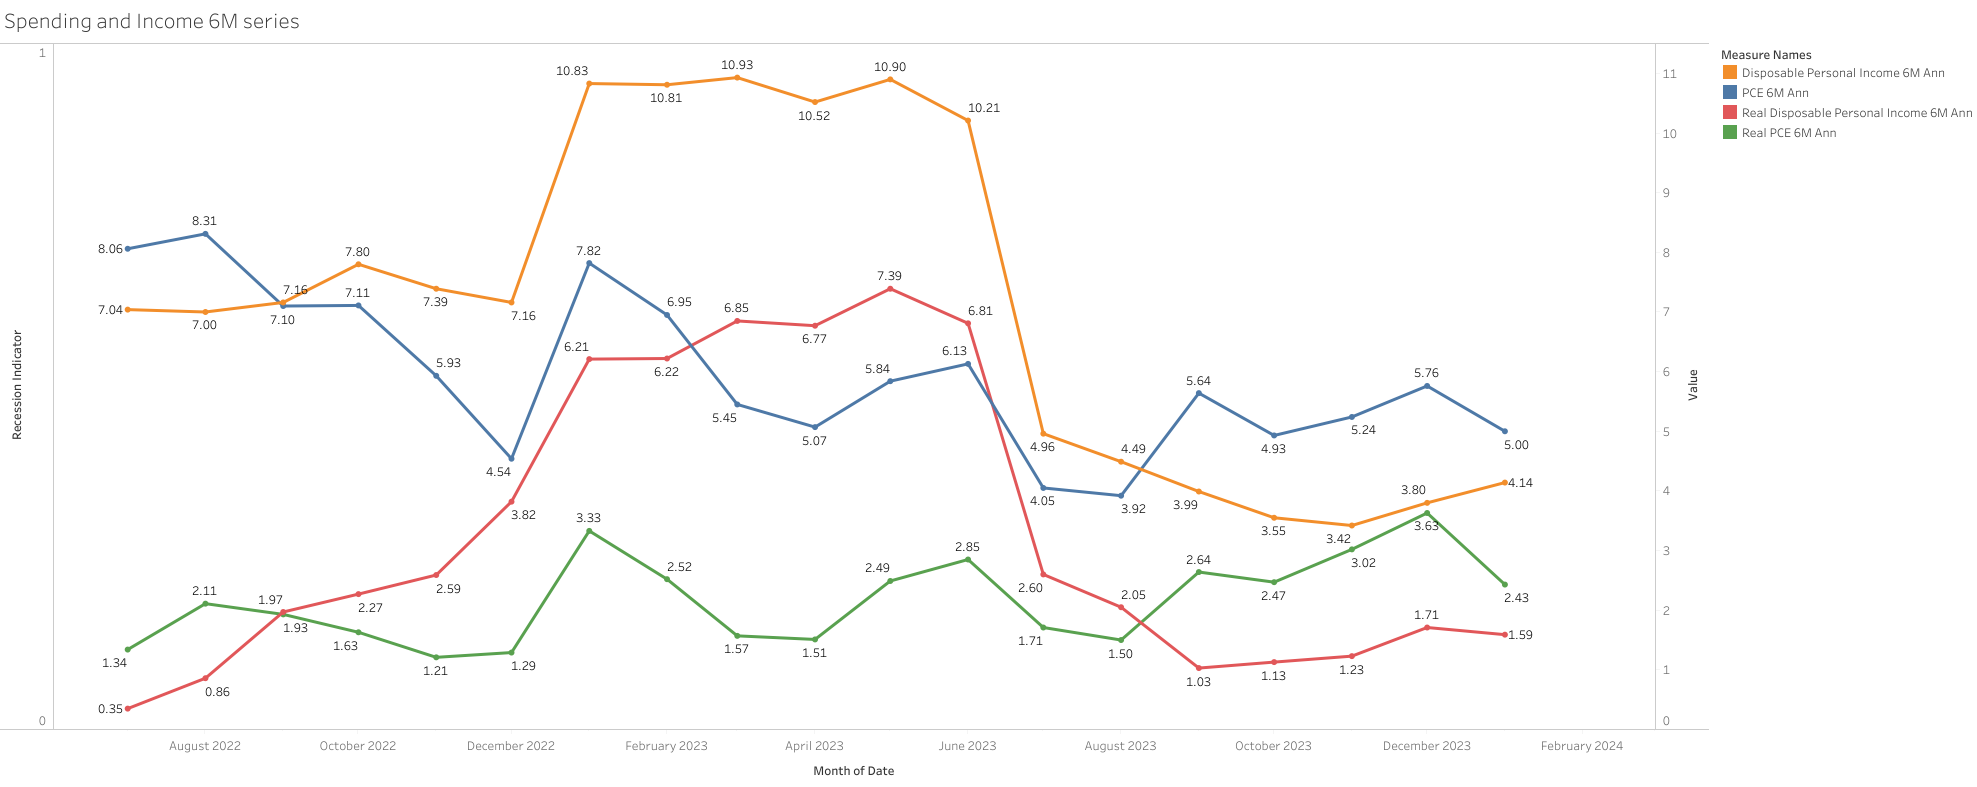
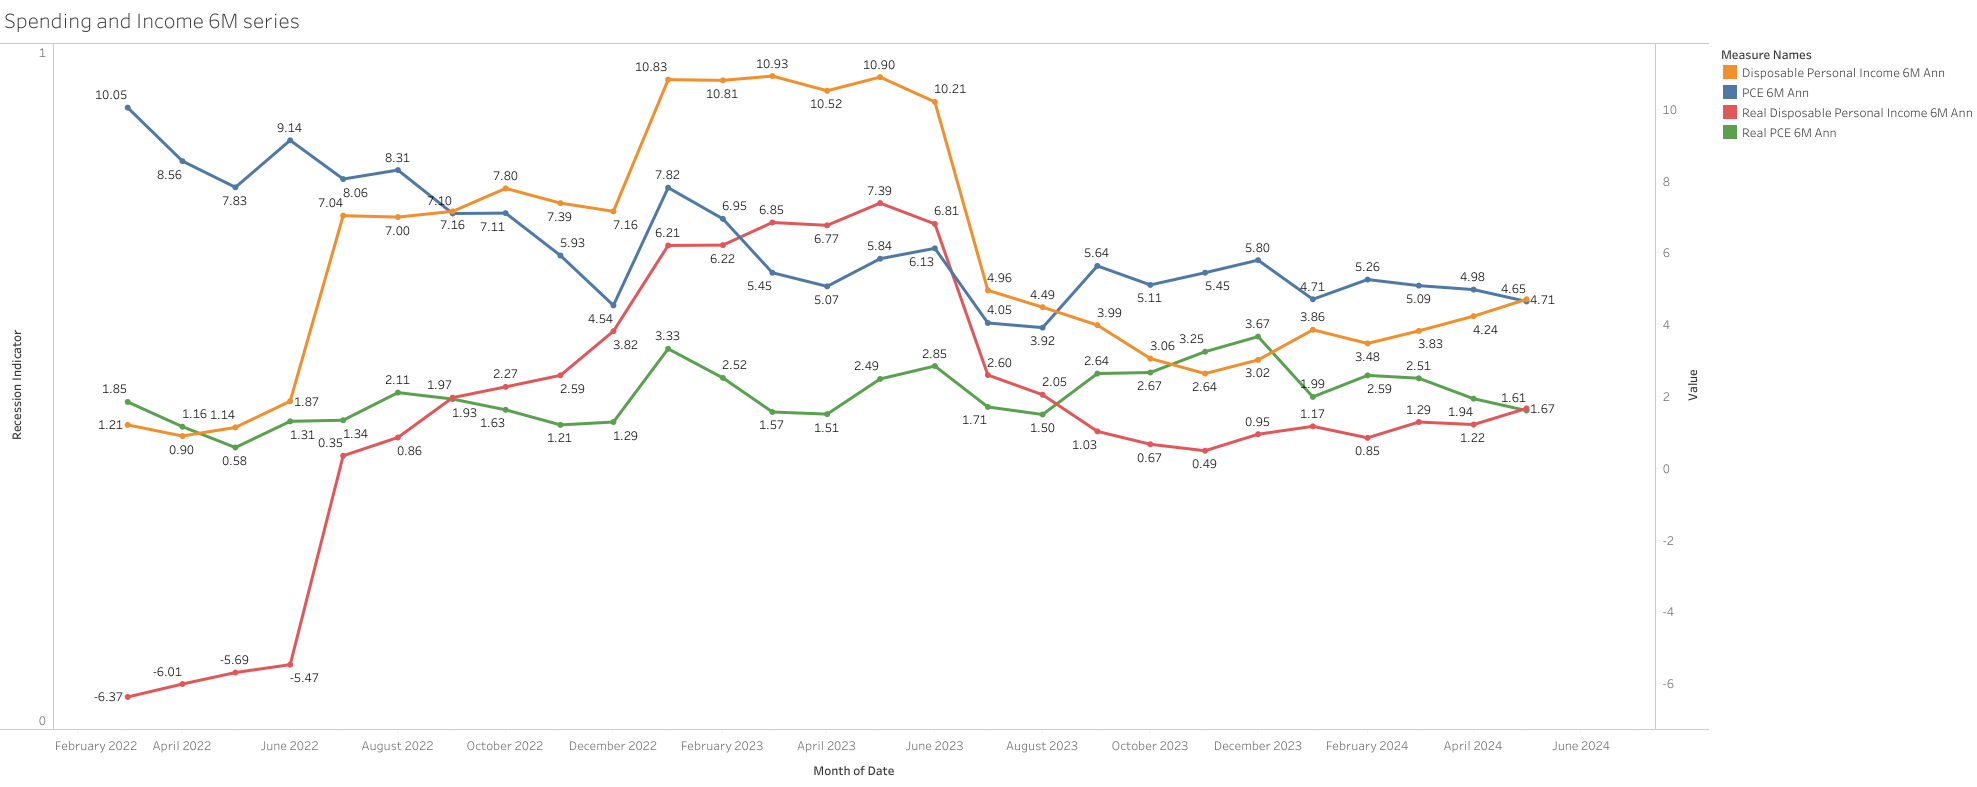
Income growth continues to be below spending growth on a 6M ann basis since the middle of 2023.
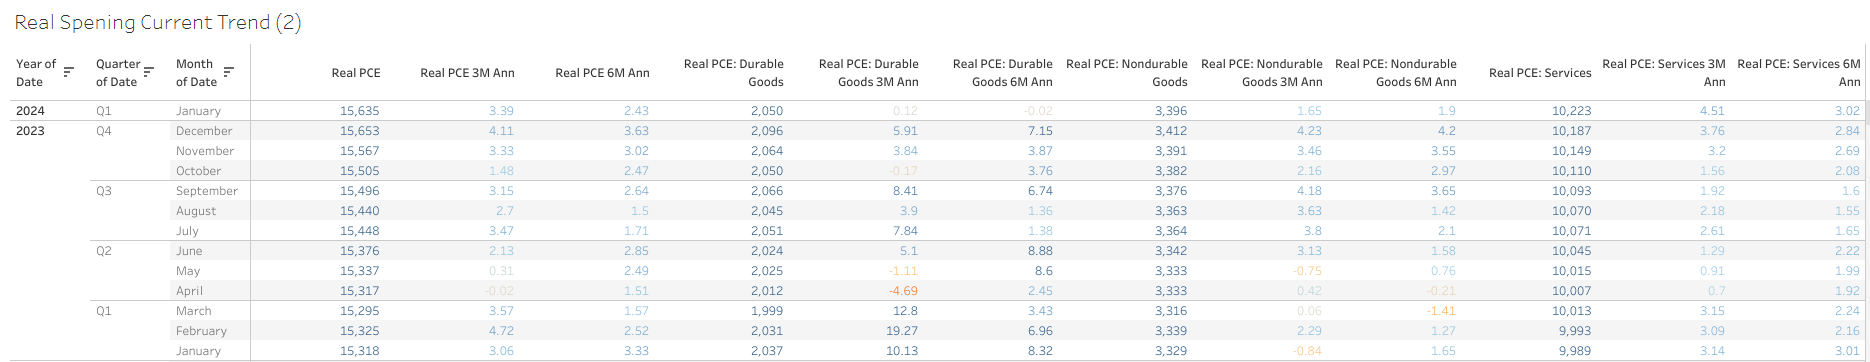
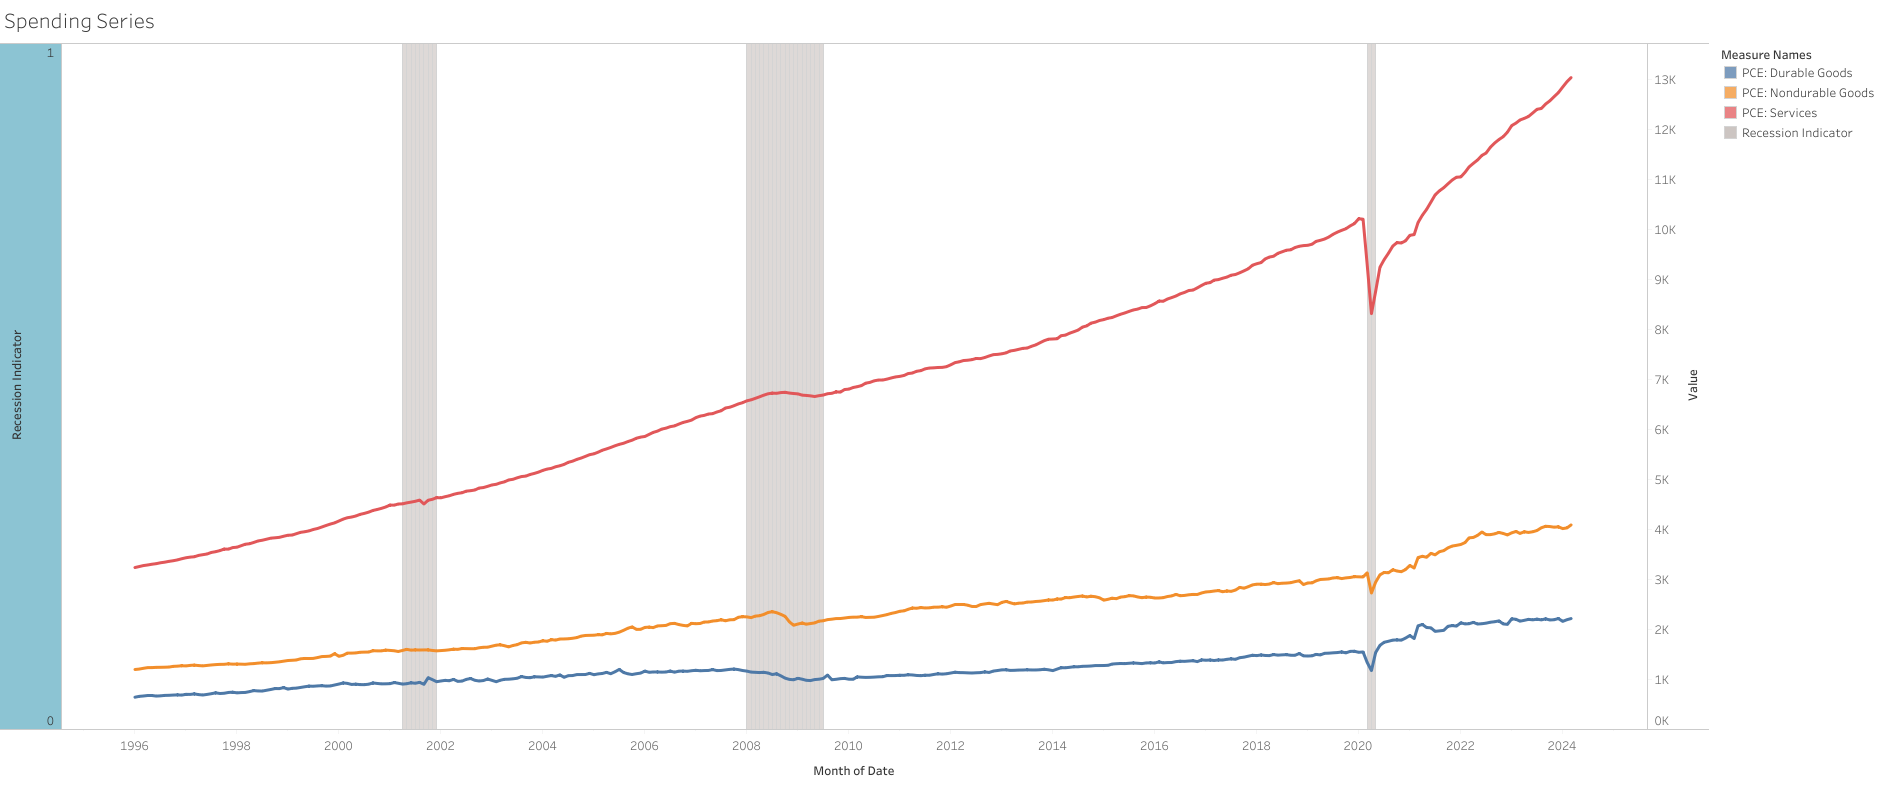
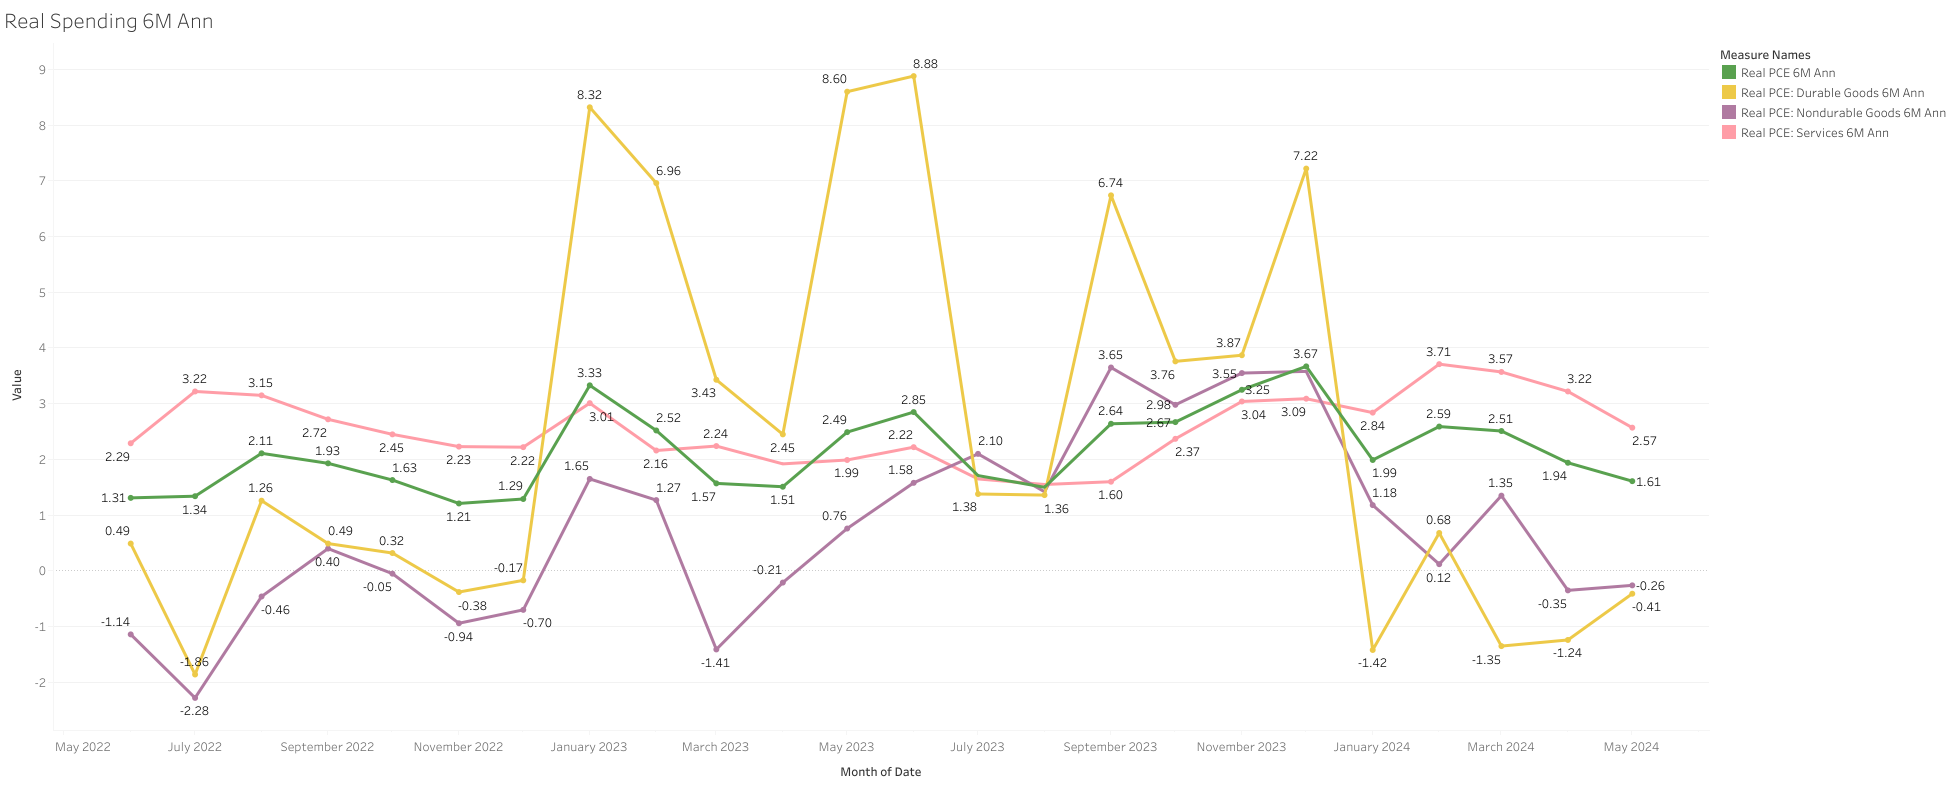
Real Spending is currently being supported mostly by services, since durable particularly but also non-durable goods growth is very low. However, they also represent a much lower share of spending.
Income had a strong growth of 1% in January, but it was mostly supported by an unusual increase in government transfer receipts, related to their social programs, and also interest income. So, I am not expecting this strength to continue.
Real income excluding transfers was only 0.3% m/m.
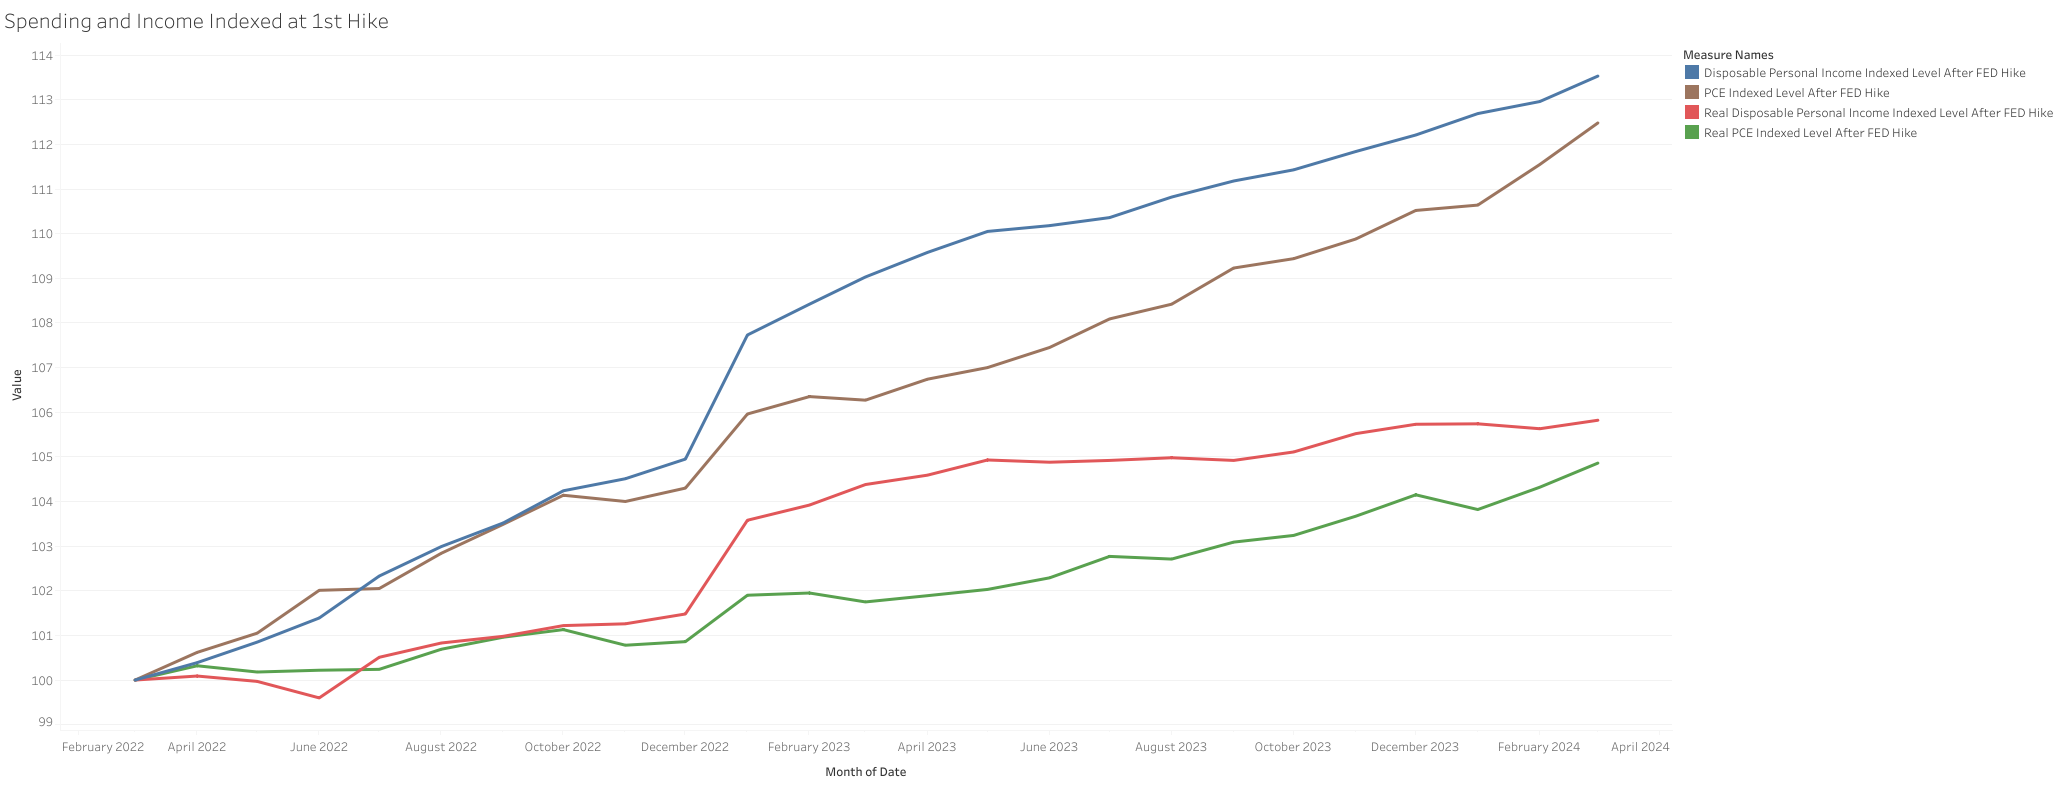
Consumer income and spending growth continued to be healthy during Q1 2024.
However, consumers continued to spend above their income growth, resulting in a very low saving rate at the end of Q1 2024.
This behavior in my opinion is not sustainable long term, especially as credit growth is also decelerating.
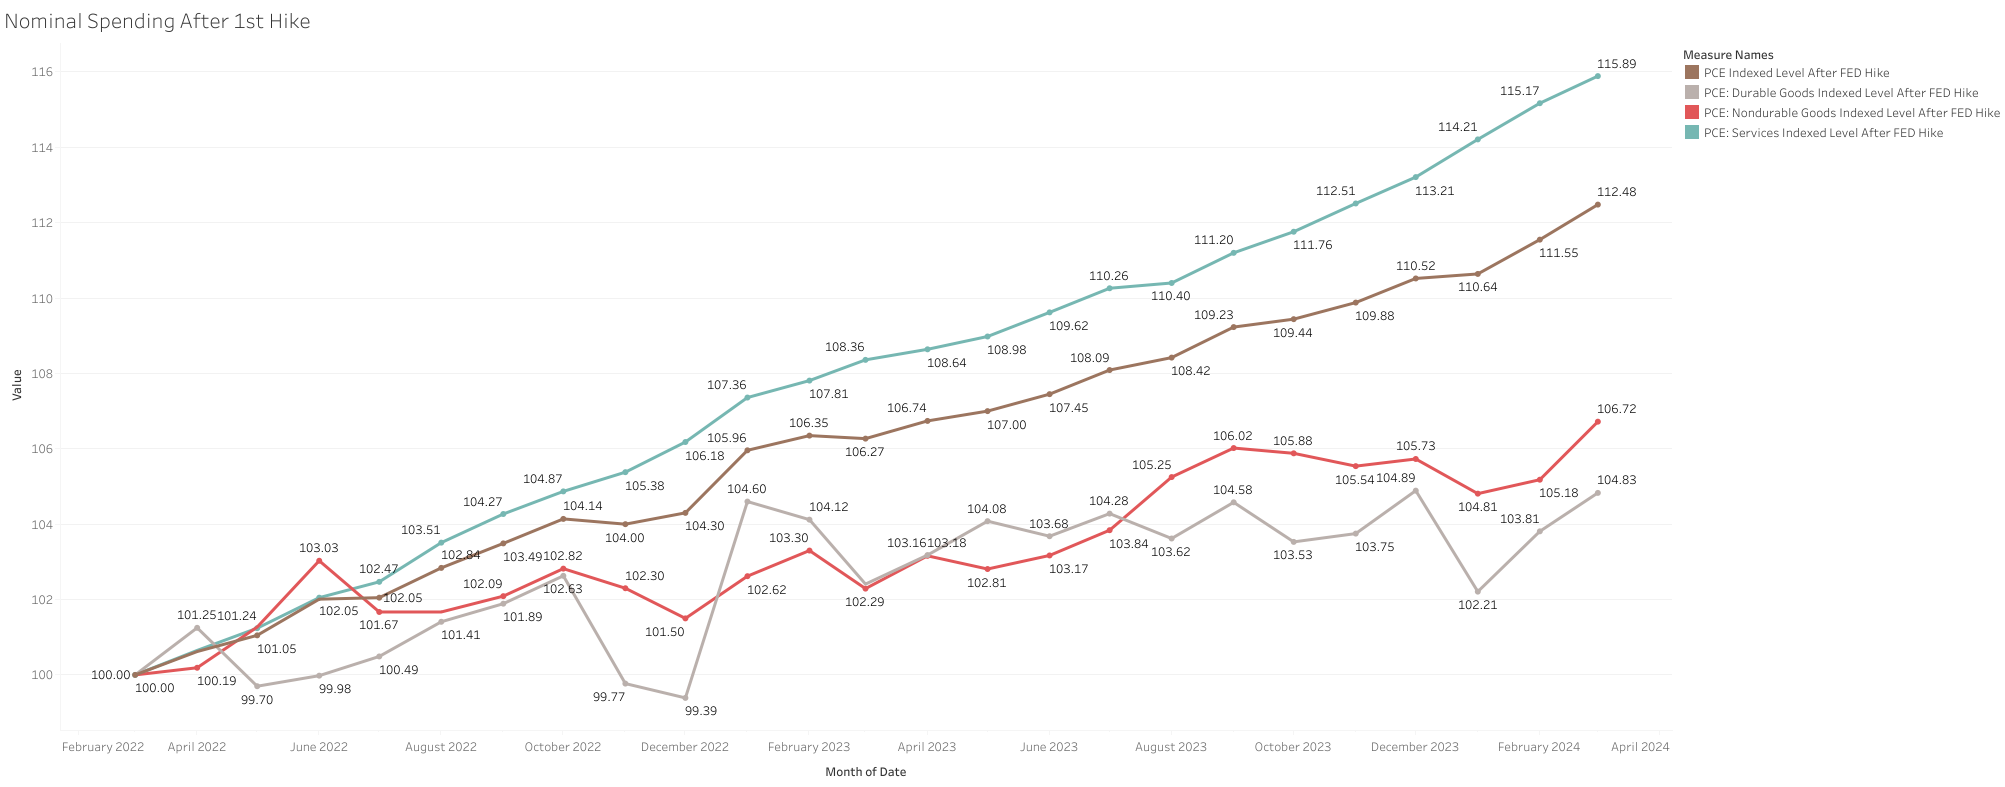
In Q1 2024, nominal spending grew 1.47% Q/Q (+277 B), and 5.05% Y/Y.
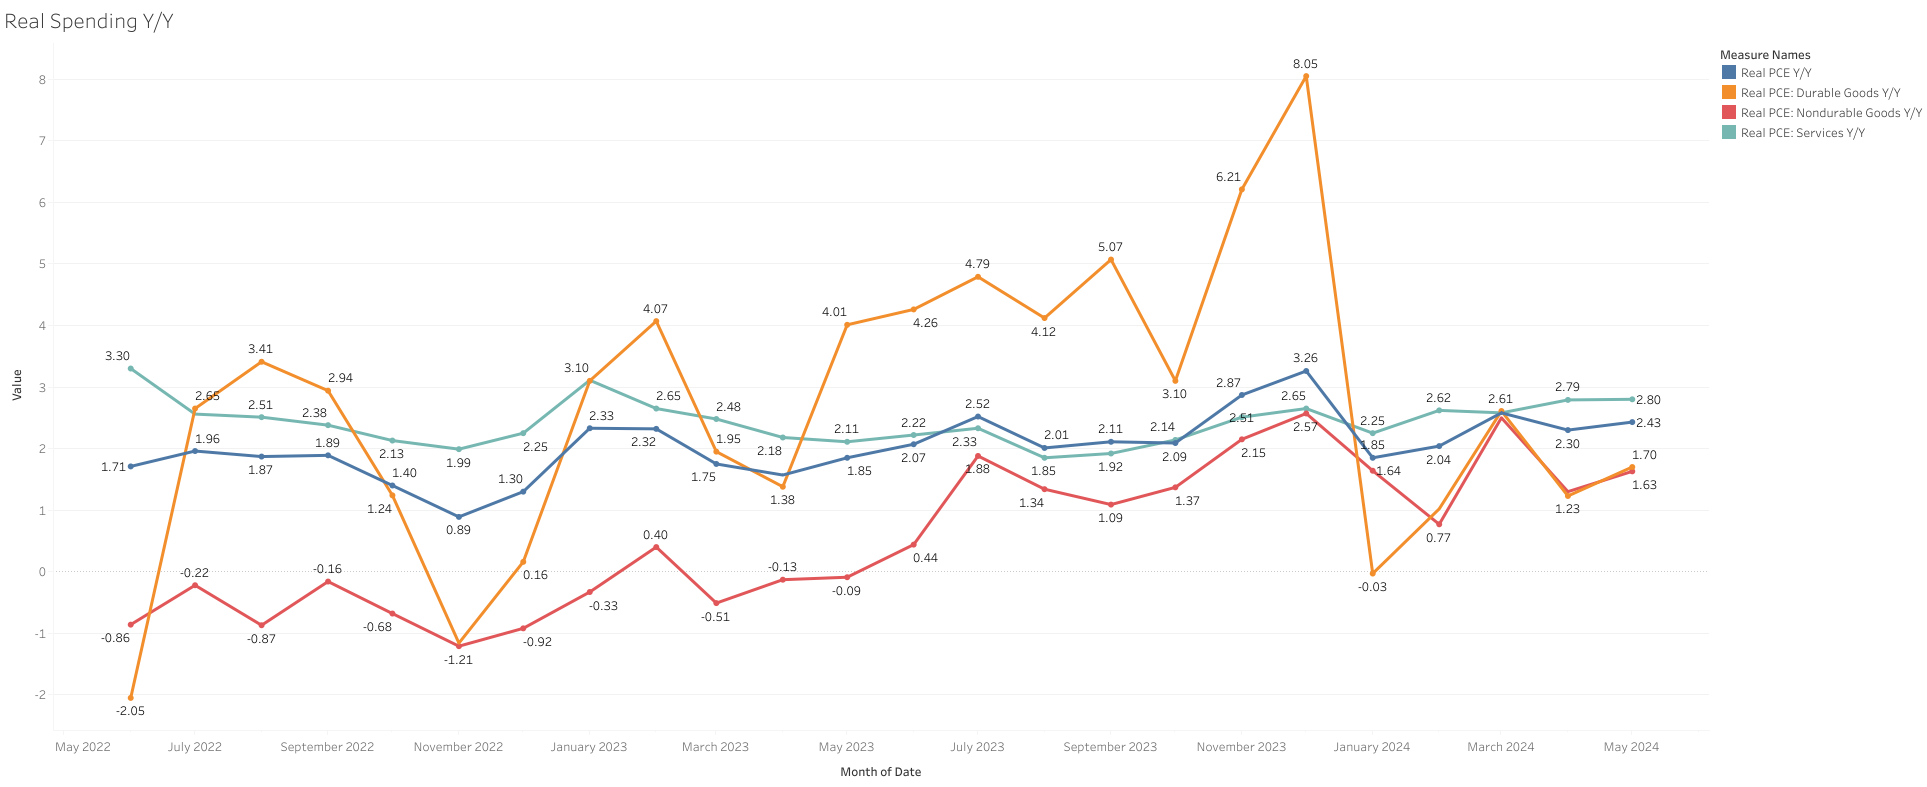
Growth concentrated on services, growing 2.31% Q/Q (292 B), and 6.72% Y/Y. Instead, goods decreased by -0.24% Q/Q (-15B), 1.75% Y/Y.
Most of the growth is mostly being driven by inflation, since real spending increased only 0.62% Q/Q, 2.42% Y/Y.
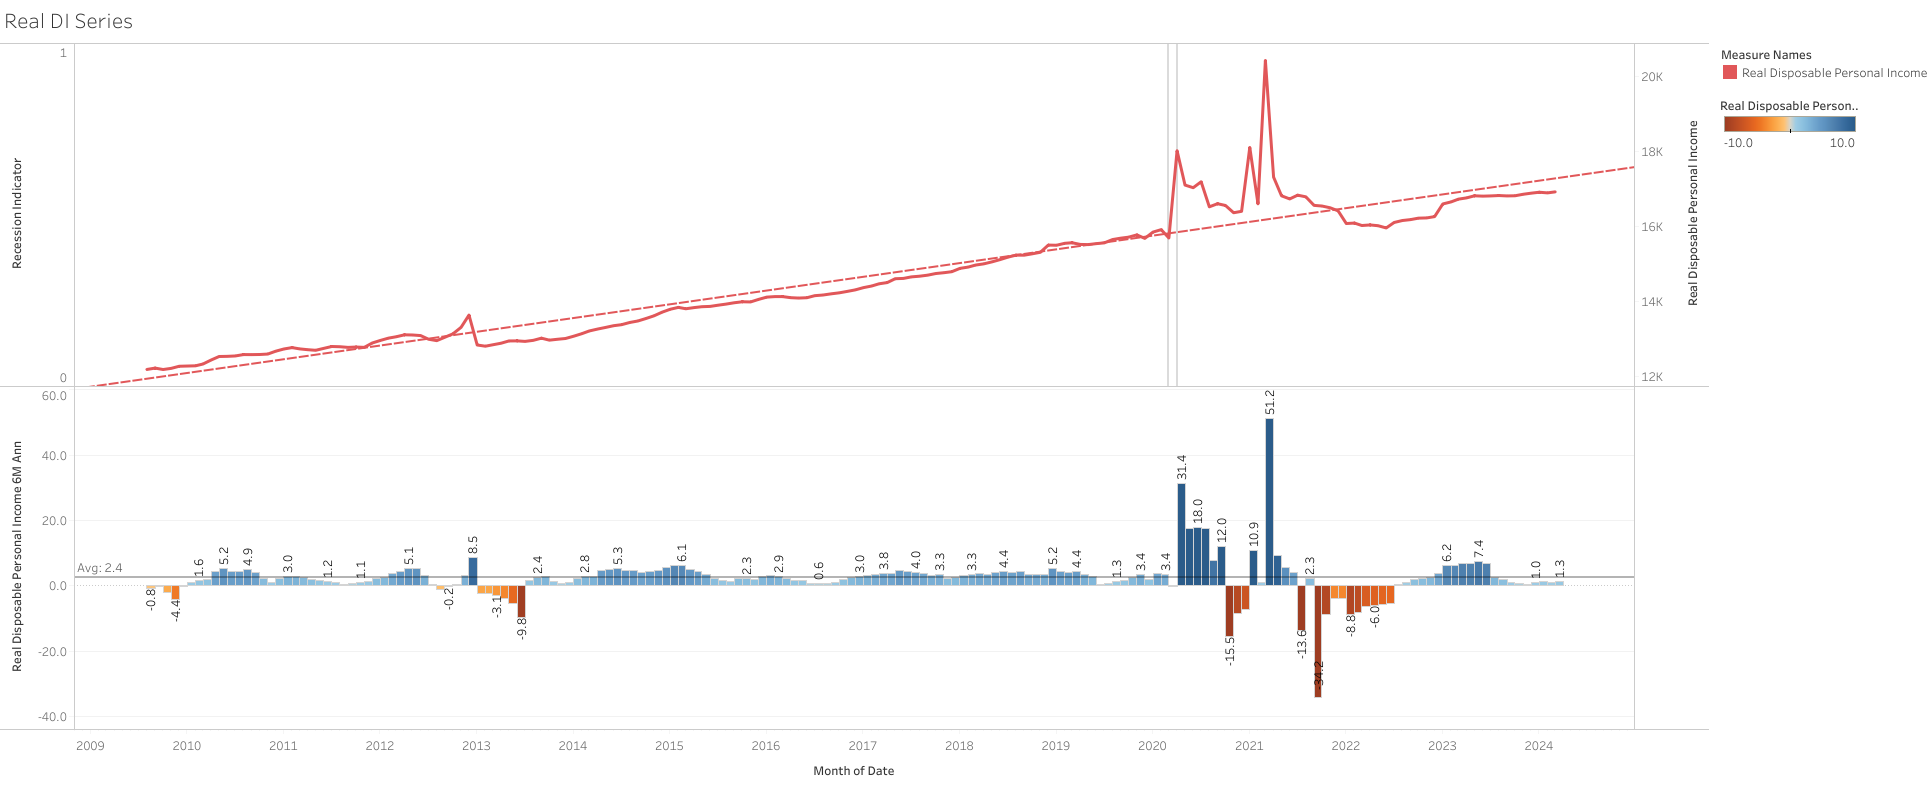
Nominal disposable income grew 1.10% Q/Q (226 B) in Q1 2024, and 4.31% Y/Y.
Income growth comes mostly from compensation (224 B), and government transfers (133 B). That’s why employment and fiscal spending are key metrics currently.
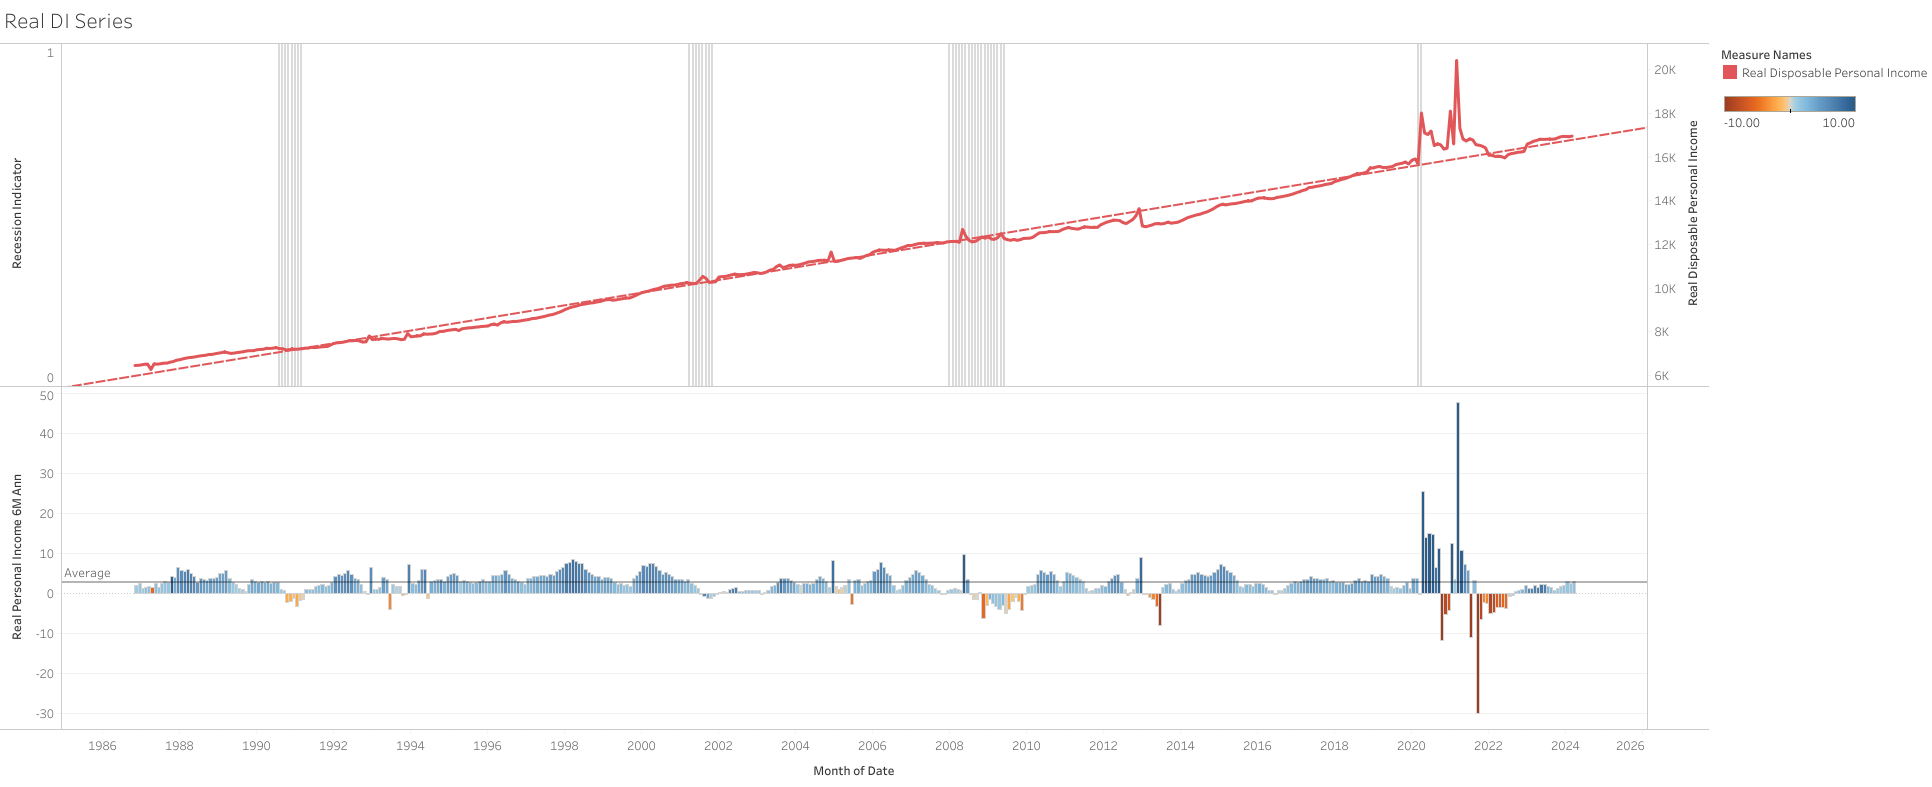
Real disposable income grew only 0.3% Q/Q in Q1 2024, and 1.7% Y/Y.
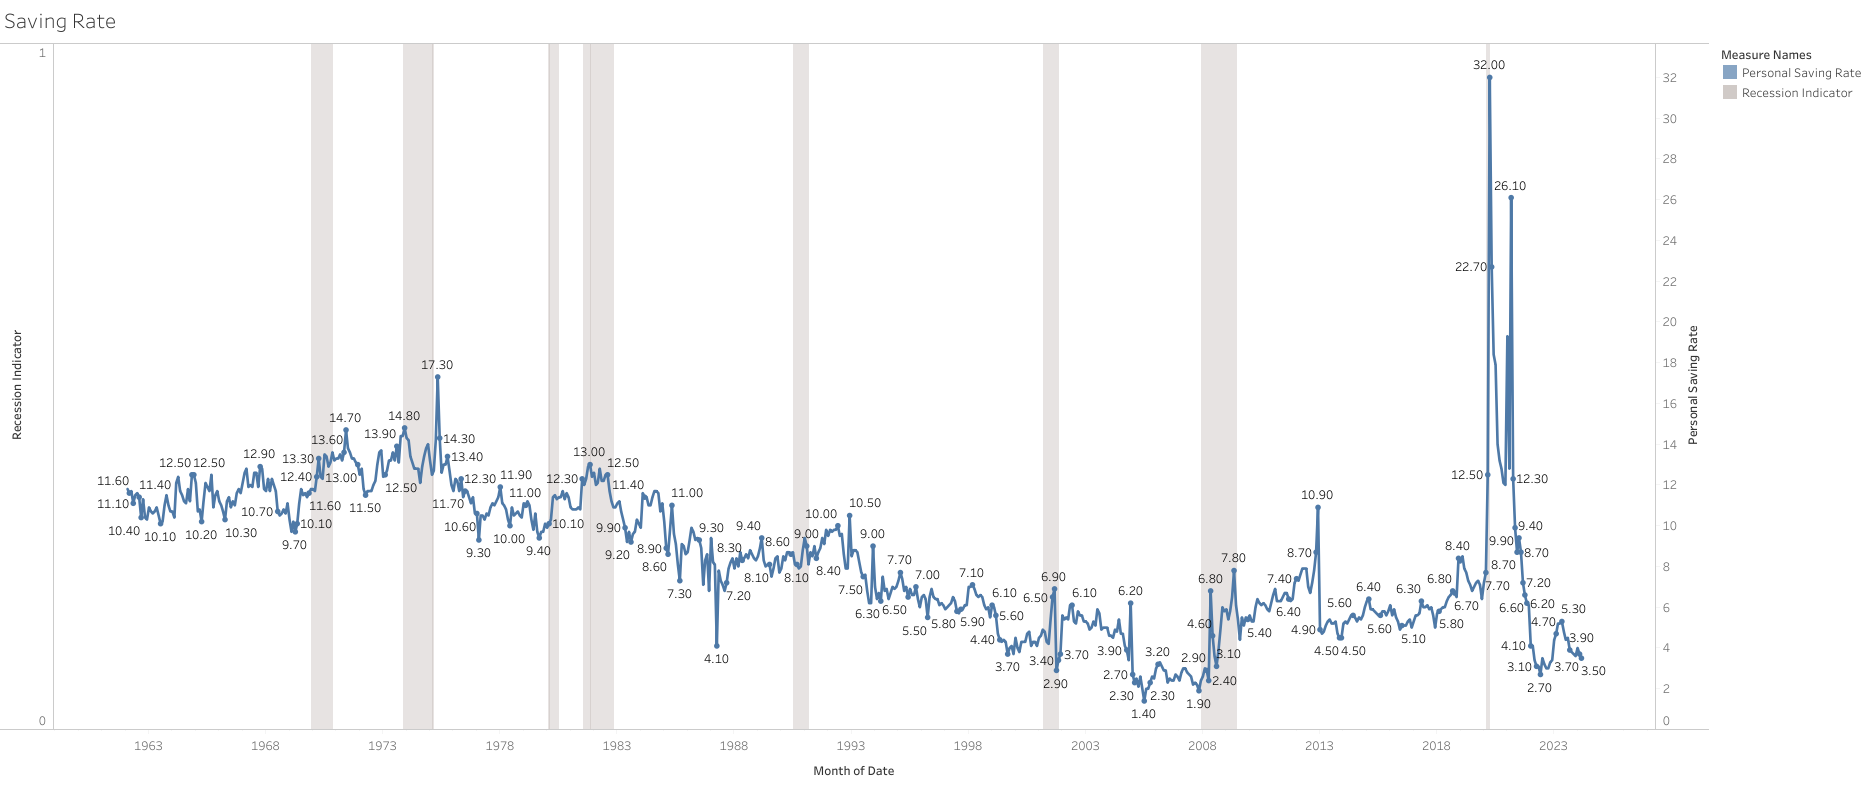
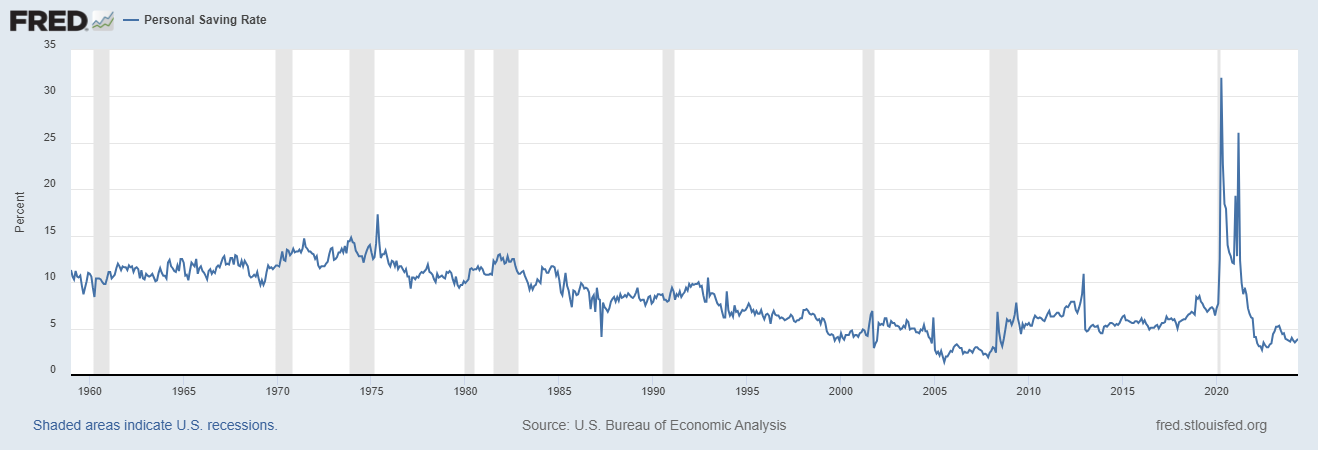
The saving rate ended Q1 2024 at 3.2%, an historically very low level. Before the pandemic 6-7%.
Data: Economic Model - Google Sheets
Tableau: https://public.tableau.com/views/USConsumerIncomeandSpending/RealSpeningandIncomeCurrentTrend?:language=en-US&:sid=&:display_count=n&:origin=viz_share_link
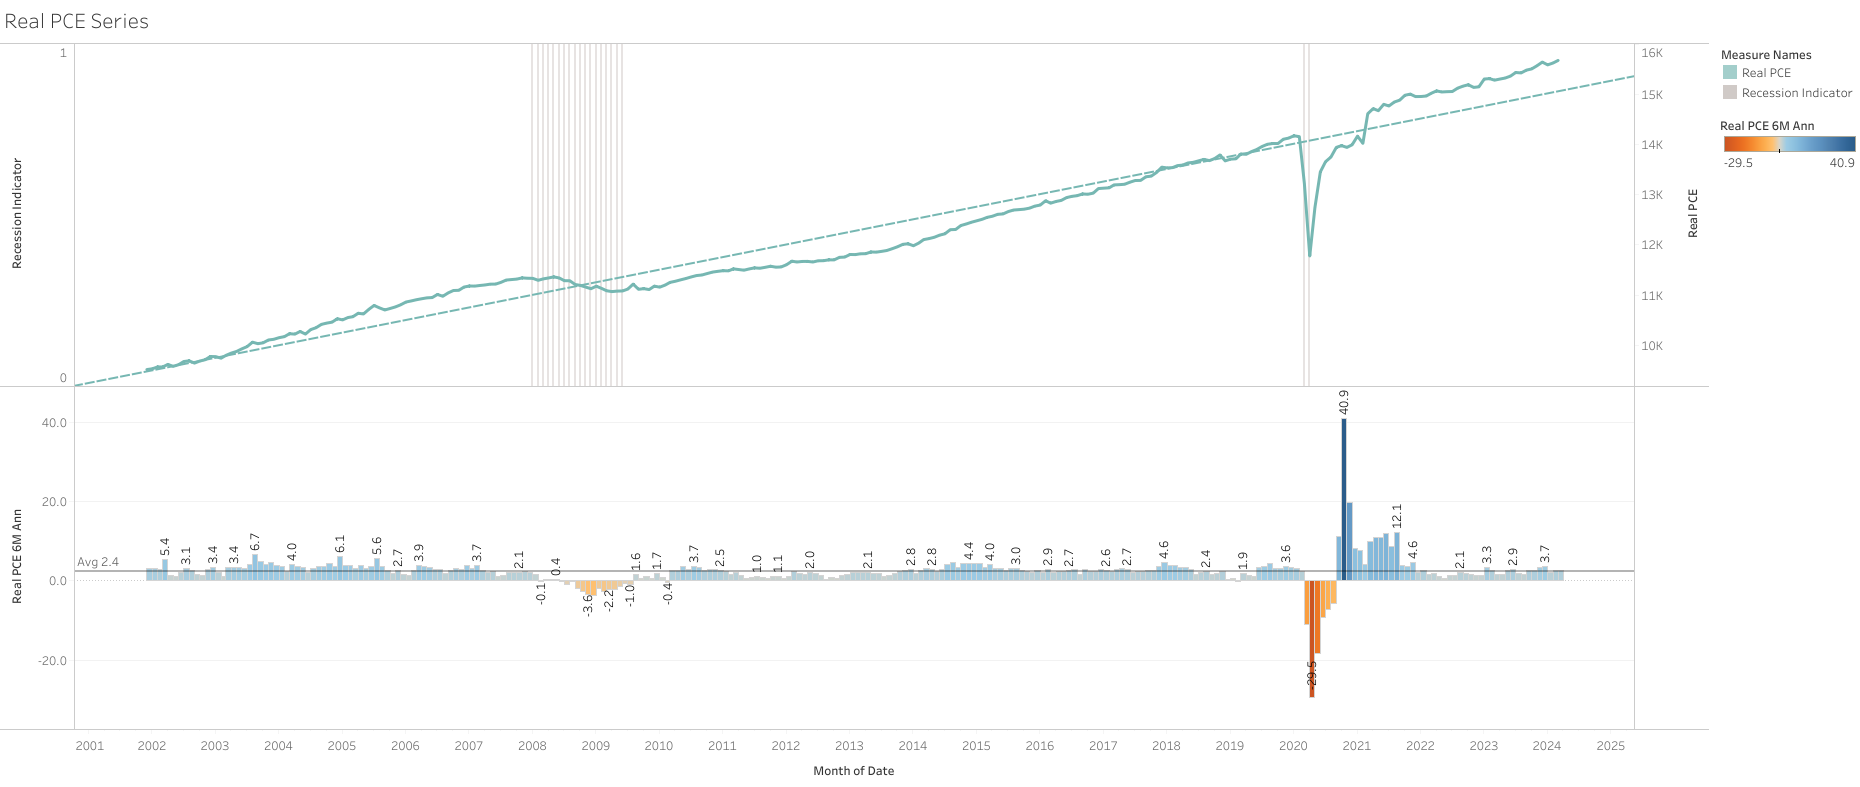
Real consumer spending and disposable income are now running below 2% on a 6M annualized basis.
The current weakness in real spending is coming from the goods sector, durable goods more specifically
Real disposable income has yet to fully recover from the inflation surge of 2021/2022, and growing below the average after 2009.
Saving rate continues to be very low according to history, with not much runway to decrease
This analysis could change based on the pre-pandemic trend line used, I would like to recreate at some point the same analysis using the trendline since 2009, but I don’t think will be that much different.
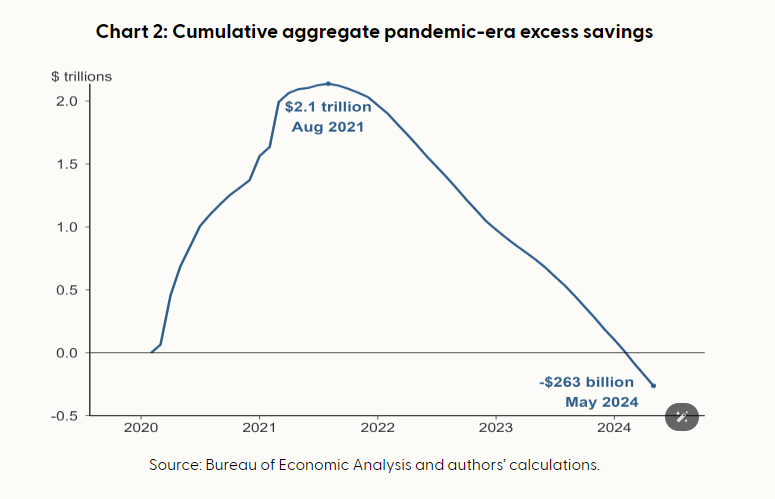
Excess savings defined as the difference between actual savings and the pre-pandemic trend, have been fully depleted.
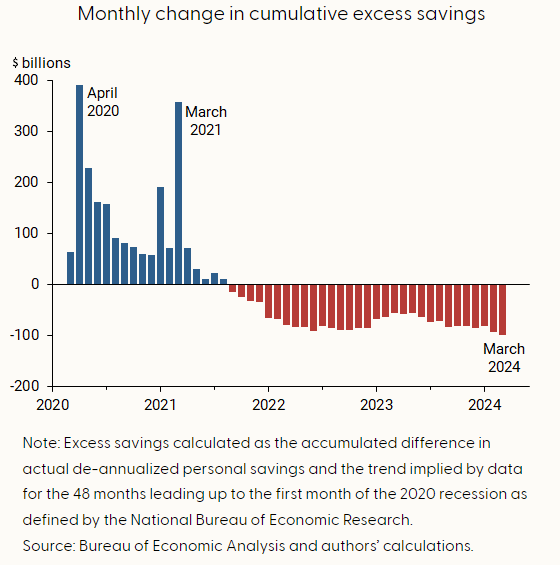
Households drew down their excess savings at an average pace of $70 billion per month since September 2021, although this drawdown accelerated to about $85 billion per month since last fall relative to the average pace for the entire period
What are the consumer’s options now to maintain spending patterns:
Those insights and, especially, the comments about consumers’ options on how to maintain spending are interesting.
If I understand Chart 1 correctly, it shows that consumers are still saving money monthly and have been able to keep holding on to their excess savings?
Only If we consider a scenario in which the consumer would have saved increasingly more every month based on a trend started in 2016 and we compare actual savings with theoretical savings based on that trend we could reach the conclusion that excess savings are drawn down?
If my interpretation is correct, I would say that Chart 2 is a bit misleading and it feels a bit that the SF Fed or someone in the SF Fed that produced those statistics might favor a slightly more accommodative monetary policy.
Overall the most important question obvs. is how large the total amount of savings that consumers have is. Do we already have research on that question? If not I would say it would be a priority. The only indication I saw so far is the 75 trillion in this article which is not accessible anymore.
I don’t see any problem with chart 2 (Is the same chart for everyone that tries to do it), and I don’t know if you are interpreting it correctly.
Their analysis have never intended to say that consumers have negative savings or are not saving money currently. Instead, it focuses on examining the remaining amount of pandemic excess savings (out of trendline) in the economy.
Consumers consistently save money each month; savings have never been negative (this is impossible based on how they calculate it). Even during the worst recessions, consumer savings have never dropped to zero or gone negative. There are likely wealthy consumers who can continue saving money even in challenging times.
In fact, during a recession, consumers often increase their savings a bit, contributing to a decline in spending.
However, the current saving rate is significantly lower than pre-COVID levels, indicating that the amount consumers are saving now is already much lower compared to historical standards.
In my opinion, their analysis is not incorrect either. Consumers on aggregate are always saving money, resulting in a continuously growing stock of savings and assets, along with the overall positive trend in GDP. They are simply indicating that savings have now realigned back with the pre-pandemic trend line. (as if the stimulus shock never happened)
( Overall, imo this trend line analysis is quite good, and would like to implement it more myselft. I’ve seen others, like Eric from EPB, use similar methods for other indicators. It makes sense to me because the economy generally grows in a positive trend, with minor deviations due to the business cycle. This approach helps identify if certain indicators are significantly deviating from recent trends, allowing for an assessment of whether there is a structural change or other reasons for these deviations, whether a return to the previous trend is likely, or simply whether growth is above or below the trend.)
It’s well-known that consumers use their excess savings for increased spending. For me, this analysis only says or is useful to say that this unusual source for spending is now gone, and is how I have seen interpretations of it.
Currently, spending relies on traditional sources that have always existed (their normal savings, assets, wages, and credit)
Regarding consumer savings, here is the data I’ve gathered on household net worth (up to Q2 2023). Those $75 trillion are only for Boomers, including all assets. Overall, households currently have a net worth of $151 trillion, with about $32 trillion in liquid assets.
How much is going to be for spending, is not clear, but the majority of net worth is on the very wealthy that don’t need to take their savings or assets to spend money.
And I always make this point: savings and net worth consistently grow with the economy, but this growth has never prevented a recession, so I am not sure or never understood well the argument why this stock of savings/net worth would prevent one now.
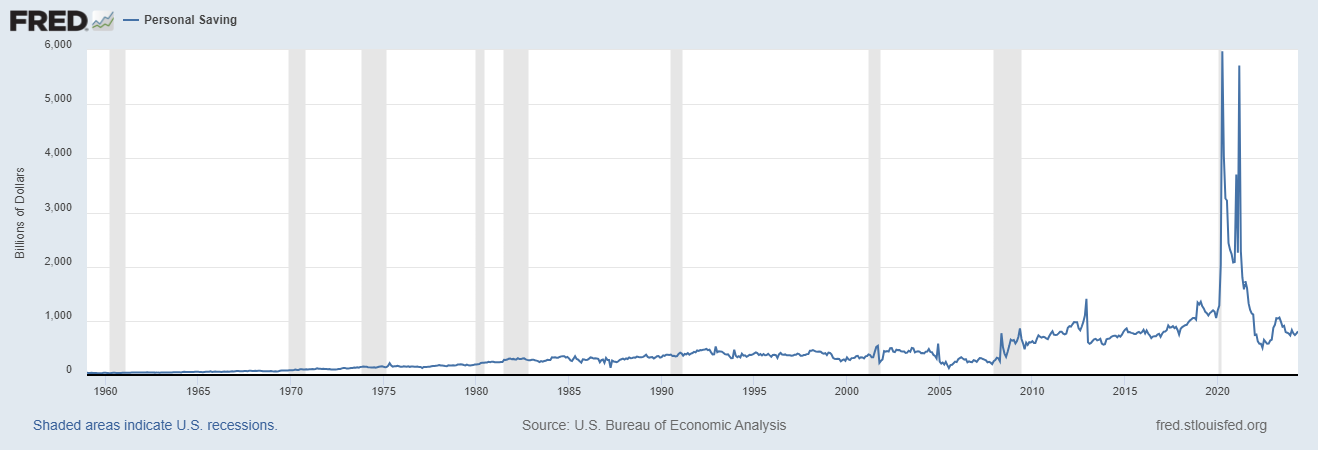
I don’t think one can simply take data from a strongly growing trend (from 2016 to 2020) and extrapolate that into the future. They are assuming that based on that trend line annualized personal savings should be in the 2 trillion dollar region by now which seems aggressive to me.
If you look at the chart of personal savings that you posted, you can see a very strong increase in savings from 2008 to approximately 2013. This trend could also not simply be extrapolated. (If you want to exclude the recession the trend was also strong from 2010 to 2013)
So I think in the wrong context e.g. on Twitter Chart 2 would certainly paint a misleading picture because the trend line is too optimistic. I would therefore argue that some of those excess savings are still there but I recognize that nominal savings currently are only as strong as in 2018, and there has been inflation and wage growth, so savings in % of income is weaker.
In the end, for predicting economic cycles, the savings rate might not even be the most insightful but rather savings in the lower percentiles.
Over time it should probably be possible to find out which consumer group is most correlated with a recession and how to understand the exact signs we should look for for measuring the health of that consumer group?
Yes, savings was always positive, but why can’t it never be negative based on how they calculate it?
Thank you for this useful wealth data.
It is not only useful for predicting a recession but mainly to understand wealth, valuations, etc. So how does the wealth of households compare with the market cap of the stock market or assets like bitcoin as an example.
You mention 32 trillion in liquid savings but the chart in the Wiki only shows 18. Is this a mistake?
I think for most tables it is always great to have a “total” column to get a fast overview of the total amounts.