High-level overview for Q2 2024 US Index Earnings
Refinitv SP500 Earnings Estimates
-
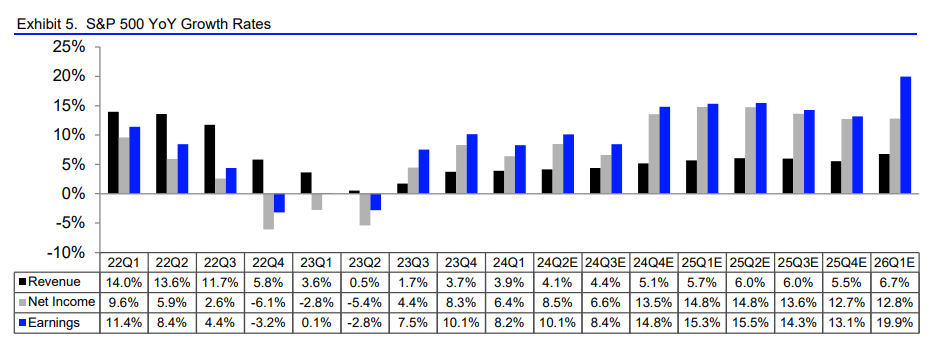
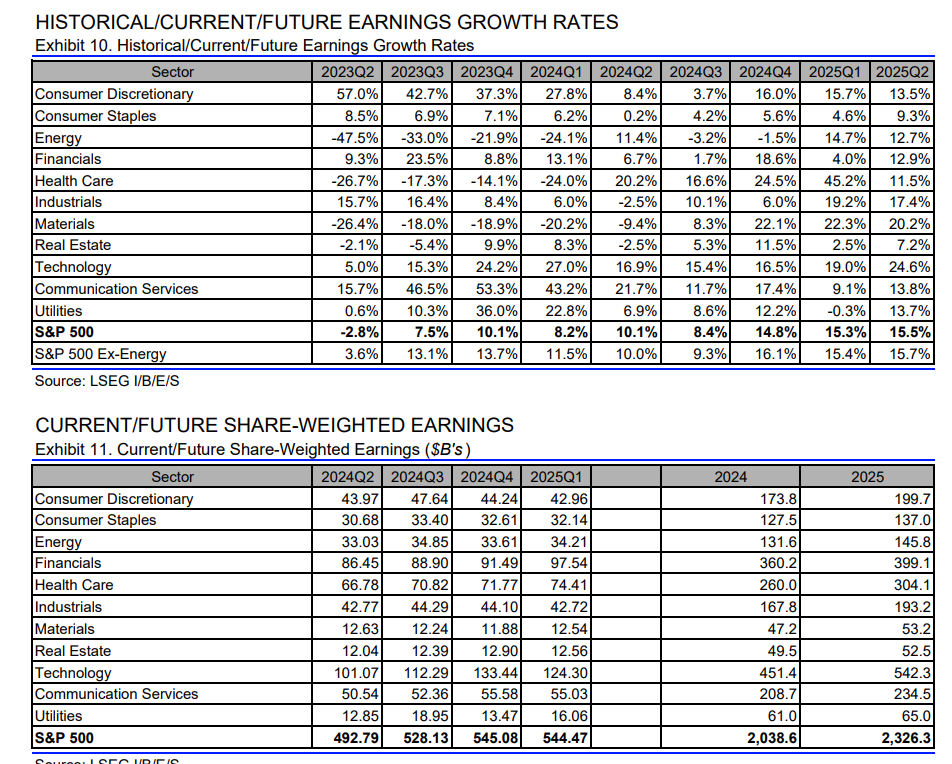
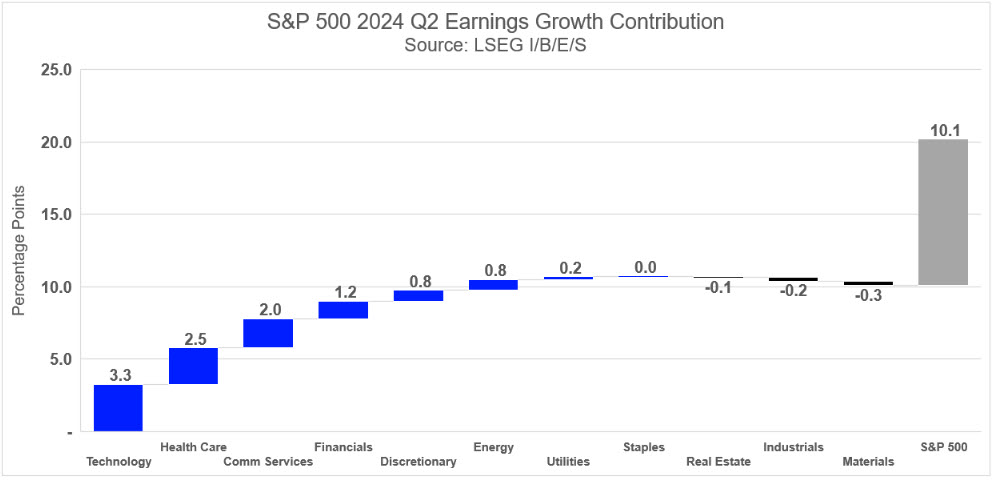
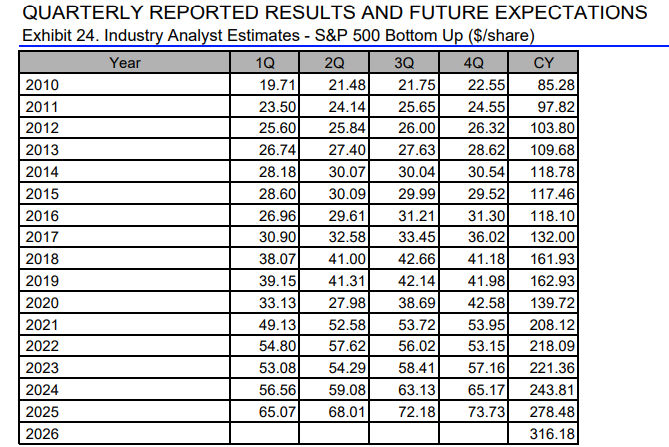
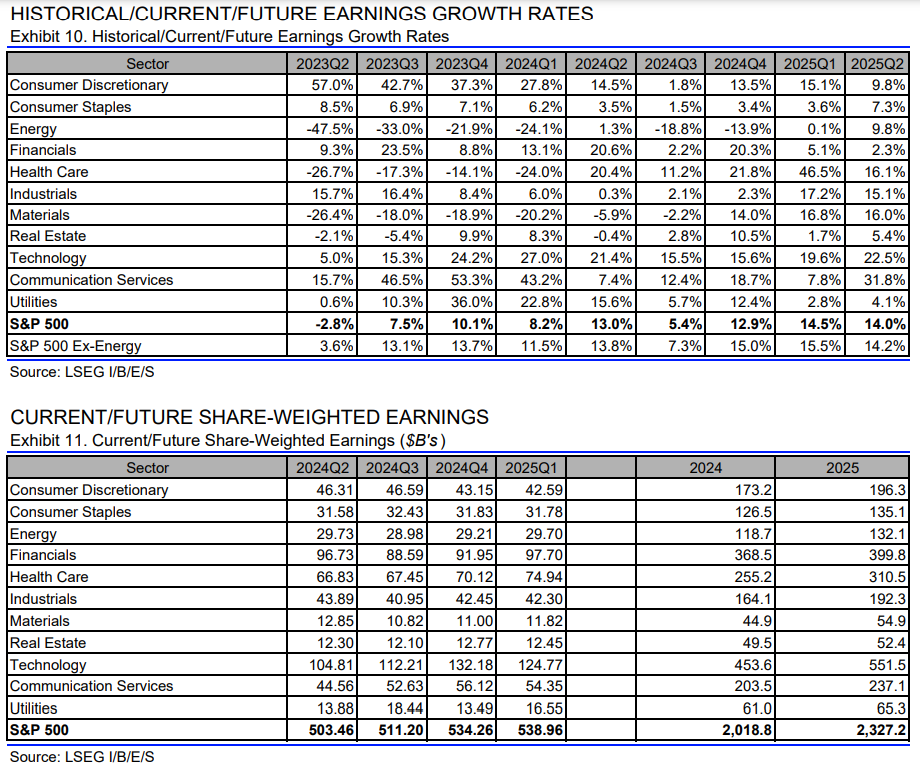
Q2 aggregate earnings current estimate of $492.8 billion (+10.1% y/y, +4.4% q/q).
Growth expectations have only declined moderately by 40 basis points (bps) heading into earnings season, much less than the typical 300 bps downward revision we usually find.
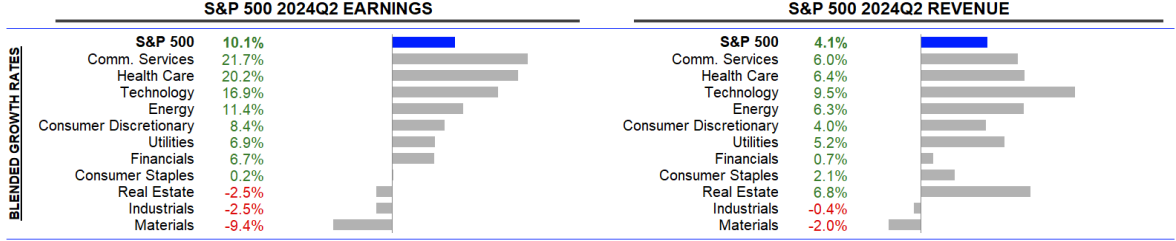
Energy saw the largest downgrade of 450 bps, followed by Materials (310 bps), while Information Technology has seen the largest upgrade (150 bps).
-
The Magnificent-7 are once again expected to play a significant role, boasting an aggregate earnings growth rate of 29.8%. Excluding the Mag-7, the S&P 500 Q2 earnings growth declines to 6.6%. The Mag-7 have an aggregate revenue growth rate of 13.4%, compared to 4.1% for the overall index.
-
EPS expected to be 59.08, an 8.82%Y/Y and 4.45% Q/Q, from 6.80% Y/Y in Q1 2024.
-
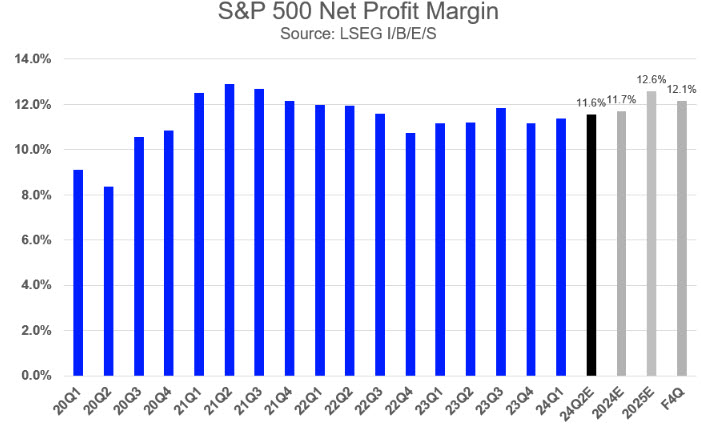
The 2024 and 2025 full-year estimates EPS are currently 11.7% and 12.6%, respectively, while the forward four-quarter estimate is 12.1%.
-
Net profit margins have remained stable heading into earnings season, with a Q2 estimate of 11.6%.

1 Like
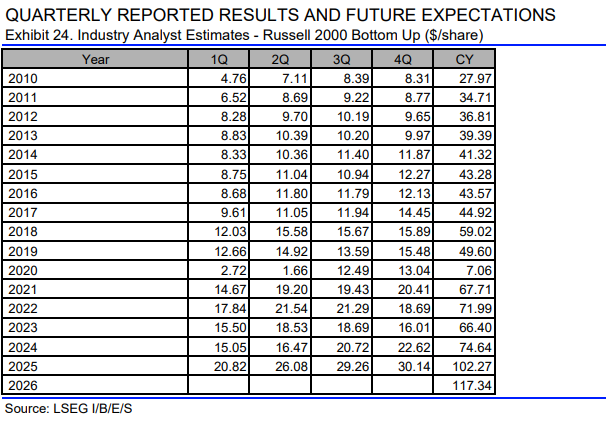
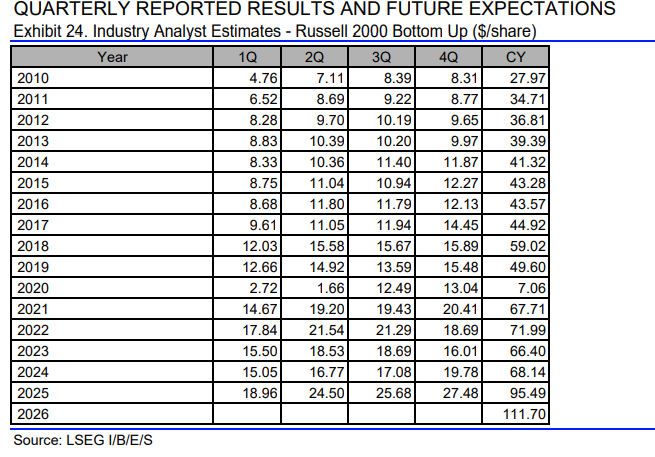
Refinitv Russell Earnings Estimates
-
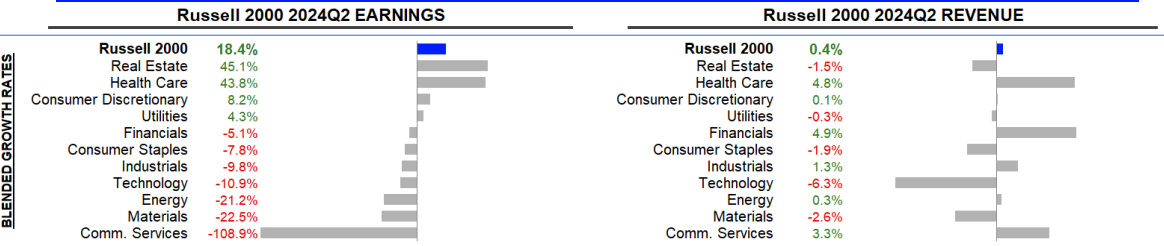
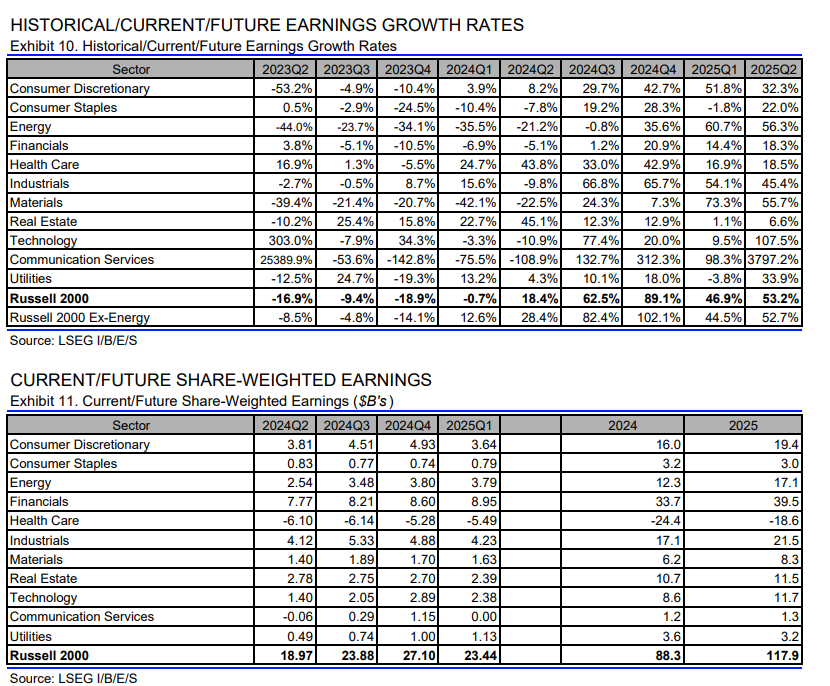
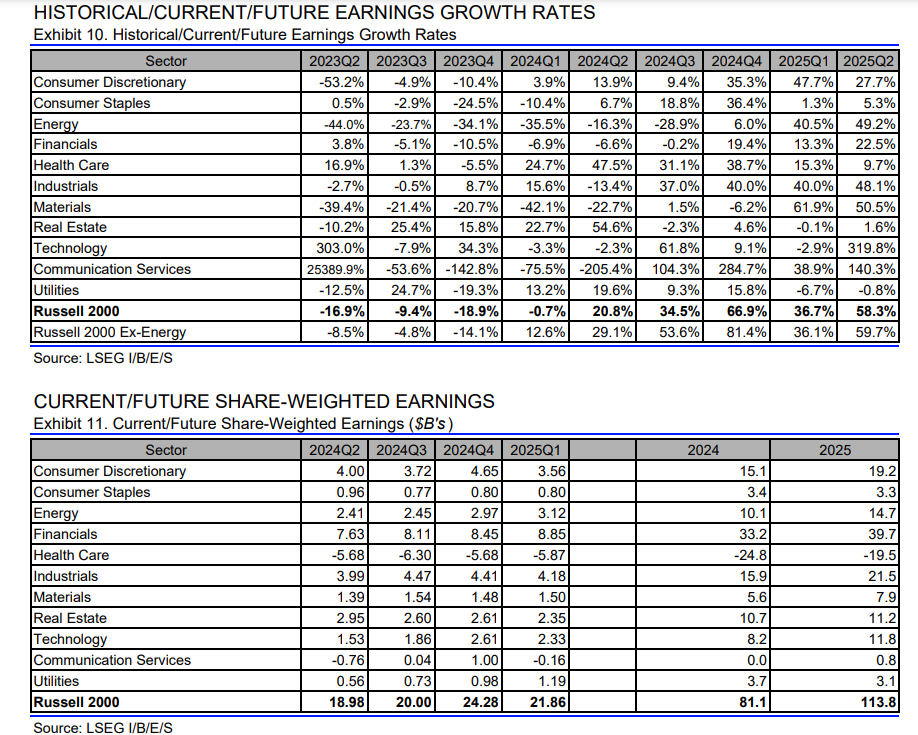
Russell weakness continues with expected revenue growth of 0.4% Y/Y, expected earnings of 18.4% Y/Y, and net income -6.5% Y/Y
-
Expected earnings at 18.97B in Q2 2024, and 88.3B in 2024.
-
EPS anticipated to reach 16.47, -11.11% Y/Y, and and 9.43% Q/Q.

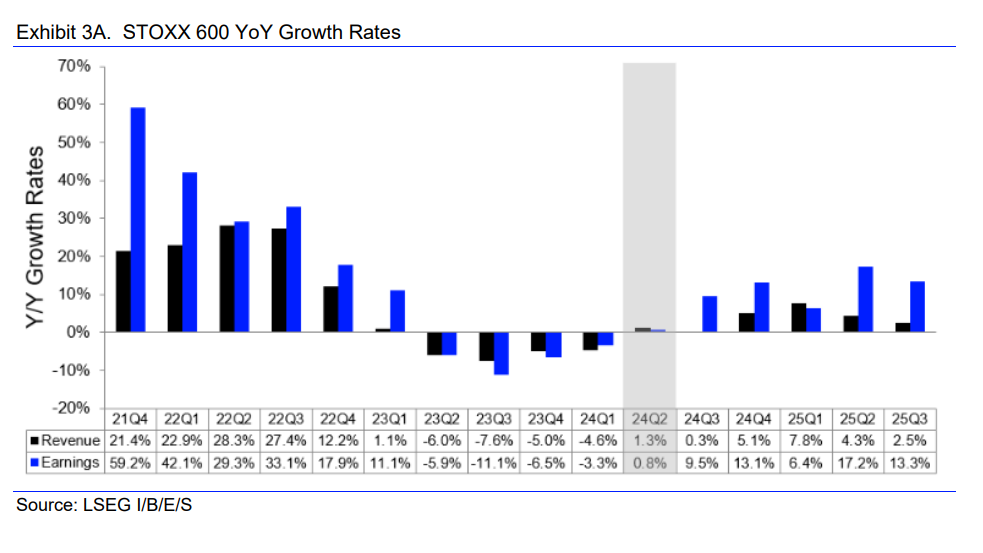
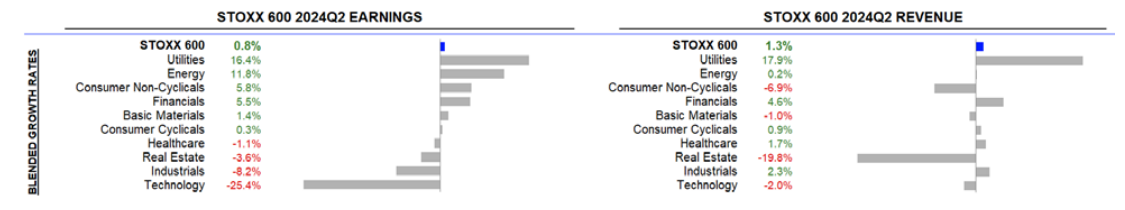
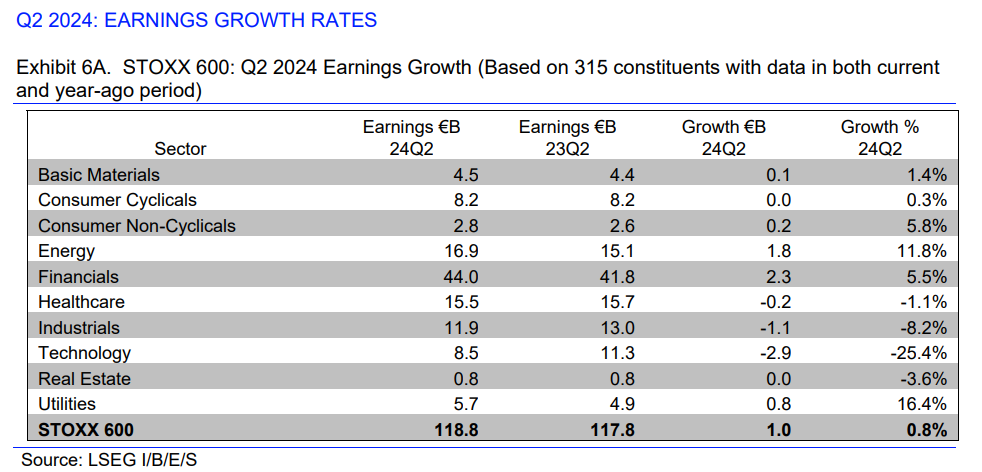
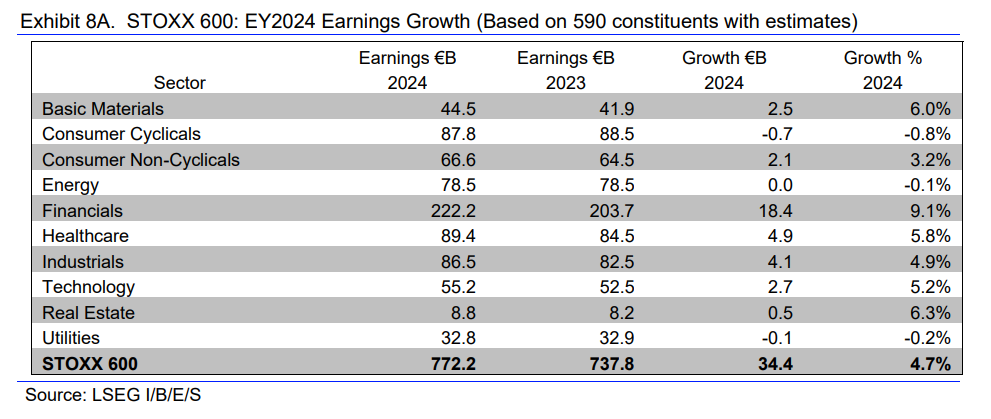
Refinitv STOXX 600 Earnings Estimates
-
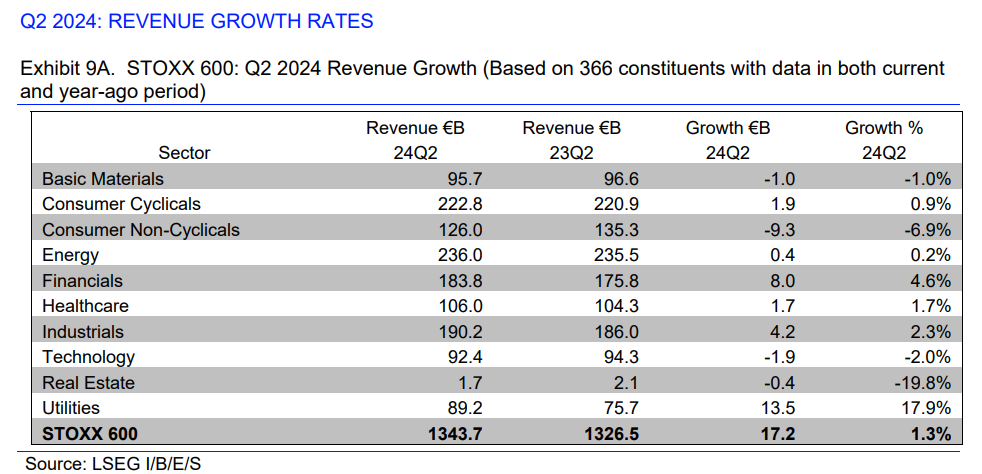
STOXX 600 expected revenue growth of 1.3% Y/Y, expected earnings of 0.8% Y/Y
Slightly positive after several quarters of declines.
-
Expects to see share weighted earnings of €118.8B in Q2 2024, compared to share-weighted earnings of €117.8B in Q2 2023 (0.8% Y/Y)
-
The STOXX 600 is expected to earn revenues of €1343.7B in Q2 2024, compared to €1326.5B in Q2 202 (1.3% Y/Y)
-
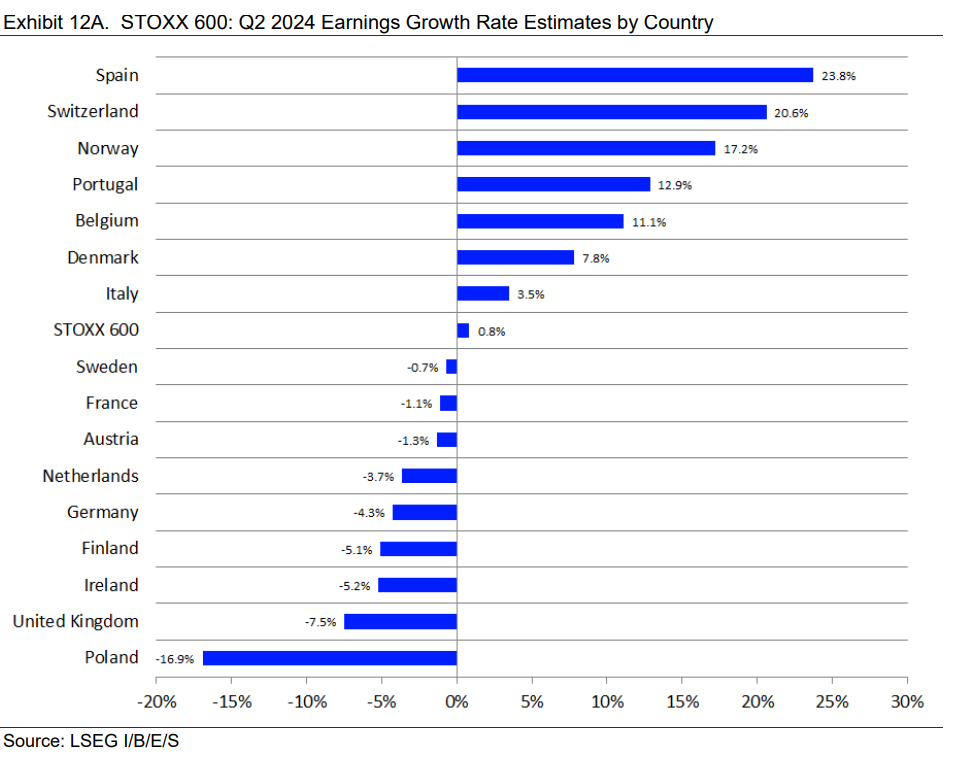
Analysts expect positive earnings growth from 7 of the 16 countries represented in the STOXX 600 index.
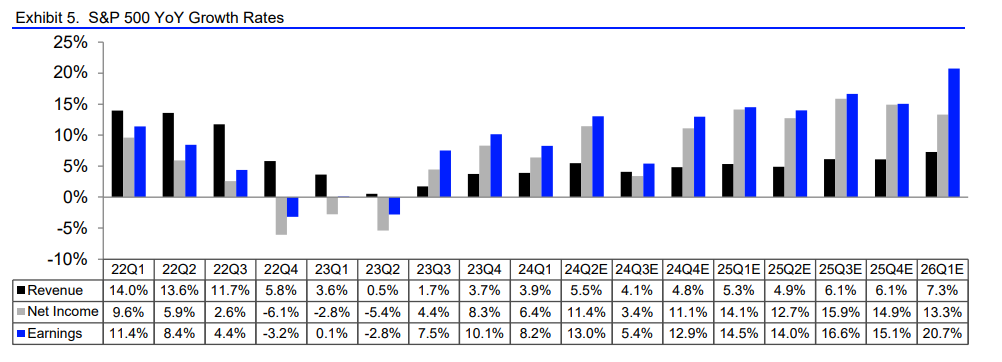
The overall earnings growth for the S&P 500 in Q2 2024 was 13.0% Y/Y vs 10.6% expected at the end of June, according to Refinitiv.
- Net income 11.4% Y/Y
- The aggregate revenue growth for the S&P 500 was 5.5% Y/Y for Q2 2024 vs 4.2% expected.
- EPS Y/Y growth of 11.95% to 60.78, an all-time high after weakness in 2022.

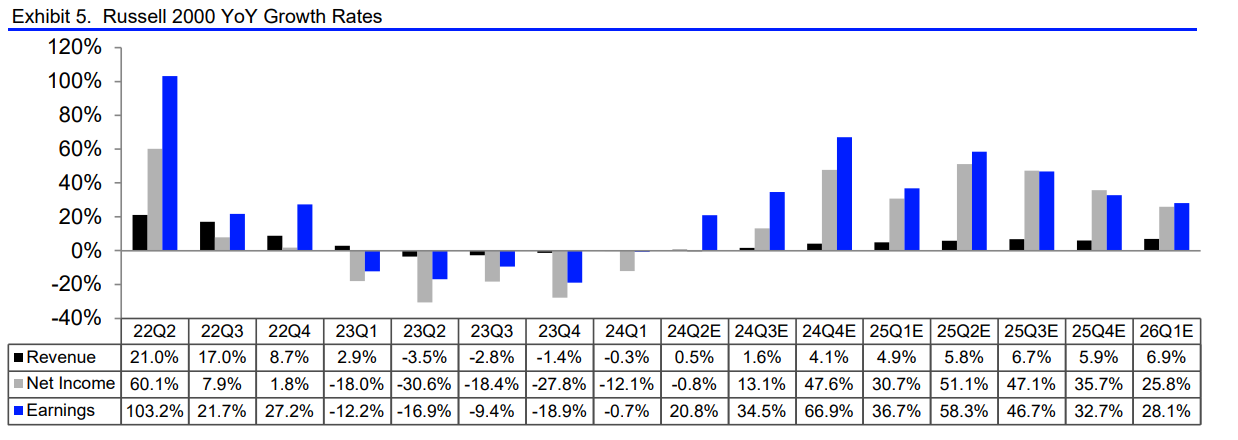
The overall earnings growth for the Russell 2000 in Q2 2024 was 20.8% Y/Y vs 19.5% expected at the end of June, according to Refinitiv.
- Interestingly enough, net income was still negative at -0.8% Y/Y
- The aggregate revenue growth for the S&P 500 was 0.5% Y/Y for Q2 2024 vs 0.5% expected.
- EPS Y/Y growth was -9.5%, still very weak.
What is the difference between earnings and net income according to Refinitiv methodology? Why was the difference so large in the Russel 2000 last quarter?
Refinitiv Methodology is not available, my guess for now is that earnings are most likely something like operating earnings or EBITDA.
SP Global, also reports both operating earnings per share and as reported earnings per share.
Since small-cap companies are known to be very indebted, a lot of their operating earnings are most likely going to interest expenses, and with refinancing rates higher than before, their expenses are more likely continuing to increase. (this is part of my arguments for companies needing to continue cutting costs since small companies are the vast majority in the country and the majority of employment comes from them)
1 Like
Hmm, I think it has to be operating earnings (EBIT) because including depreciation and amortization does make little sense and S&P is also using operating earnings.
I think as well that the difference being attributable to interest expenses makes a lot of sense.
Overall I think we should continuously build defitions in the Wiki and link to it so that certain differentiations become way easier for the reader when reading a post like this.
When researching the topic I found this article interesting. It talks about a 3% Russel 2024 EPS growth estimate consensus and shows that EPS targets for small caps have been consistently revised downwards. It also mentions that more than 40% of Russell 2000 companies are unprofitable. (You talked about here as well) and has a longer report attached to it. Those reports should always be interesting for us, first in order to see if they have good elements and second because we want to start collecting them (maybe in Miro) in preparation to eventually creating our own more condensed reports.
1 Like
I have heard about these negative revisions being the problem for small caps, there is always hope they will get better but it doesn’t. It makes sense because while the SP500 and Nasdaq are at all-time highs, the Russell have struggled to get to the previous one even.
Overall I think small caps probably offer better insights into the overall economy because SP500 is very concentrated and biased towards those very big companies, that will barely struggle if at all during challenging conditions. Or it would to cool if, at some point, we could see earnings in a way that we are able to separate the effect those big companies have in the aggregate index.
I will continue to save those articles on the Miro board when I encounter them.