This topic discusses Match Group’s user engagement trends. For past user engagement trends, visit our Google Sheets and research on Notion.
1 Like
I=6
Tinder’s user engagement has improved compared to the previous four quarters, Apptopia mid-quarter data shows
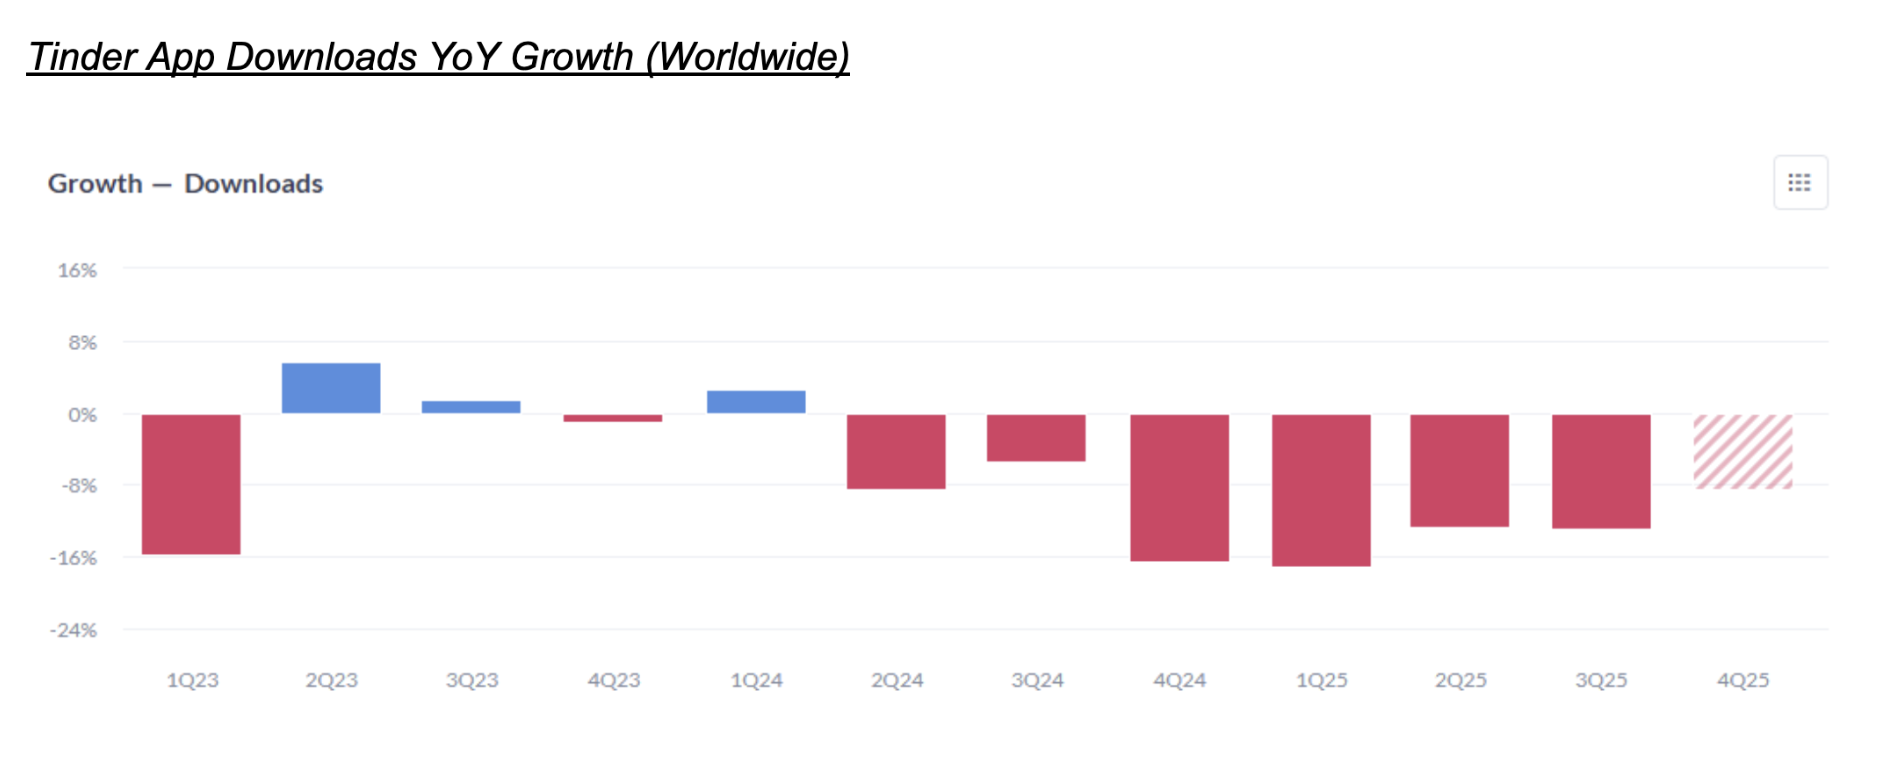
- According to Apptopia, Tinder’s app downloads were down 8% y/y in Q4 2025, an improvement from the previous four quarters (Q3 2025: ~-12%).
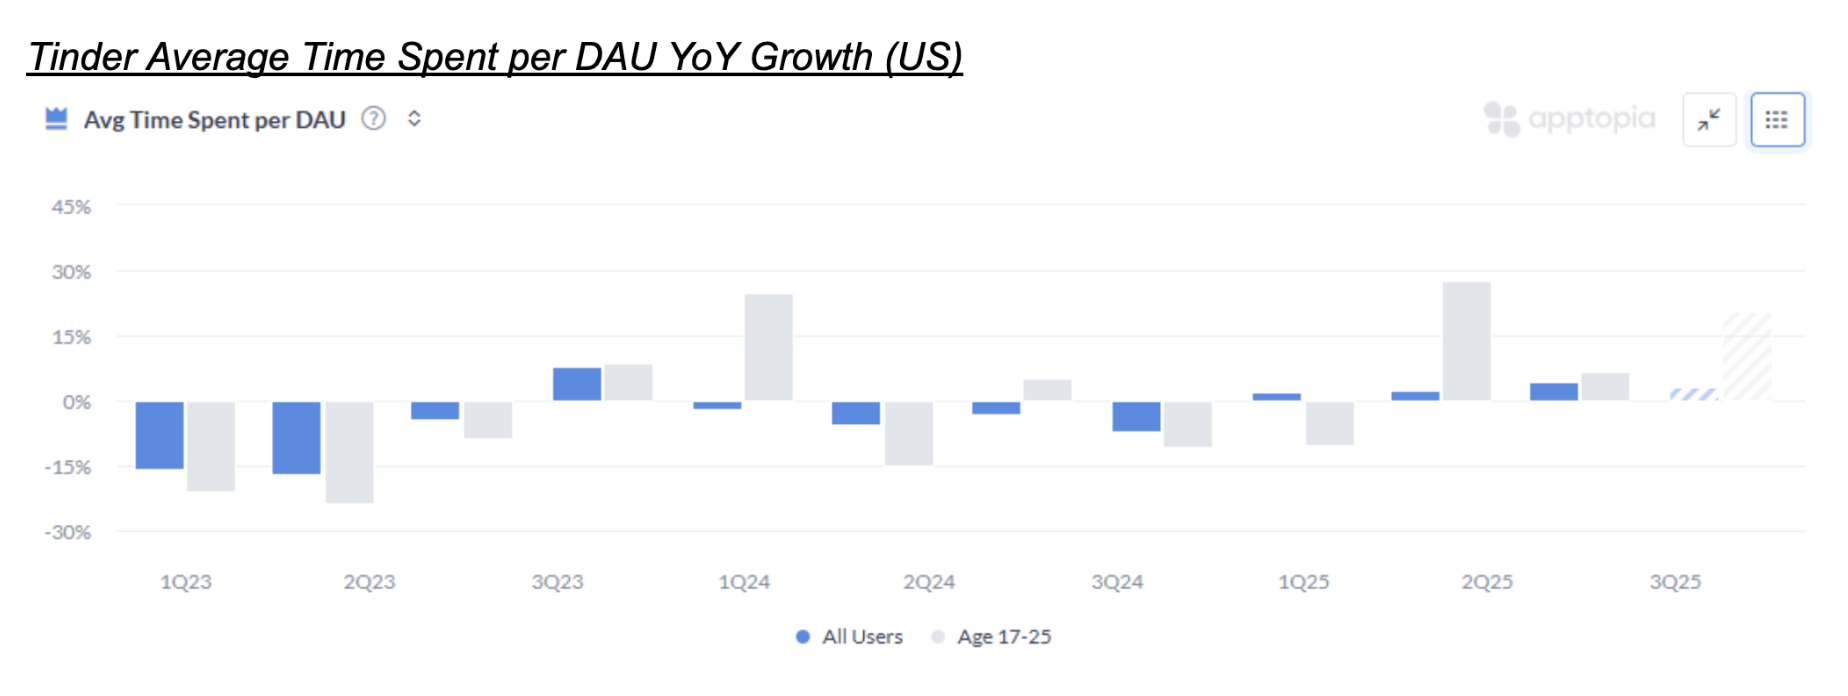
- Time spent per day by users aged 17-25 was up 20% y/y compared to +3% y/y for all users.
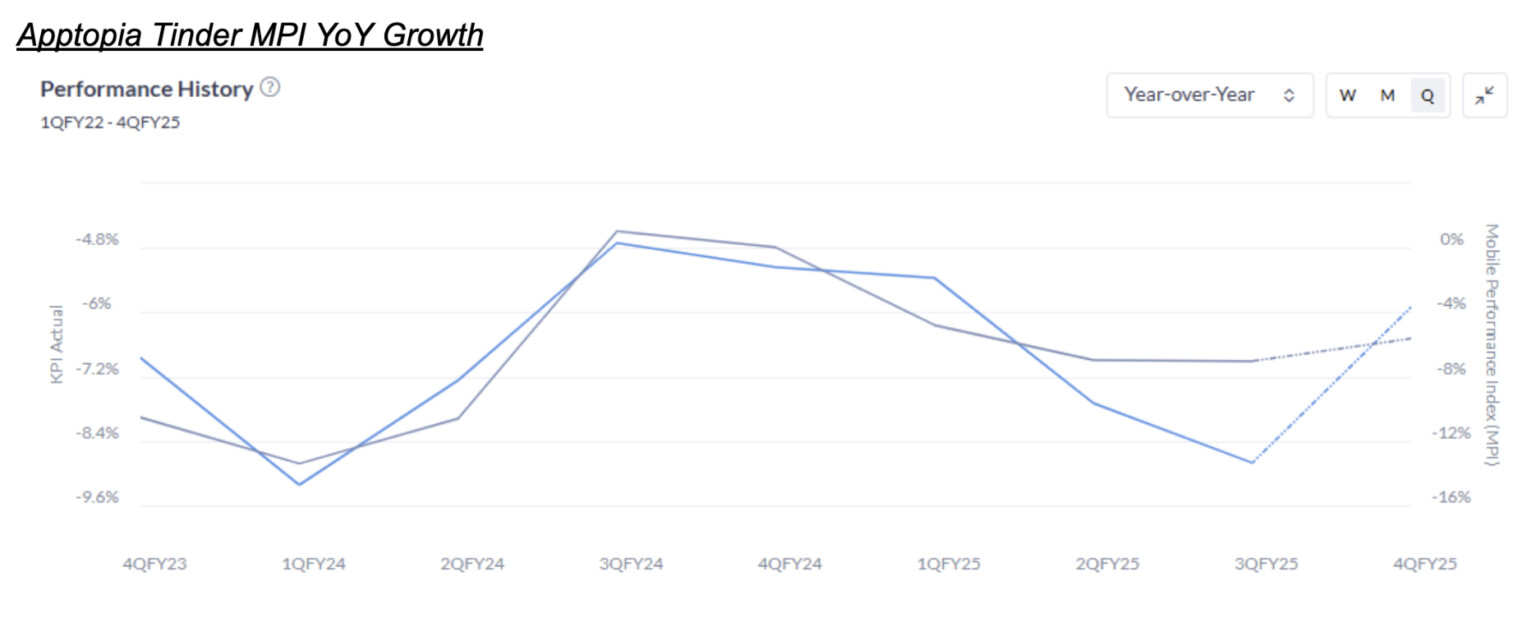
- It indicates payers were down 4% y/y compared to -14% y/y in Q3 2025.
Assessment
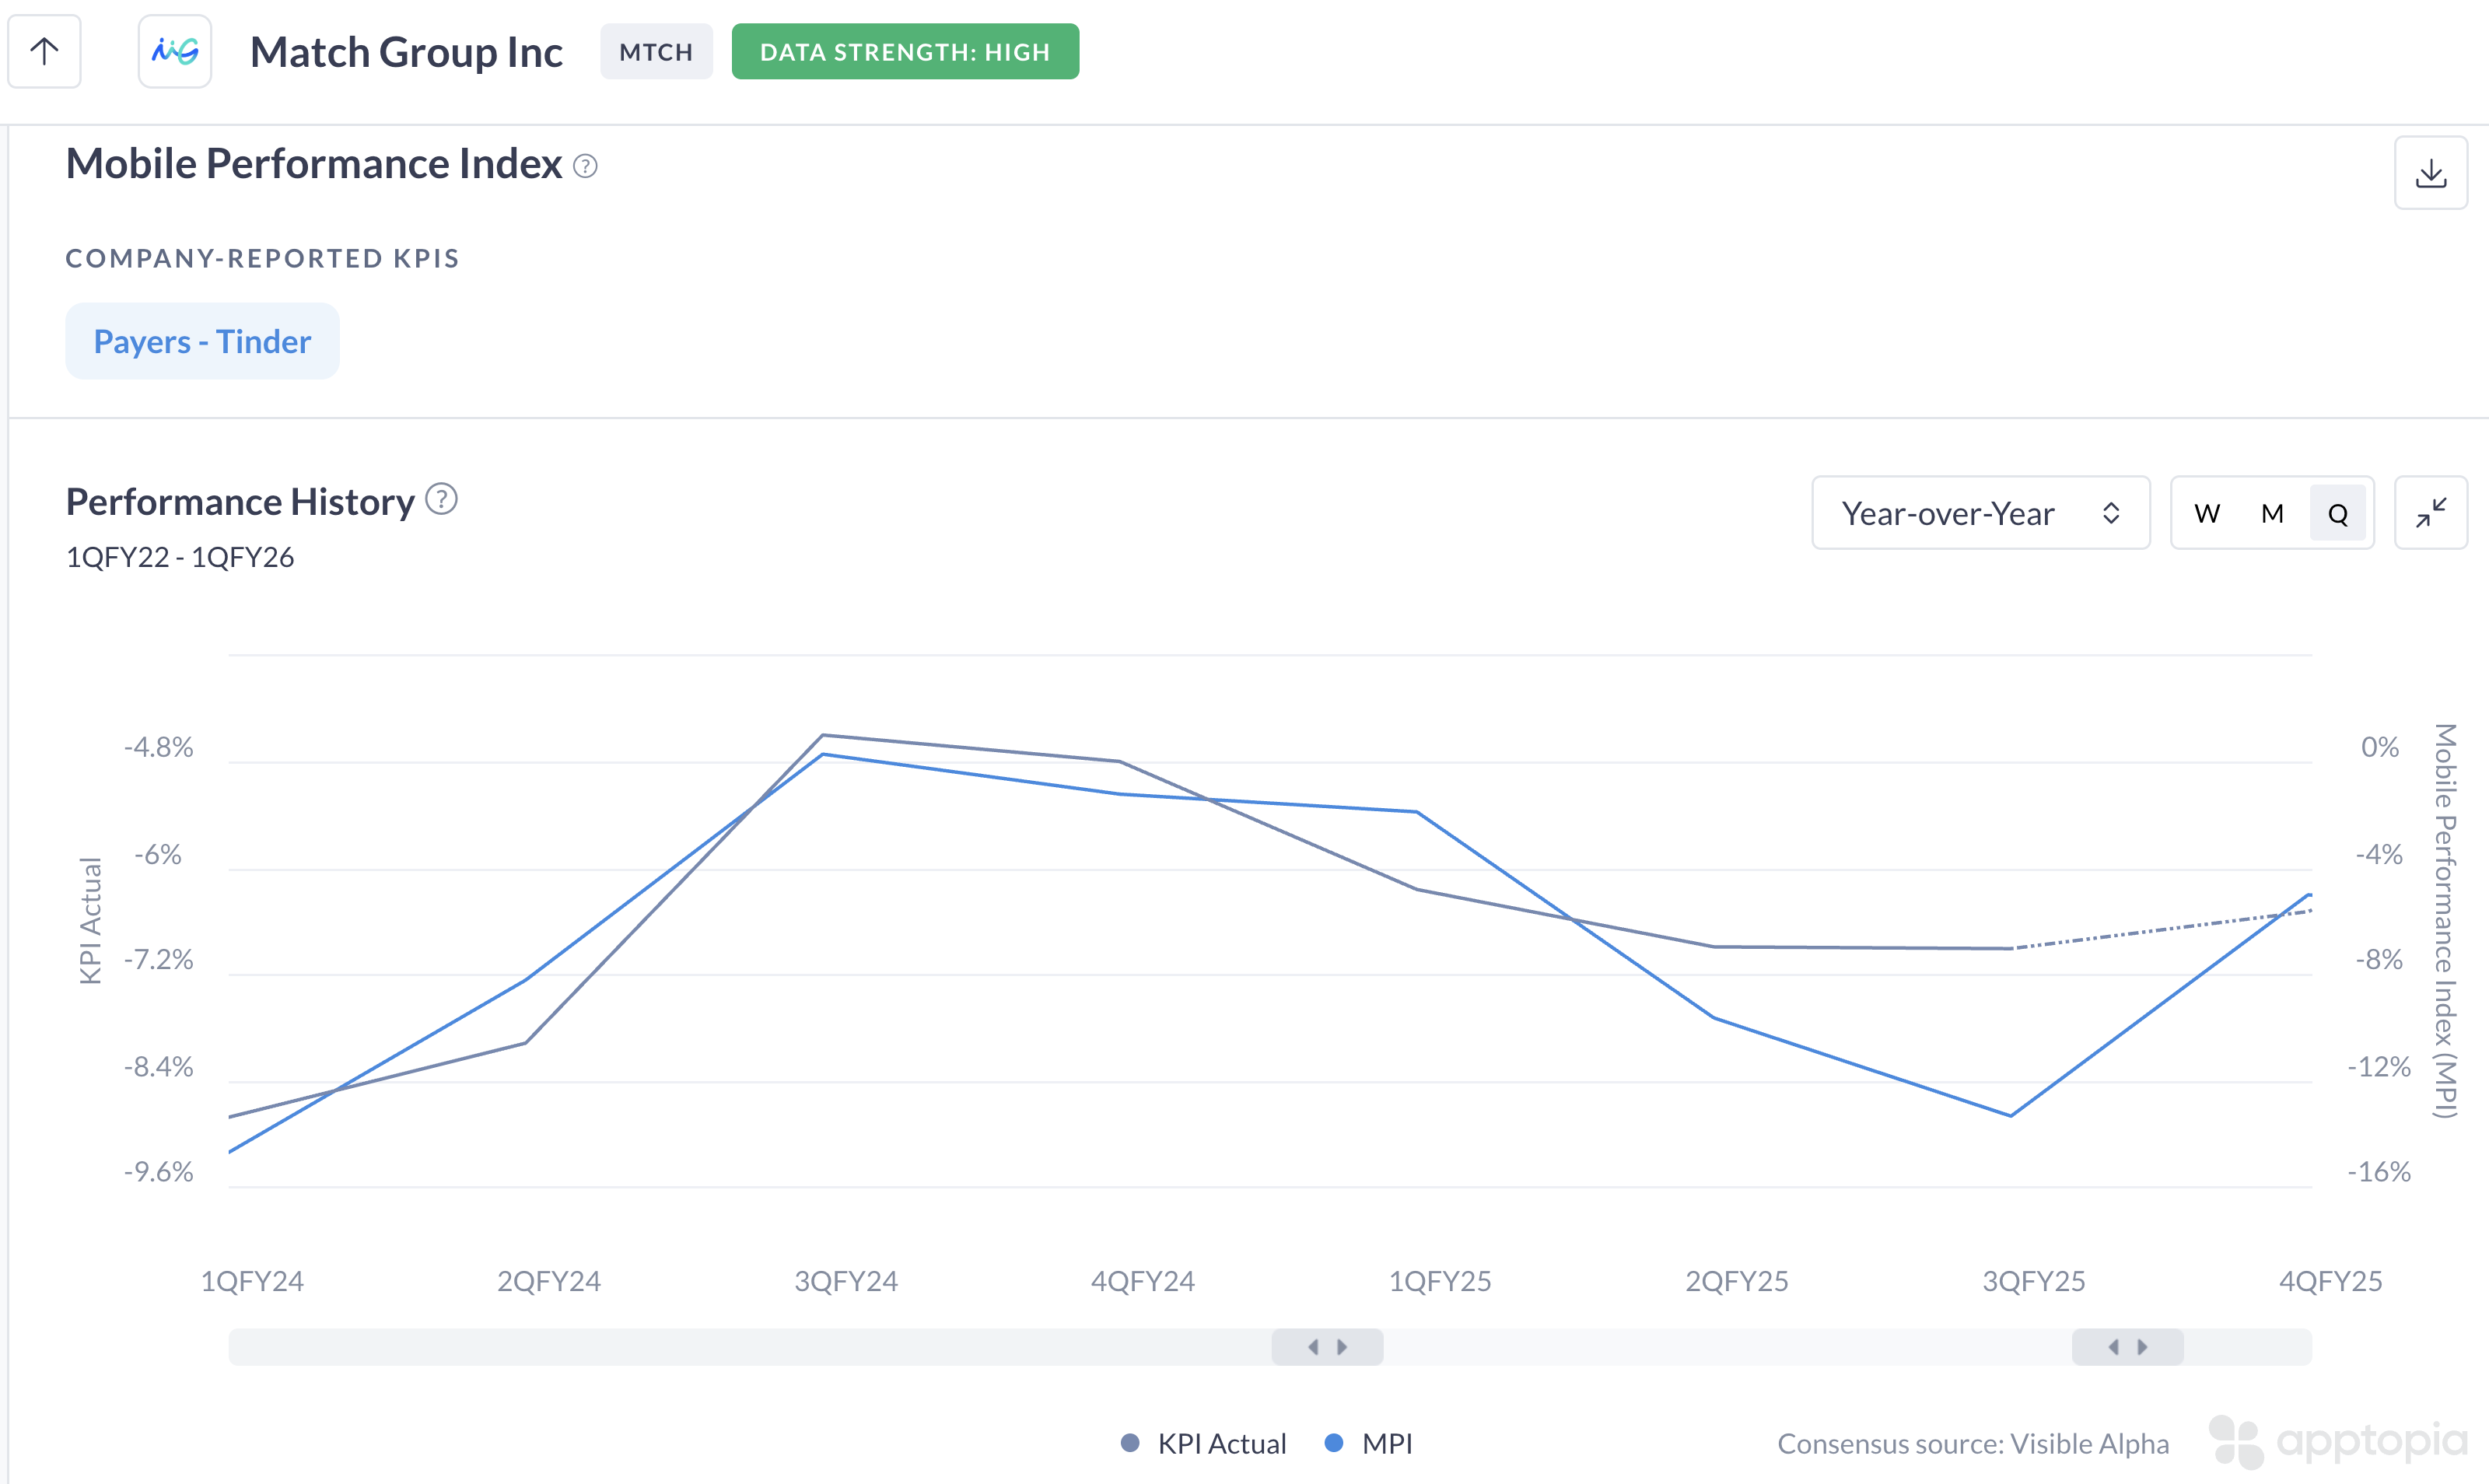
When comparing Tinder’s company-reported payers growth of –7% in Q3 2025 with Apptopia’s estimated payers growth of –14%, the figures deviate materially. As a result, Apptopia data should be used primarily to assess directional user trends rather than absolute payer growth levels.
1 Like
I agree with your assessment here. The data also looks quite volatile esp. on time spent, which makes it harder to weigh it as a credible data point. Nevertheless interesting data. I think by having multiple of those datapoints by various reputable sources it might be possible to gain a somewhat accurate/indicative picture esp. if we are able to establish a correlation to the official data by the companies.
I=6
Latest Apptopia data shows material deceleration on time spent on Hinge and improvement in time spent on Tinder in Q4 2025
-
According to Apptopia data released today, Average Time Spent per DAU of younger users, aged 17-25 on Hinge, is down 29.7% YoY while that of all users is down 16.2% YoY.
-
While Hinge’s US daily active users (DAUs) is up 7.1% YoY, downloads are down 4.1% YoY.
-
While Tinder’s downloads in the United States are down 4.2% YoY, it’s improving sequentially.
-
While Tinder’s daily active users (DAUs) fell 7.5% YoY in the US, Average Time Spent per DAU of younger users, aged 17-25 on Tinder, rose 13.9% YoY versus +5.1% for all users.
-
Apptopia’s Mobile Performance Index (MPI) for Match Group, which it says correlates with the actual payer numbers, is also improving.
Assessment
The report on Tinder users doesn’t deviate much from their mid-quarter report which they published in December.
Their report on decelerating time spent on Hinge could be true given YouGov data also signals a sharp decline in Hinge’s popularity in 2025 (Dating Apps User Trends). If additional data confirms declining usage of Hinge, then it would be positive for Bumble.
Any idea yet how reliable those datapoints are?
Why would declining usage of Hinge be positive for Bumble?
YouGov data is based on actual user surveys but the number of respondents is not very big (900-2,000 in the case of Hinge).
Based on Apptopia’s chart above, their MPI index closely tracked Tinder’s payers between Q1 2024 and Q1 2025. However, from Q2 025, there was material deviation.
Overall, I think this data points can only be use to get a picture on the current user behavior, whether it’s improving or deteriorating and not to predict actual user numbers.
In my opinion, declining usage of Hinge buys Bumble time until its product offensive pays off as it limits shift from Bumble to Hinge.
Cool, can you link the insights regarding Apptopia in your post above?
Yes if Hinge market share grab would slow down it would be good for Bumble.
If Hinge declines along side Bumble it could obvs. be bad for both.
1 Like
I=5
According to Apptopia, Match Group’s DAU rose 8% YoY and 1.4% QoQ to 62.6 M in Q1 2026 while MAU rose 2.5% YoY to 280.3 M
It estimates Tinder’s churn is around 33.3% versus 41.0% for Hinge and 39.7% for Bumble (Q4 2025).
Assessment
My trust level on Apptopia’s data is low given that it overestimates Match Group’s MAU. According to Match Group, Tinder’s MAU stood at around 47 M in Q3 2024, hence Apptopia’s estimate for the entire company seems exaggerated. Perhaps this data is only good for showing trend in user engagement. However, it says that its Mobile Performance Index (MPI) has largely tracked Bumble’s payers in the past, hence it could be a better metric to track.