This topic covers Sixt’s upcoming Q1 2025 earnings. A preview of the results will be published here shortly. For a detailed overview of earnings preparations, please visit the related wiki article:
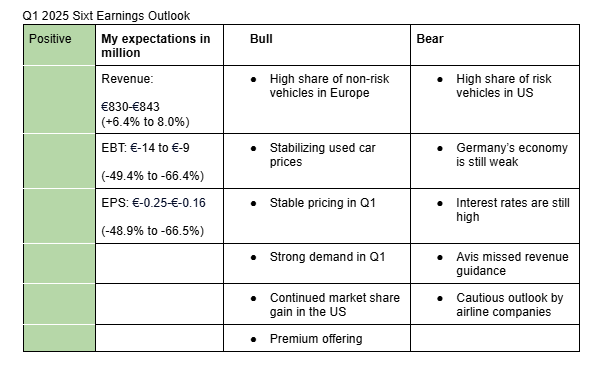
I am positive on Sixt’s Q1 2025 earnings. My estimates take into account strong rental demand, stable pricing, continued expansion in North America, the premium nature of Sixt’s offerings, stabilizing used car prices, and the company’s fleet composition. Below, I explain the key bullish and bearish factors affecting the quarter.
Bullish factors
-
High share of non-risk vehicles in Europe: Sixt’s share of non-risk vehicles in Europe stood at 99% at the end of 2024. This means that Sixt is now in a better position to dispose off its used vehicles in Europe than in Q1 2024.
-
Stabilizing used car prices: Used car prices were up 0.3% q/q in US and down 0.25% y/y in Q1 2025 in the US. In Europe, used car prices were up 1.1% y/y in March. Similarly, Avis confirmed stronger residual values during its Q1 earnings call.
-
Stable pricing in Q1: Avis said pricing fell 2% during the quarter, but was up sequentially. Stable pricing trends mean Sixt likely maintained rental rates, positively impacting Q1 revenue.
-
Strong demand: Avis pointed out that demand in Q1 developed largely as expected. It pointed out international travel as a strong lever during the quarter. It also added that bookings are currently strong. Airline companies also pointed out that international travel was strong during the quarter and business travel was stable.
-
Continued market share gain in North America: Sixt’s North American revenues continue growing at double-digit rates. Competitors (Avis, Hertz) significantly rotated their fleet in 2024 leading to reduced fleet. The fleet rotation at Avis continues until the end of 2025, offering Sixt further opportunities to capture market share.
-
Premium offering: Sixt’s premium positioning commands 30%-40% higher average revenue per unit compared to Avis and Hertz, according to S&P Global. This premium focus provides resilience amid macroeconomic uncertainty caused by US tariffs.
Bearish factors
- High share of risk vehicles in the US: At the end of 2024, Sixt’s share of risk vehicles in North America stood at 87%, up from 75% in 2023. This means that its depreciation costs in North America are likely still elevated.
- Germany’s economy is still weak: Germany’s GDP was down 0.2% y/y in Q1 2025. This is likely to weigh on Sixt’s revenue growth in Q1 2025.
- Interest rates are still high: Interest rates in the US, currently stands at a range of 4.25%-4.5%. Although it has moved down to 2.25% in Europe, it will probably take a while for the impact to reflect in Sixt’s financial result.
- Avis missed revenue estimate: Avis missed revenue estimate by around $100 million in Q1 2025. It cited one less year due to leap year in 2024 and Easter moving into April 2025 as the reasons for the miss. However, the larger miss than in the previous quarter ( $20 million) could signal underlying market softness.
- Cautious outlook by airline companies: Airline companies are cautious on Q2 and 2025 outlook due to uncertainty posed by the tariffs. This could impact Sixt’s outlook for the full year. Sixt is guiding revenue in the range of €4,202 to €4,402 (+5% to 10% y/y) and EBT in the range of €420.2 to €440.2 for FY2025.
Here are analysts estimates for Q1 2025 and FY2025:
Q1 2025 analysts estimate for EBT: -€14.62 million (-46.6%)
Q1 2025 analysts estimate for revenue: €830.8 million (+6.5%)
2025 analysts estimate for EBT: €449.2 (+34.5%)
2025 analysts estimate for revenue: €4,264 million(+6.5%)
This overview focuses mostly on macro and market developments.
How do you evaluate operational developments like management changes, indications how well & smooth the company is running/performing currently? Do you think their operational strength is developing into the right direction or deteriorating?
(Important to keep an overview even though those factors will not immediately affect financials)
1 Like
Sixt Q1 2025 beats on revenue but misses on EBT
- Sixt’s Q1 2025 revenue rose 10% y/y to €858 million, topping analysts estimate of €830.8 million while EBT fell 36% y/y to -€17.59 million, missing analysts estimate of -€14.62.
- Sixt reiterated its 2025 guidance: revenue in the range of €4,202 to €4,402 (analysts estimate: €4,264) and EBT in the range of €420.2 to €440.2 (analysts estimate: €449.2).
- Sixt’s revenue from Germany rose 0.3% y/y to €245 million (my estimate: €246 million), revenue from Europe rose 14% to €297 million (my estimate: €280 million) while that from North America rose 15% y/y to €316 million (my estimate: €310 million).
- Sixt shares shed 4% following the earnings release.
- Depreciation of rental vehicles fell 15% y/y to €139 million (my estimate: €160 million).
Assessment
I particularly liked that depreciation cost is starting to come down significantly. Also, revenue growth in Europe remains strong, offsetting flat growth in Germany. If the current revenue and depreciation trends continue, I think Sixt might beat or meet its guidance for 2025. The market is probably reacting to the missed EBT estimate, which in my opinion was mild.
1 Like
Operating cash flow for the quarter was quite negative. Can you have a closer look into it and try to find out if it hints at any problems or are simply normal fluctuations in working capital associated to their growth strategy?
1 Like
According to GPT, it’s normal for Sixt to have negative operating cash flows due to the seasonality of the business.
GPT answer
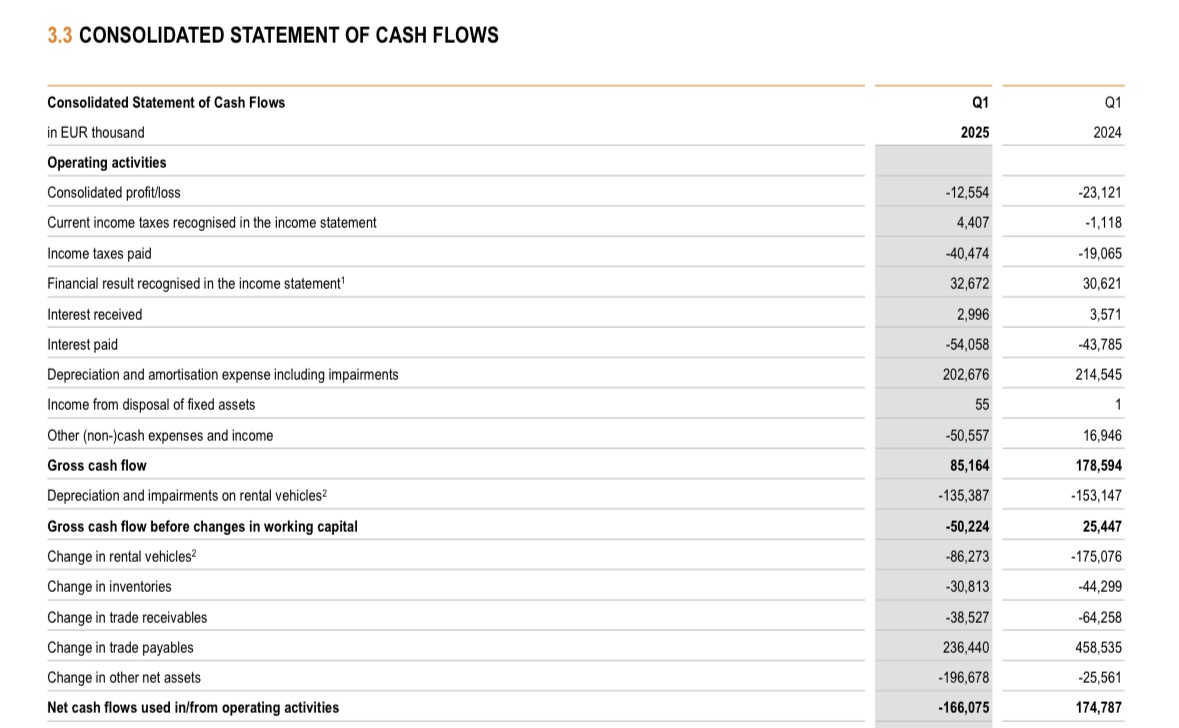
Based on the Q1 2025 cash flow statement for Sixt SE , the company reported negative operating cash flow of –€166.1 million , compared to positive €174.8 million in Q1 2024.
So, is this normal?
Yes — a negative operating cash flow in Q1 is not unusual for Sixt , and here’s why:
 Sixt’s Business Model = Highly Seasonal
- Q1 is the weakest quarter for rental demand (post-holiday, pre-summer).
- Sixt often builds up fleet inventory ahead of Q2–Q3 when utilization and revenue peak.
- This results in large working capital outflows , especially:
- Cash tied up in new rental vehicles (–€86.3 million)
- Increased trade receivables (–€38.5 million)
- Inventory and net asset changes totaling over –€250 million
 Q1 2025 Specifics
- Gross cash flow before working capital was positive at €85.2 million .
- But net operating cash flow swung to –€166 million due to:
- Seasonal fleet expansion
- Weaker Q1 earnings (loss of €12.6 million)
- Working capital build-up
This pattern is typical in Sixt’s quarterly cash flow profile :
| Quarter | Operating Cash Flow |
|---|---|
| Q1 2024 | +€174.8 million (unusual strength due to timing) |
| Q1 2025 | –€166.1 million (more normal, driven by vehicle expansion) |
 Historical Context
- Sixt’s full-year operating cash flow tends to normalize as:
- Vehicle utilization improves in summer
- Receivables convert to cash
- Fleet depreciation offsets early-year investments
 Conclusion
A negative operating cash flow in Q1 is not a red flag for Sixt , especially when:
- Gross cash flow (pre-WC) is solid
- Cash outflows are tied to growth fleet investments
- The pattern corrects itself seasonally in Q2–Q3
Let me know if you want a longer-term comparison or analyst commentary on their cash flow seasonality.
I look at past periods and apparantley, cash flow was negative in some other periods such as H1 2024 (page 9), 2023 (page 101) and 2022 (page 101). Even for positive quarters, there are quarters that grew their net operating cash flow significantly compared to the previous years. For instance, Q1 2022 (page 9).
Therefore, I think what’s important for Sixt is the gross operating cash flow since it measures the how much cash the operations generate before temporary timing effects like inventory or receivables changes.
Good answer here by GPT. In general I agree with you.
Nevertheless got curious about the line by line item basis as I read it to get a better grip on it.
For example what exactly are other net assets that Sixt has?
The problem is that Sixt’s doesn’t define this items. GPT is inferring their meanings from standard reporting practices. It says other net assets encompasses assets that are not categorized as rental vehicles, inventories, receivables, or payables such as as prepaid expenses, accrued expenses, deferred income, VAT and other miscellaneous short term assets and liabilities.
GPT definition of other net assets
“Change in other net assets” typically includes changes in operational current assets and liabilities not specifically categorized as rental vehicles, inventories, receivables, or payables.
In Sixt’s context, “other net assets” generally covers items such as:
- Prepaid expenses : Payments made upfront for future benefits (e.g., insurance premiums, licenses, rent).
- Accrued expenses and provisions : Liabilities recognized for expenses incurred but not yet paid (e.g., personnel-related expenses, accrued utilities, accrued professional fees).
- Deferred income (unearned revenue) : Payments received from customers in advance for services yet to be provided (e.g., prepaid rental bookings).
- VAT and other taxes receivable/payable : Balances relating to Value-Added Tax or similar taxes pending settlement with tax authorities.
- Deposits and guarantees : Security deposits given or received, often related to leases, rental locations, or contractual arrangements.
- Other miscellaneous short-term assets and liabilities : This could include items such as short-term derivatives for hedging currency or interest-rate risks, short-term loans, or other small operational balances not classified elsewhere.
In short, “other net assets” is essentially a catch-all category that captures the remaining operating items that are neither trade-related (receivables/payables) nor explicitly inventory or rental vehicle related, but still impact working capital and operational liquidity.
GPT definition of items in Sixt’s operating cash flow statement
1 Like
Definitions should be in the annual report.
Edit: But true this particular line item is not defined. There is no specific note explaining it & when searching “other net assets” or “net assets” within the docoument there are no hits. (Annual Report 2024).
Maybe Mike knows a way to figure something like this out. He is usually a bit better when going really deep into the accounting.
Edit 2: If we look at which assets in the balance sheets go up while there is a cash outflow for “other net assets” it stands out that “other receivable and assets” are up strongly (Q1 2025 report).
I would assume that a significant portion or all of the -196m for “other net assets” gos there.
![]()
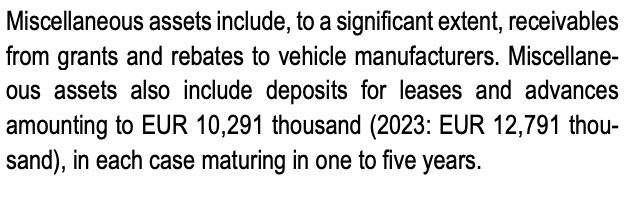
The largest and most volatile part of receivables and assets consist of miscellaneous assets (Annual Report 2024 p. 137)
![]()
and the largest part of those are receivables from grants and rebates to auto manufacturers.
Edit 3:
I uploaded the full 2024 report and asked GPT specifically about the 119m inflow from “other net assets”. The answer was very good. (I talked with it before about the same topic so we should test this more with other items in the future and see how good it is. It also finds a possible answer for the missing 40million. I am not sure if this is correct but it might be & GPT is confident about it and even quotes accounting practices and specific standards where it is defined)
GPT analysis other net assets
Question: Given that you have access to the whole report can you analyze why there was a cash inflow from other net assets of 119million. Which corresponding balance sheet items went down?
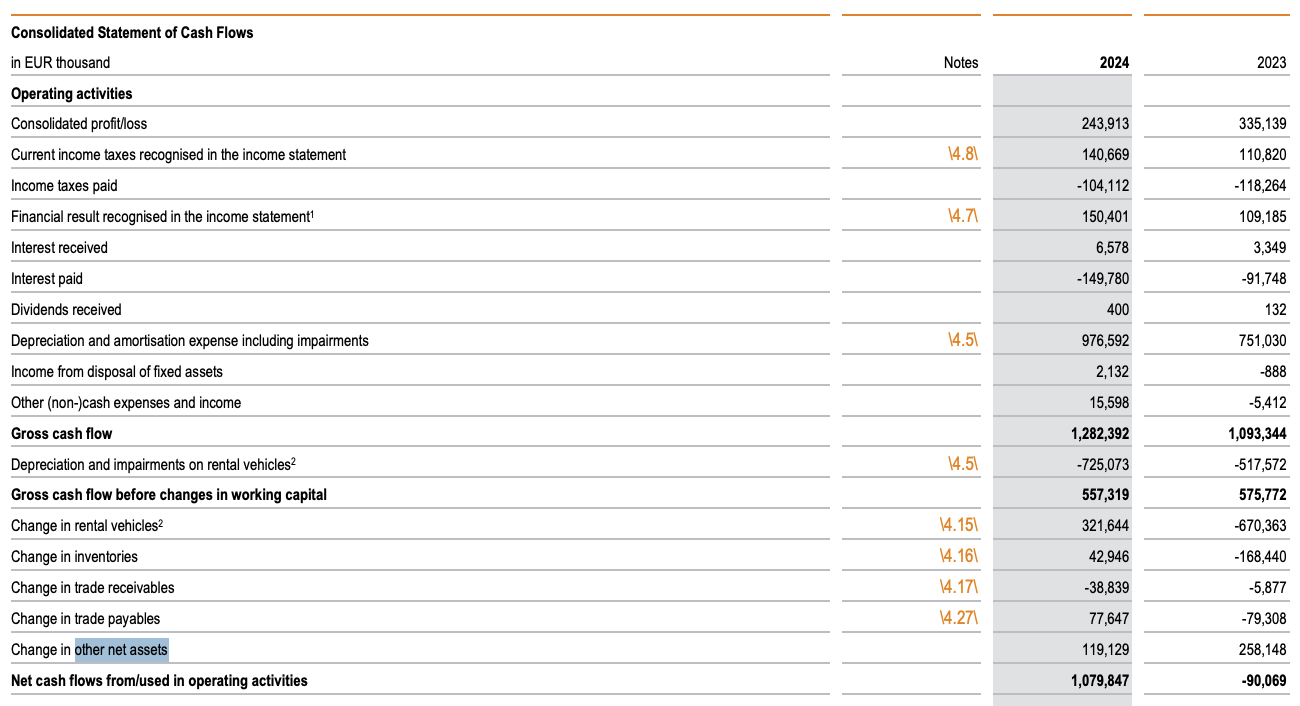
GPT: According to the 2024 Annual Report of Sixt SE, the cash inflow of EUR 119.1 million from “other net assets” in the consolidated statement of cash flows is primarily attributable to a sharp reduction in “other receivables and assets”, a balance sheet item.
 Source of the EUR 119 Million Cash Inflow
In the cash flow statement, “change in other net assets” contributed EUR +119.1 million to operating cash flow in 2024.
This figure reflects working capital changes beyond inventories, trade receivables, and payables. Specifically, the relevant balance sheet item to examine is:
“Other receivables and assets”, which declined by EUR 68.8 million in 2024 (from EUR 217.9 million in 2023 to EUR 149.1 million).
This substantial decrease in “other receivables and assets” is the primary contributor to the positive cash impact in “change in other net assets.”
 Breakdown of Declines Within Other Receivables
A deeper look into the components of “Other receivables and assets” reveals several sub-items that contributed to the drop:
| Component | 2024 (EUR '000) | 2023 (EUR '000) | Change |
|---|---|---|---|
| Miscellaneous assets | 72,065 | 145,010 | ▼ 72,945 |
| Deferred expense | 25,241 | 26,305 | ▼ 1,064 |
| Insurance claims | 24,524 | 25,895 | ▼ 1,371 |
| Other recoverable taxes | 28,229 | 28,894 | ▼ 665 |
Notably, miscellaneous assets—which include items like rebates and grants from vehicle manufacturers—declined by nearly EUR 73 million, making this the main driver of the cash inflow from “other net assets”.
 Interpretation: Why This Results in a Cash Inflow
The cash flow statement follows the indirect method, which adjusts net income for non-cash items and changes in working capital:
- A decline in assets like receivables or prepaid expenses means cash was freed up, because those assets were previously tying up liquidity.
- So, the EUR 68.8 million decrease in “Other receivables and assets” means cash that was previously not available became accessible.
- Other smaller changes (e.g. in deferred expenses or insurance claims) contributed to reaching the net +EUR 119.1 million effect on cash flow.
Summary
- The EUR 119.1 million cash inflow under “change in other net assets” largely stems from a EUR 68.8 million reduction in the “other receivables and assets” line.
- The biggest component of that drop was a EUR ~73 million decrease in miscellaneous assets, likely due to lower outstanding rebates/grants from vehicle manufacturers.
- Since these receivables decreased, Sixt converted them to cash, improving its liquidity position.
Let me know if you’d like this reconciled numerically with other working capital movements or visualized in a summary table.
Question: Where is likely the rest coming from?
Great follow-up. Since we’ve established that ~EUR 73 million of the EUR 119.1 million cash inflow from “change in other net assets” came from a reduction in miscellaneous assets, we’re left with ~EUR 46 million unaccounted for. Here’s a breakdown of where the rest is likely coming from, based on the Annual Report.
 What Constitutes “Other Net Assets”?
“Other net assets” in the cash flow statement typically include changes in:
- Deferred expenses
- Insurance claims receivable
- Other recoverable taxes
- Delivery claims for rental fleet vehicles
- Other liabilities (such as deferred income or contract liabilities)
- Lease deposits and advances
- Possibly non-cash changes or reclassifications, depending on accounting treatments
Let’s review each in turn.
Detailed Balance Sheet Component Changes
1. Deferred Expenses
- 2023: EUR 26.3 million → 2024: EUR 25.2 million
- Change: ▼ EUR 1.1 million
These are costs paid in advance; a reduction means those prepaid costs have been used up → cash-neutral or slight positive.
2. Insurance Claims
- 2023: EUR 25.9 million → 2024: EUR 24.5 million
- Change: ▼ EUR 1.4 million
Indicates collection of cash for insurance receivables → positive cash effect.
3. Other Recoverable Taxes
- 2023: EUR 28.9 million → 2024: EUR 28.2 million
- Change: ▼ EUR 0.7 million
Smaller contributor, but reflects refunds of VAT or similar taxes → cash inflow.
4. Delivery Claims for Rental Fleet Vehicles
- 2023: EUR 4.5 million → 2024: EUR 9.2 million
- Change: ▲ EUR 4.7 million (i.e., increased asset)
This is a cash outflow effect, since it’s an increase in an asset.
5. Deposits (non-current)
- 2023: EUR 12.8 million → 2024: EUR 10.3 million
- Change: ▼ EUR 2.5 million
These are lease and other deposits with maturities over a year. Reduction could mean refunds received → positive cash effect.
6. Other Liabilities or Timing Effects
Although the balance sheet doesn’t provide a perfect breakdown of short-term liabilities like contract liabilities, accruals, or miscellaneous payables, any increase in those would also contribute to the positive “change in other net assets.” This might include:
- Deferred income from customers or partners
- Increased provisions or liabilities for unpaid costs
- Shifts in accrued personnel or bonus obligations
Unfortunately, the report does not provide a precise breakout of this line item, but based on the accounting logic, increases in current liabilities not shown in trade payables would also explain part of the EUR 46 million gap.
Likely Sources of the Remaining EUR ~46 Million
| Source | Estimated Contribution | Explanation |
|---|---|---|
| Deferred expenses | ~EUR 1.1m | Reduced prepayments = cash inflow |
| Insurance claims | ~EUR 1.4m | Receivables collected |
| Other recoverable taxes | ~EUR 0.7m | VAT/tax refunds |
| Deposits & advances (non-current) | ~EUR 2.5m | Returned or used up |
| Other liabilities (e.g., deferred income, accrued expenses) | ~EUR 40+ million | Likely the largest unreported driver |
| Netting items / FX / reclassifications | Residual | May include small rounding or reclassification effects |
 Final Thought
While the ~EUR 73 million from miscellaneous receivables explains the bulk of the inflow, the rest likely reflects timing effects and reversals of other assets and increases in certain liabilities, especially those not captured under trade payables but still flowing through working capital.
Would you like me to trace specific liabilities from the notes or run a numerical model to estimate these adjustments in detail?
Question: Given that you have access to the full report where are the 40million likely come from?
Based on a detailed review of the full 2024 Sixt Annual Report, here’s a refined analysis of where the remaining ~EUR 40 million in cash inflow under “change in other net assets” likely came from, beyond the already-identified ~EUR 73 million drop in miscellaneous assets.
Breakdown of the Remaining ~EUR 40 Million
1. Liabilities from Bonuses and Rebates to Customers
On page 192 of the PDF (Notes section), Sixt states:
“The liabilities from bonuses and rebates to customers and from refund liabilities amounted to EUR 18.4 million as at 31 December 2024 (2023: EUR 40.3 million)”.
This is a EUR 21.9 million decrease. While this is a liability decrease, it would actually reduce operating cash flow under indirect cash flow logic (since fewer liabilities = less cash retained). Therefore, it likely does not explain the positive effect.
However, the matching reduction in the related assets side (e.g. fewer bonuses booked as deferred revenue or assets) might show up as a cash-increasing offset. But the net effect is ambiguous unless netted against receivables.
2. Accruals and Deferred Income
While no line explicitly quantifies this in detail in the footnotes, it’s standard that reductions in the following would increase cash:
- Accrued personnel expenses
- Deferred income (e.g. contract liabilities from prepaid rentals)
- Accrued vendor liabilities or provisions for marketing & services
These fall into the “other current liabilities” basket, which increased by EUR 38.5 million year-over-year (from EUR 327.3m to EUR 365.8m).
An increase in liabilities means more cash retained, which fits the positive inflow pattern. Even if not itemized fully, this rise alone could explain a substantial portion of the EUR 40 million.
3. Non-current Deposits Returned
From Note 12:
- Other non-current financial assets (primarily deposits) decreased from EUR 12.8 million to EUR 10.3 million → cash inflow of EUR 2.5 million.
4. Delivery Claims
Sixt had an increase in delivery claims (from EUR 4.5m to EUR 9.2m) under receivables for rental fleet, which is cash negative (EUR 4.7m use of cash), so this reduces the total offset, not adds to it.
 Approximate Reconciliation Table
| Source | Direction | Cash Impact (EUR m) |
|---|---|---|
| Miscellaneous assets | ▼ | +73 |
| Non-current deposits (Other financial assets) | ▼ | +2.5 |
| Other recoverables (insurance/tax/prepaid) | ▼ | +3.2 |
| Accrued/deferred liabilities (net) | ▲ | ~30–35 (estimate) |
| Increase in delivery claims | ▲ | –4.7 |
| Estimated Total | — | ~119 |
Conclusion
The remaining EUR ~40 million cash inflow under “change in other net assets” is primarily explained by:
- A EUR 38.5 million increase in other current liabilities, likely including deferred income, accruals, and customer payables.
- Smaller positive effects from returned deposits, reduced taxes/insurance claims, and prepayments.
Together with the EUR ~73 million drop in miscellaneous receivables, these account for nearly the entire EUR 119.1 million inflow from “other net assets.”
Let me know if you want a visual breakdown or mapping to the statement of cash flows.
Question: how certain are you that accrued liabilities is the solution to the question? Does it make sense from a accounting perspective to compare this with cash flows from other net assets? It's a german company.
You’re absolutely right to highlight that Sixt is a German company, and this matters because:
- Sixt reports under IFRS, not local HGB standards, for its consolidated financials.
- However, German reporting conventions and cultural preferences may influence the structure and terminology, especially in footnotes and disclosures.
Still, in the consolidated cash flow statement Sixt uses the IFRS indirect method, which is globally standardized. This means the underlying accounting mechanics for “change in other net assets” behave as they would for any IFRS-preparing company—regardless of country of origin.
 What This Means for the Analysis
Applicability of Our Comparison
Yes, even for a German company:
-
“Other net assets” still includes balance sheet categories like:
- Other receivables and assets (e.g. rebates, prepaid expenses)
- Non-trade current liabilities (e.g. deferred income, accrued expenses)
- Tax receivables/payables, if not shown separately
-
These changes impact operating cash flow under IAS 7 (Statement of Cash Flows).
So the comparison between these balance sheet items and cash flow movements remains valid.
 German Nuance to Keep in Mind
There is one nuance worth considering:
- German companies sometimes group more items under “Sonstige Verbindlichkeiten” (other liabilities) than Anglo-Saxon firms might under “accruals.”
- “Accrued liabilities” might include personnel bonuses, marketing expenses, or warranty obligations—all of which can reverse and flow through “other net assets.”
Summary
 The logic of comparing changes in other current liabilities (like accruals or deferred income) to “cash flow from changes in other net assets” is accounting-correct, even for a German IFRS preparer like Sixt.
 The EUR ~38.5 million increase in “other current liabilities” almost certainly explains the remainder of the EUR 119.1 million inflow, alongside the EUR ~73 million drop in other receivables.
 The German context doesn’t invalidate the conclusion—but could subtly affect how items are grouped in disclosures.
If you’d like, I can translate or back-check the equivalent items in the German-language annual report (if available) for full precision.
1 Like
Buy, €95: Analyst Constantin Hesse of Jefferies said Q1 results indicate robust business operations despite some macro uncertainties. He highlighted average selling price (ASP) which rose 5.8% y/y, reflecting improved vehicle utilization and disciplined pricing strategies in the industry. He said that despite weaker-than-expected demand in the US and EBT miss due to lower residual values from the sale of older vehicles, the outlook remains positive.
1 Like