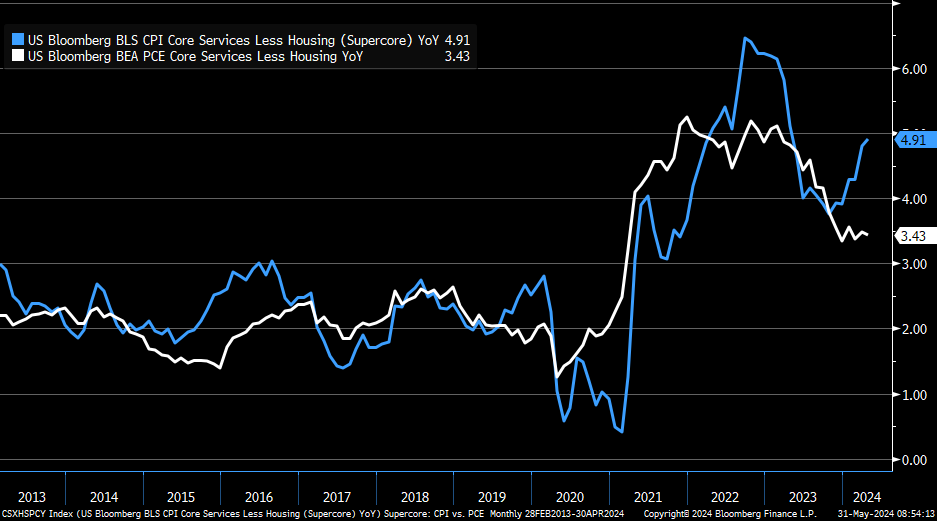
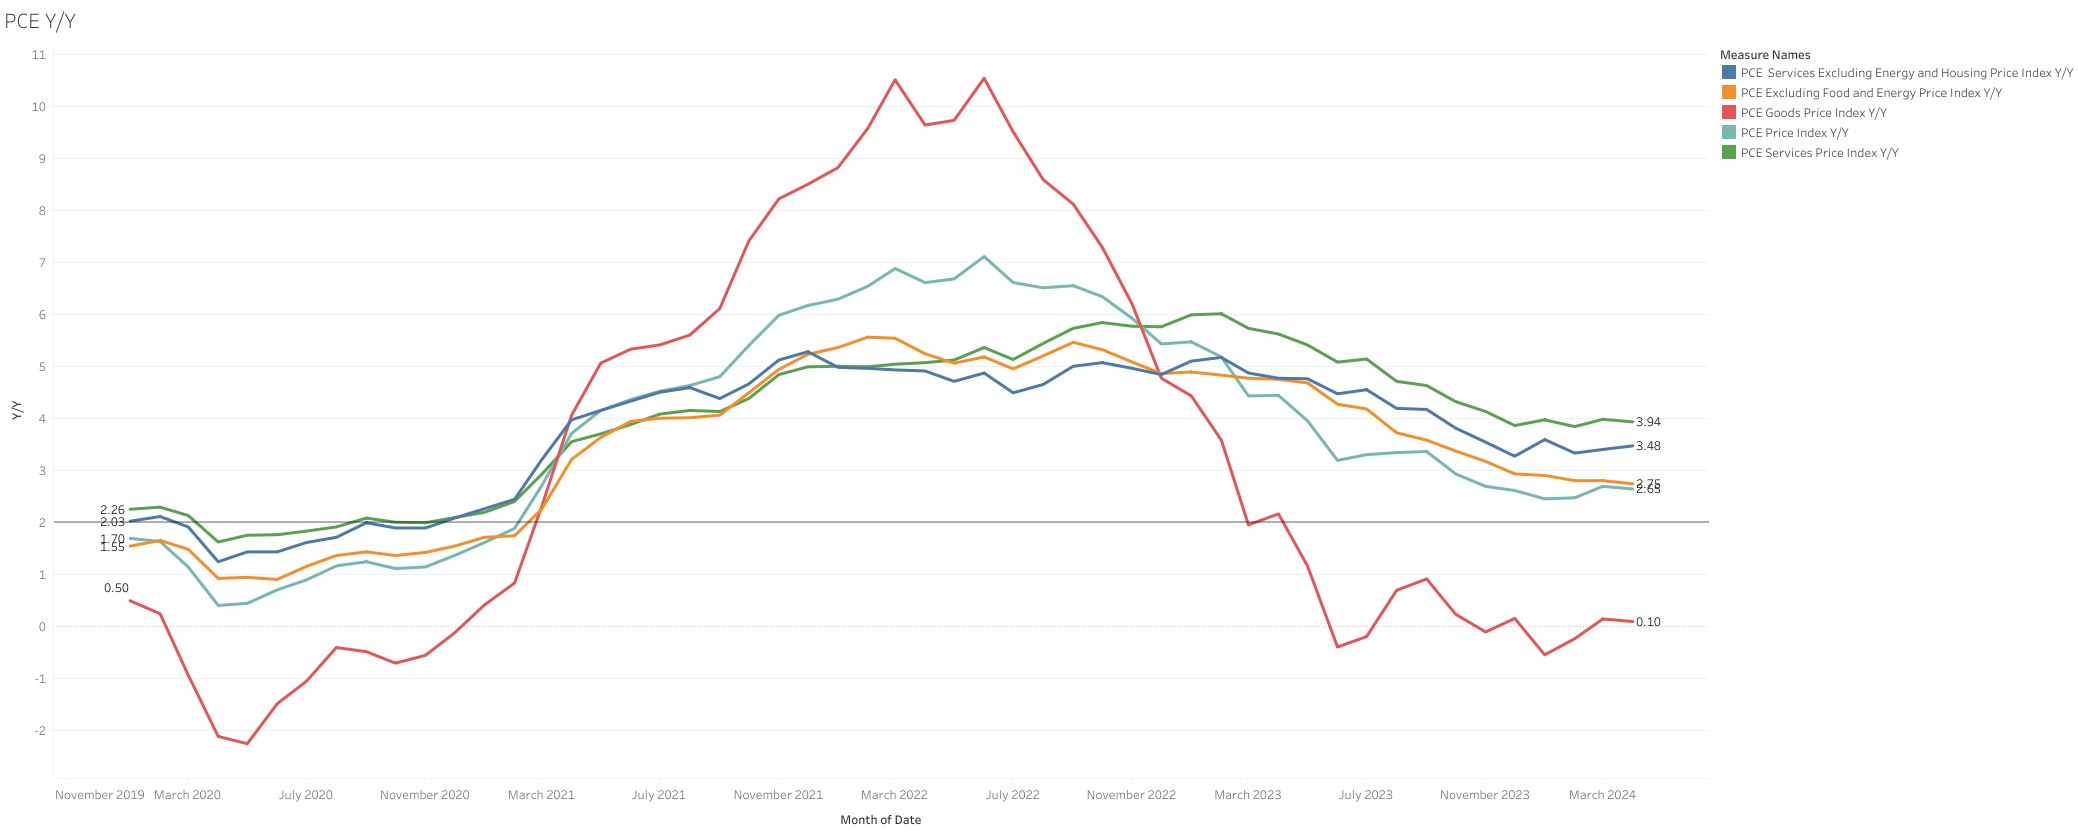
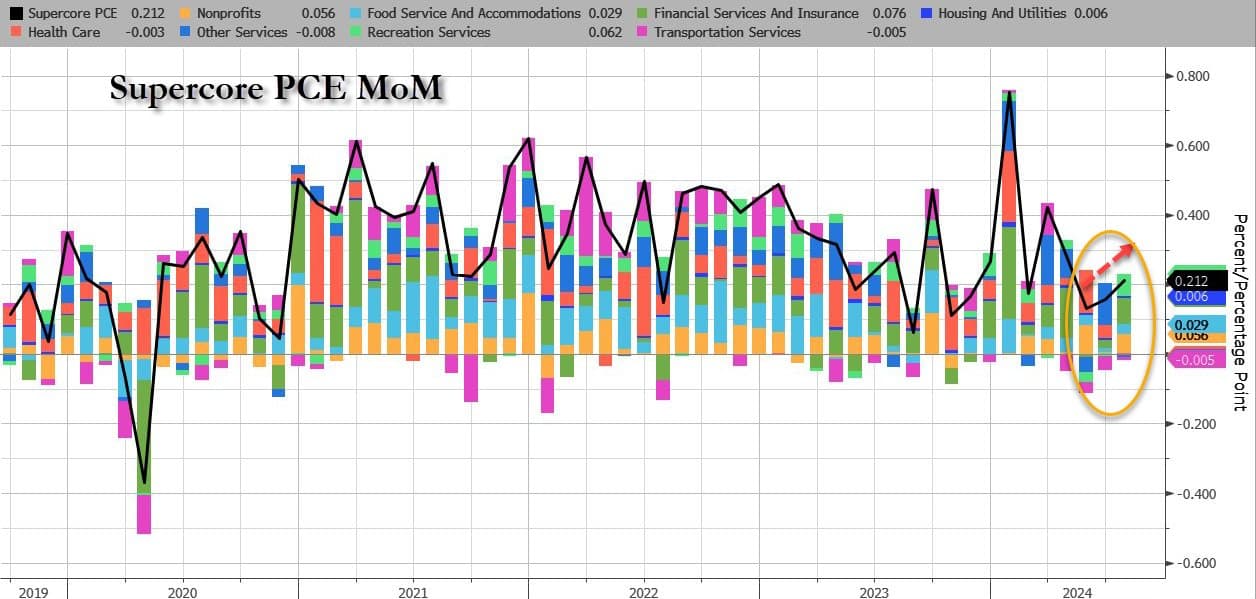
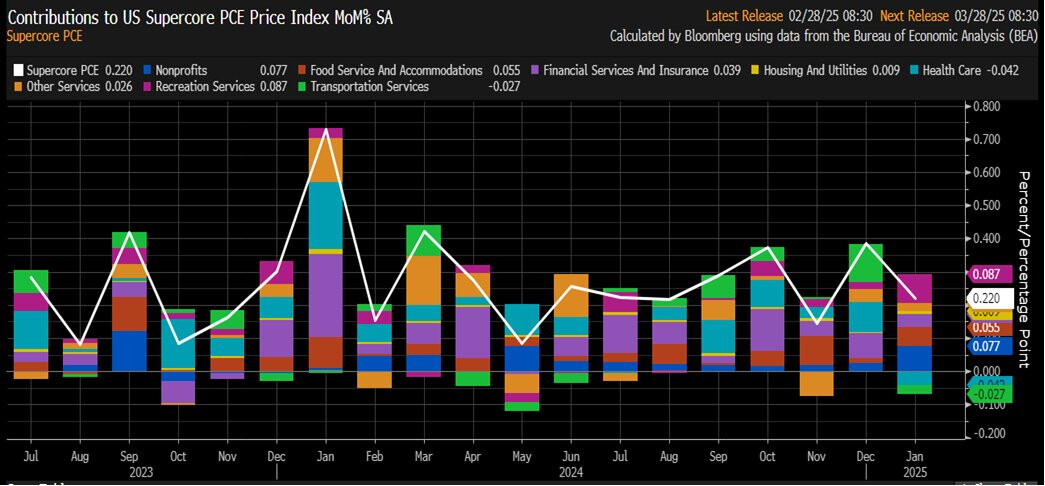
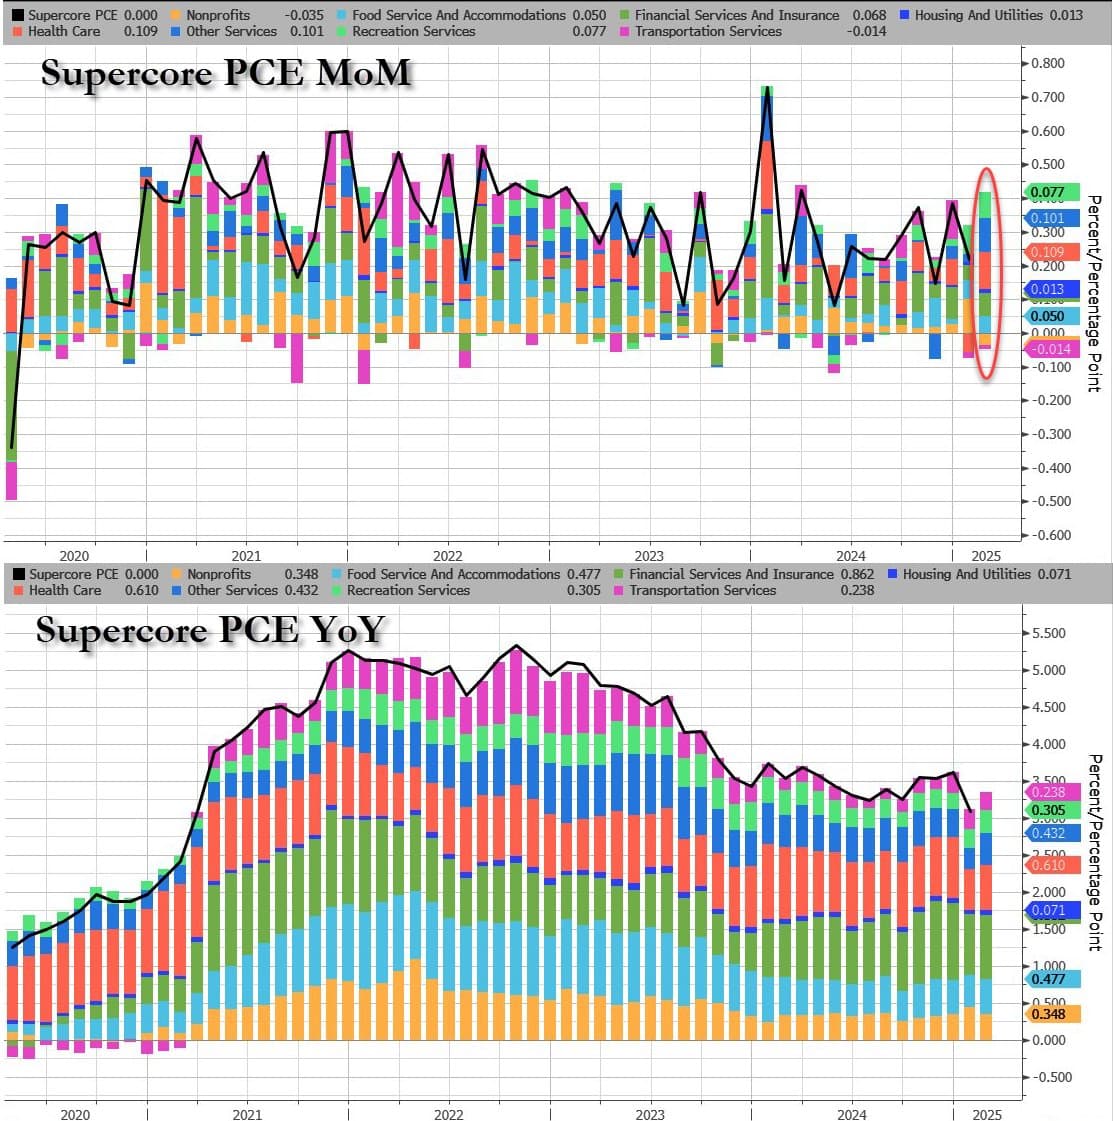
Super core for both CPI and PCE are currently not behaving in the same way. But both are still high.
As a reminder FED inflation measure is PCE, but I don’t think they can ignore completely CPI either.
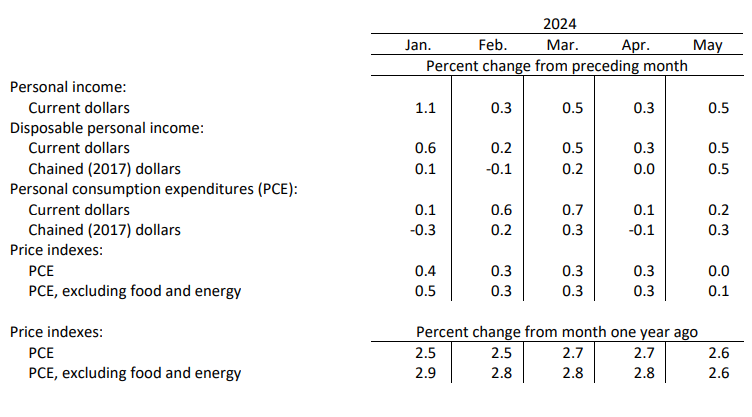
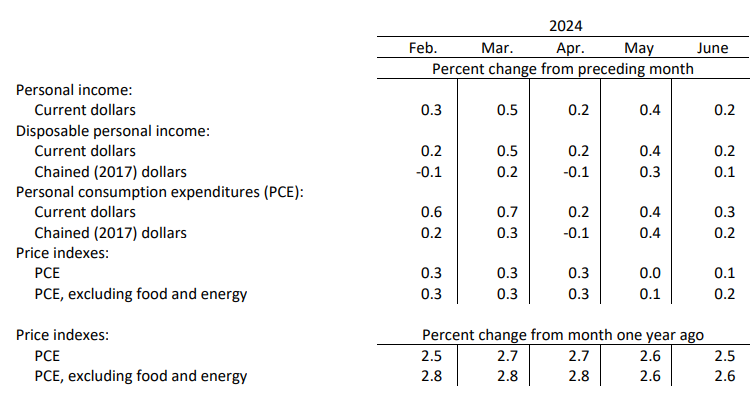
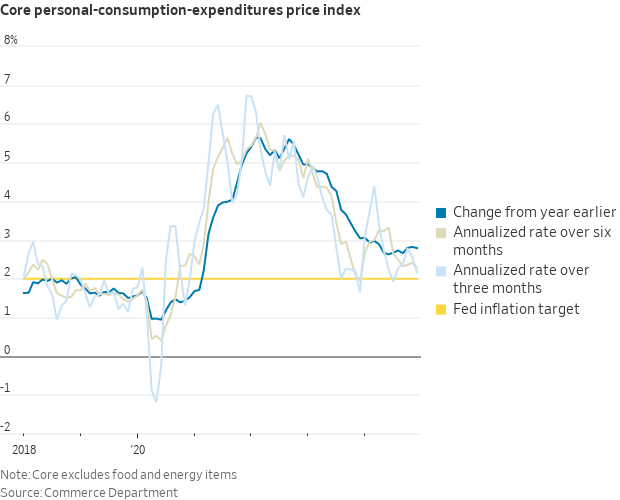
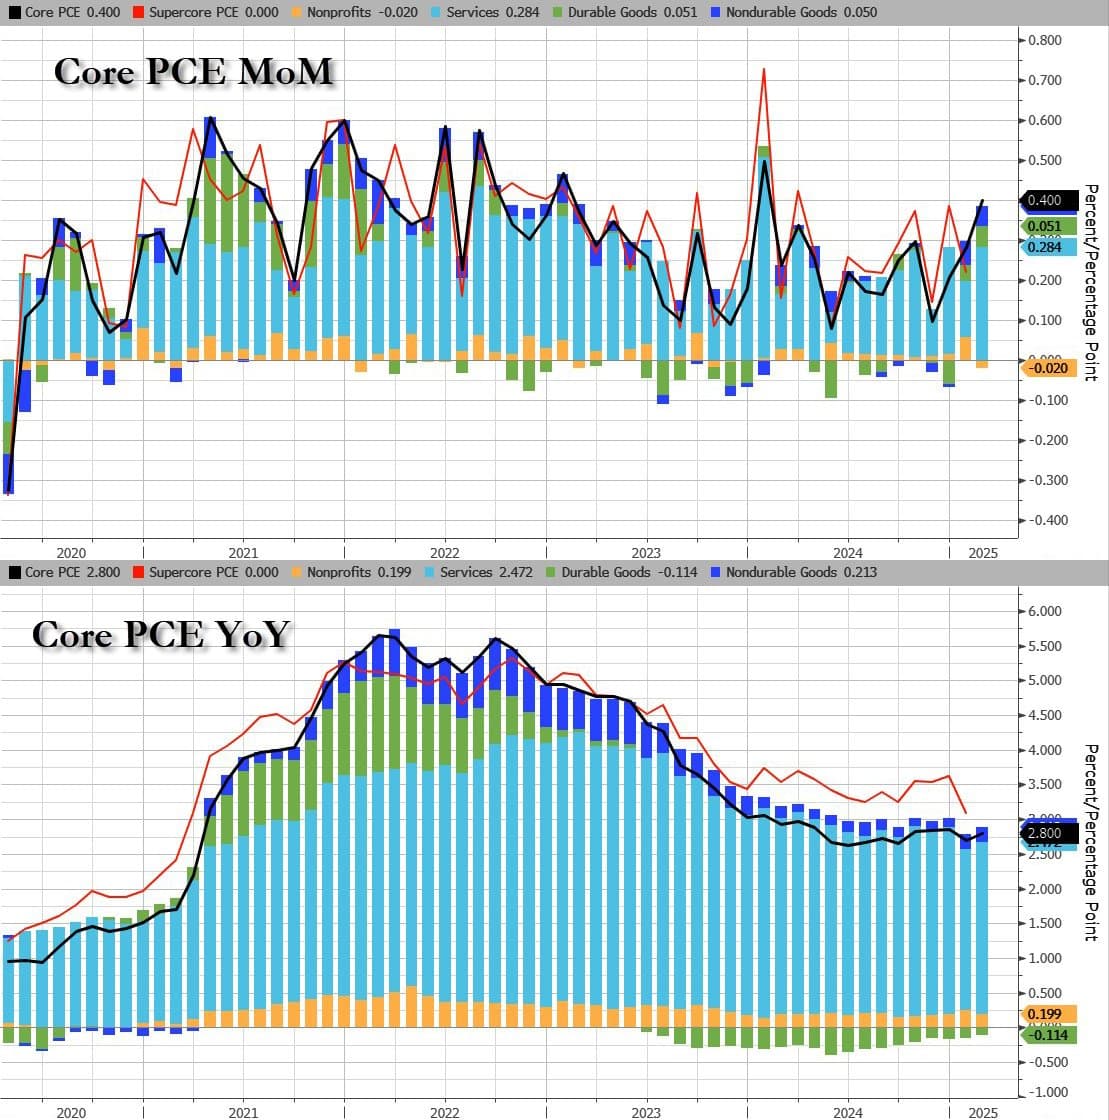
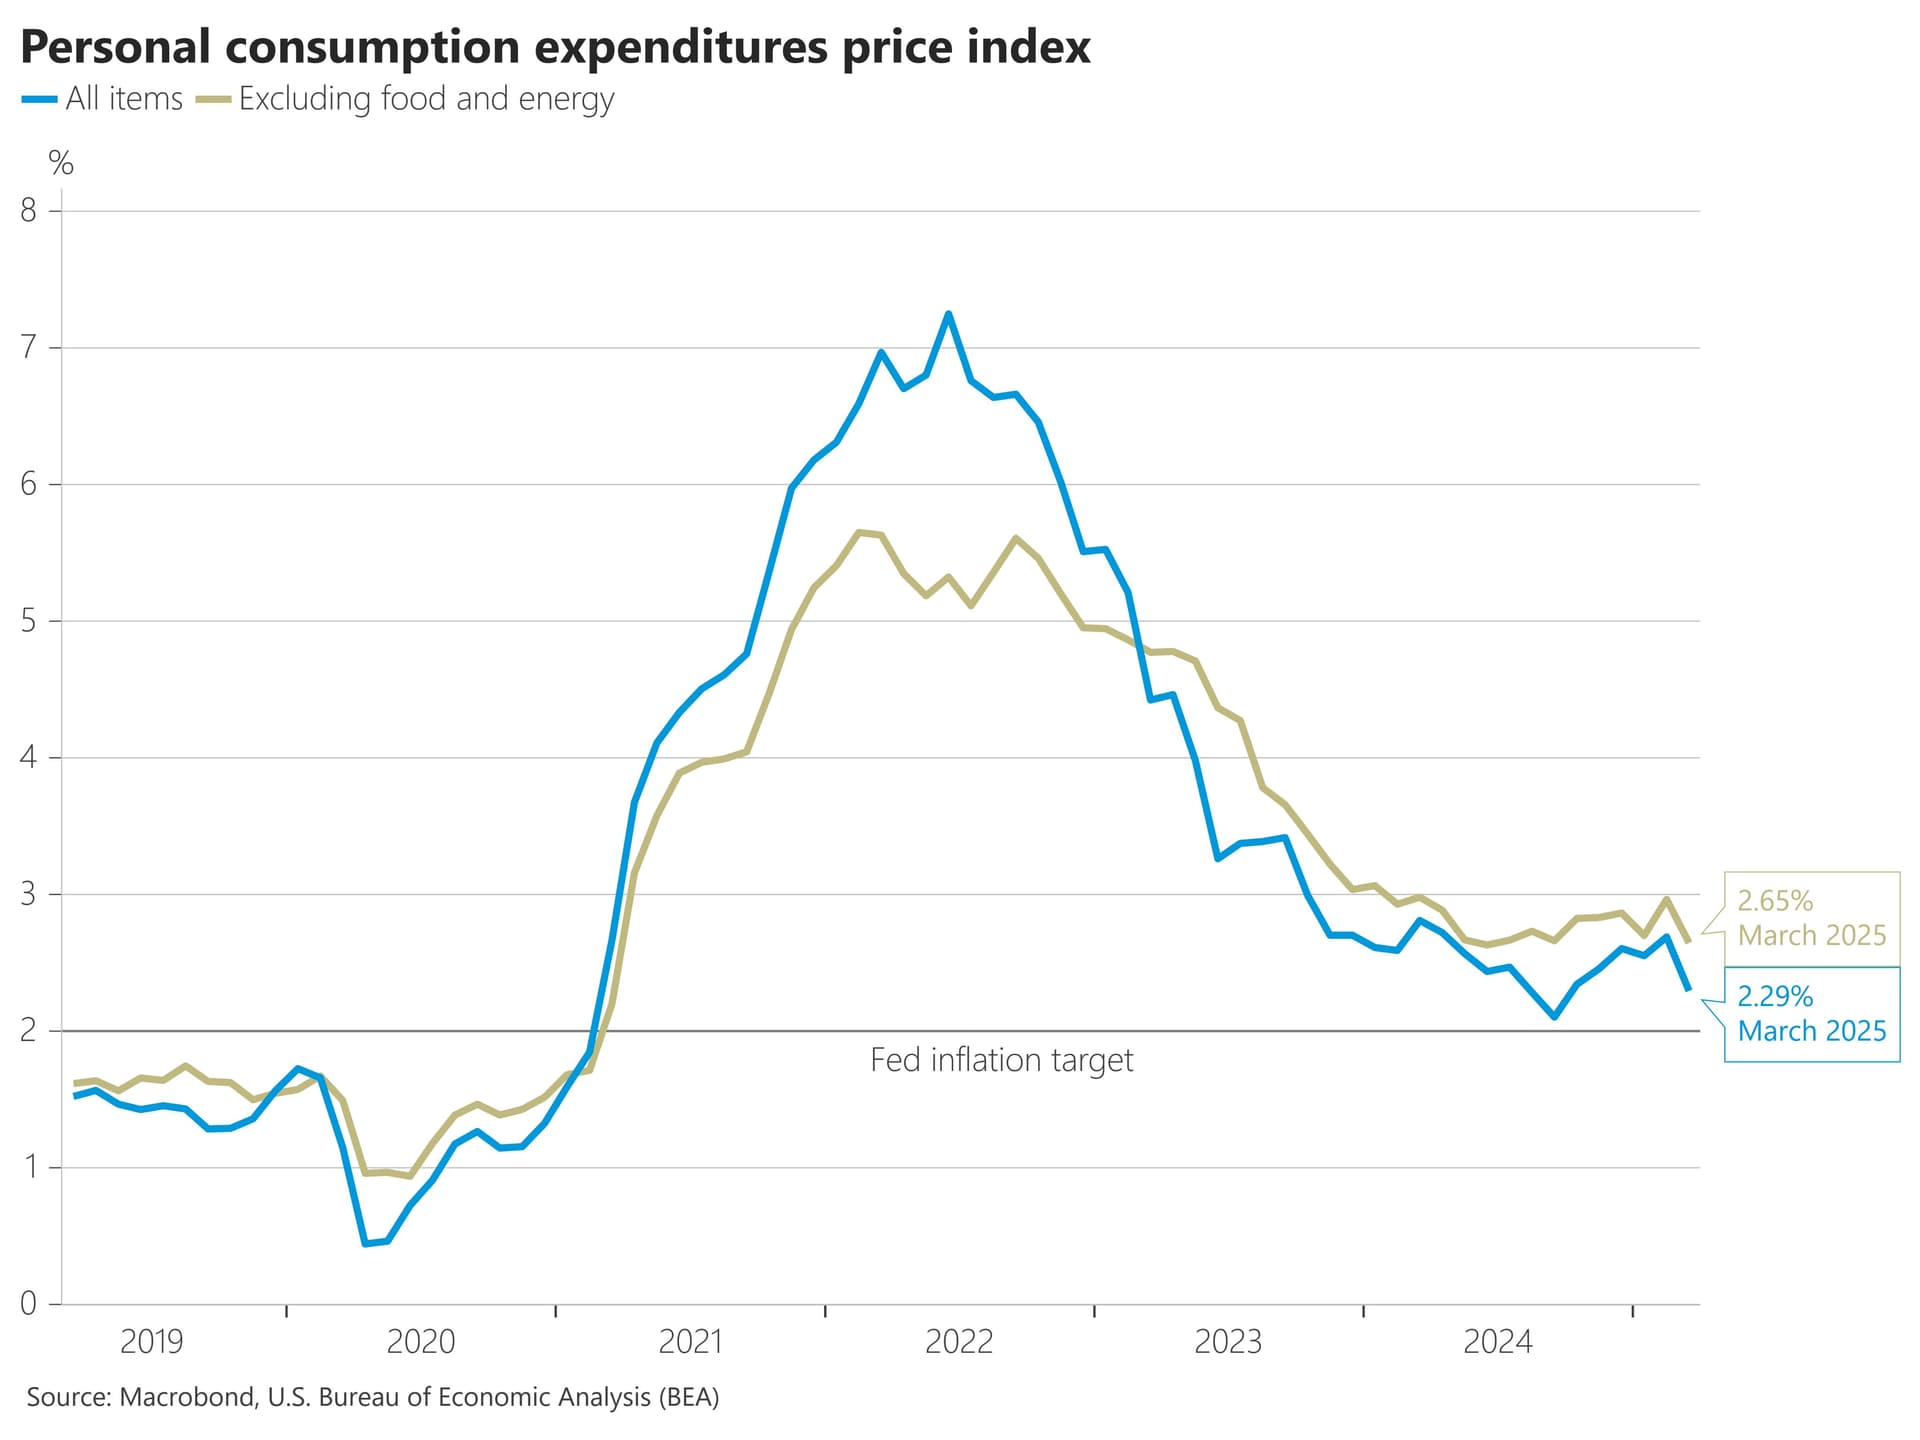
Fed’s key inflation gauge, the personal consumption expenditures price index rose 0.1% in June and 2.5% from a year ago, both in-line with the estimates.
Core PCE increased by 0.2% in June and 2.6% from a year ago, the monthly figure was in-line with expectations while the yearly figure was above 2.5% estimate.
Personal income rose 0.2%, below 0.4% estimate while personal spending met expectations at 0.3%.
I=6 Fed’s key inflation gauge met expectations in October
Fed’s key inflation gauge, the personal consumption expenditures price index rose 0.2% in October, in line with expectations and unchanged from September.
On a yearly basis, PCE rose 2.3%, also in line with estimates but above 2.1% increase in September.
Core PCE increased 0.3% on the month, in line with estimates and unchanged from the previous month.
On a yearly basis, core PCE was up 2.8%, in line with the estimate but up from 2.7% in September.
I=6 PCE inflation up 2.4% in November, less than expected
Fed’s key inflation gauge, the personal consumption expenditures price index rose 0.1% in November, less than 0.2% forecast and an increase of 0.3% in October.
On a yearly basis, PCE rose 2.4%, less than 2.5% forecast but above 2.3% recorded in October.
Core PCE increased 0.1% in November, below 0.2% forecast and 0.3% gain in the previous month.
On a yearly basis, core PCE was unchanged at 2.8%, less than 2.9% forecast.
January Headline and Core PCE Price Index came in line with expectations
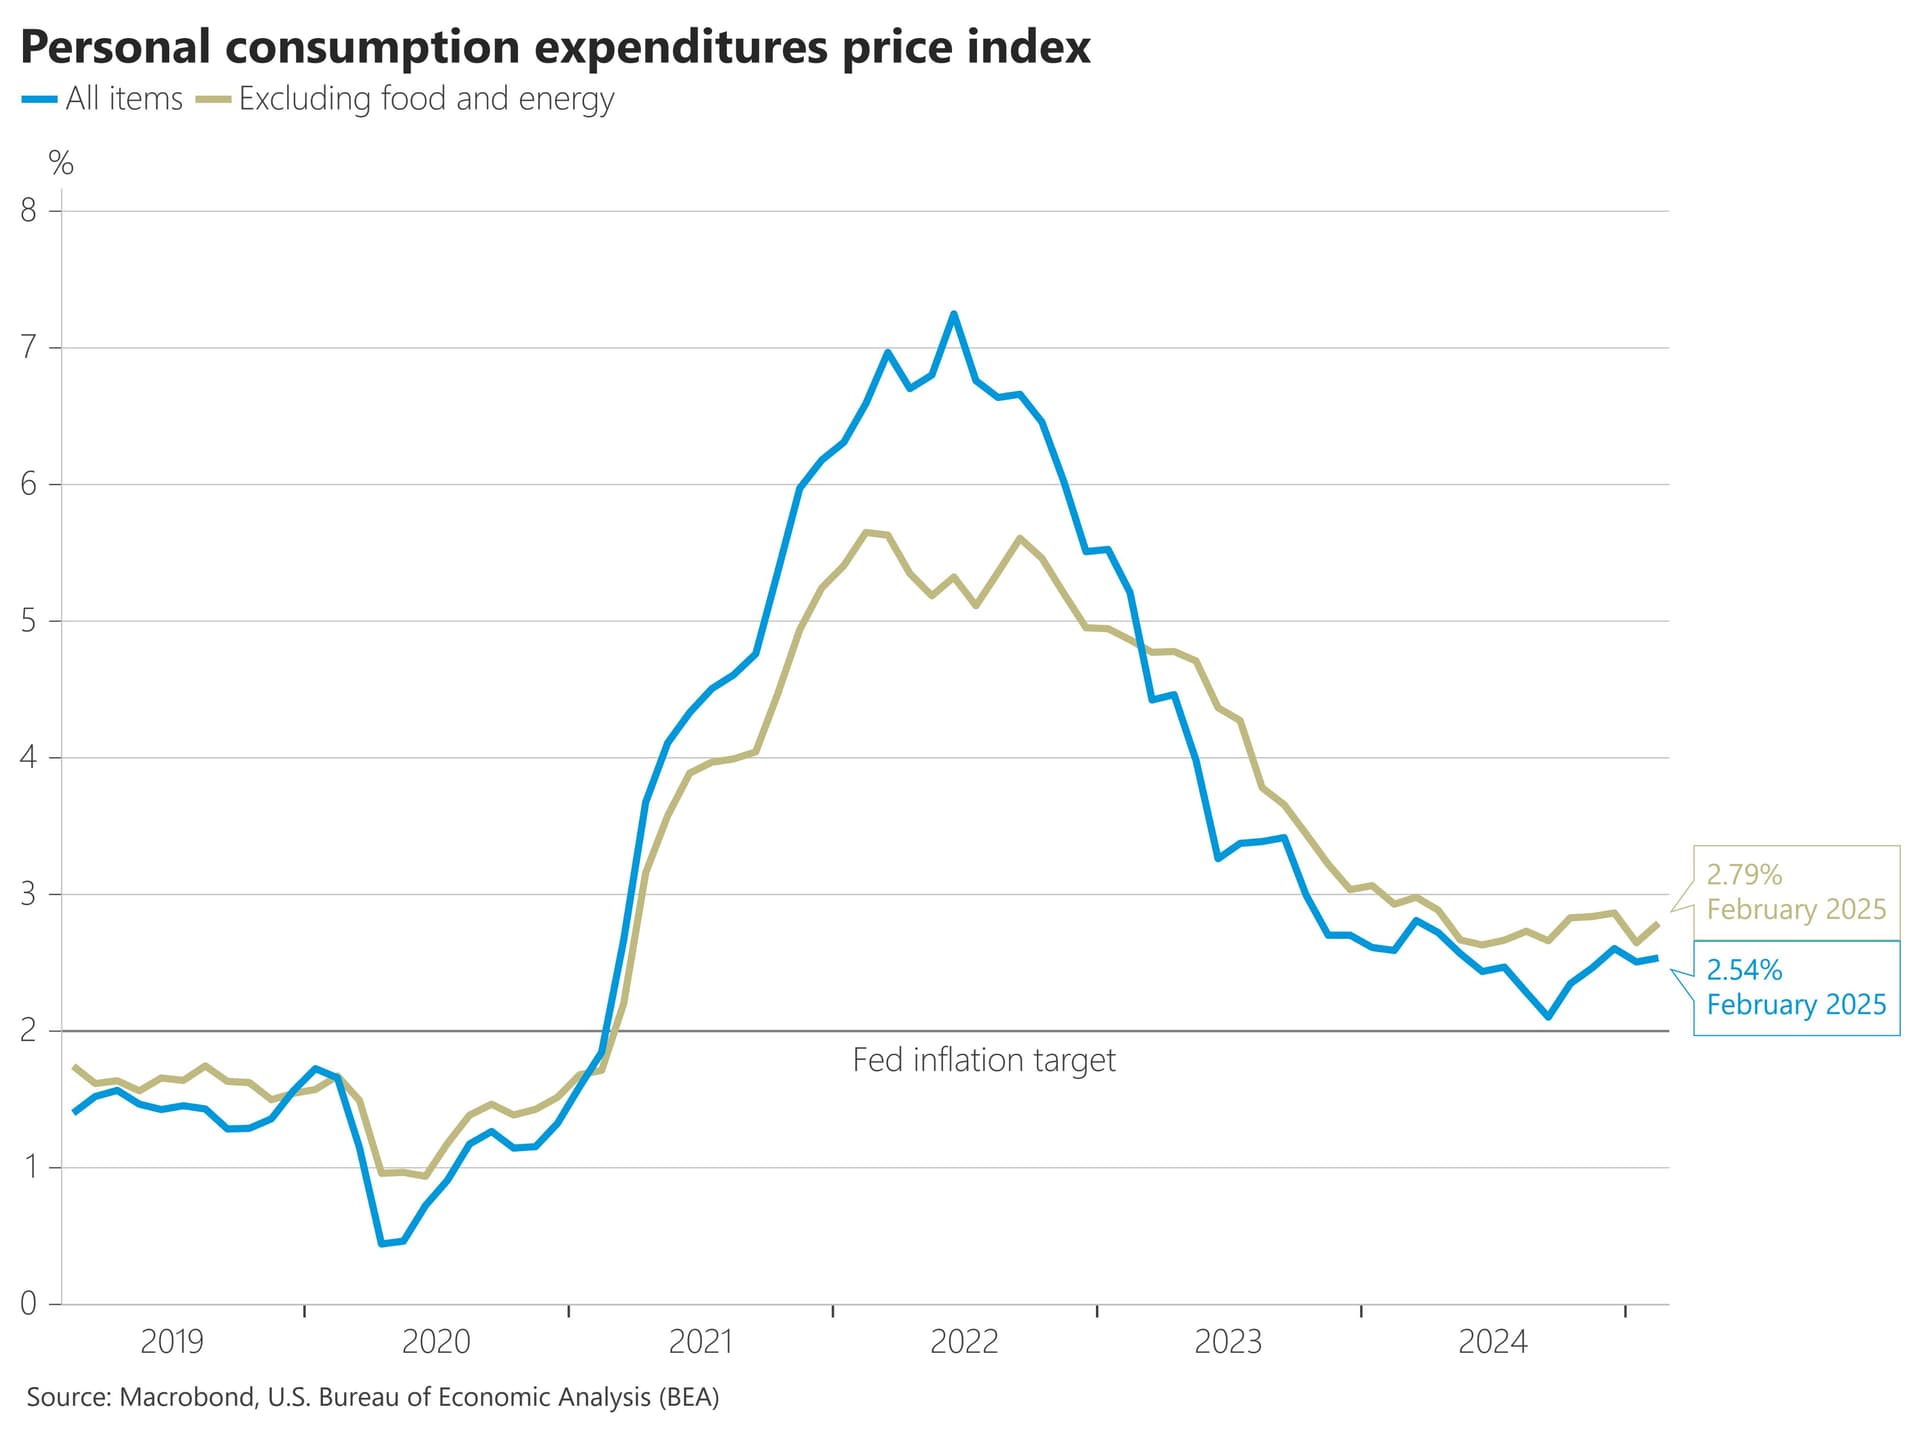
This is the FED-preferred inflation measure. This morning’s PCE report provided a reassuring contrast to the hotter CPI data, suggesting the Fed can still see progress in the disinflation trend.
PCE and CPI behaved differently because they are constructed differently and have different weights
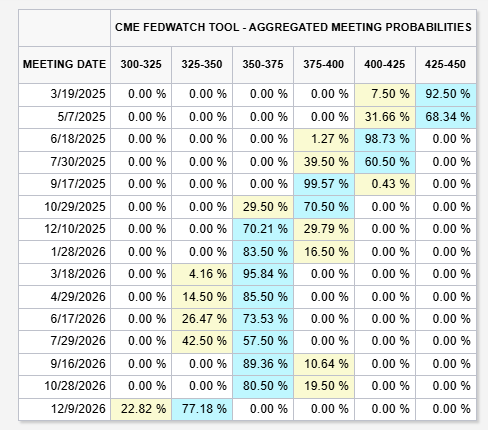
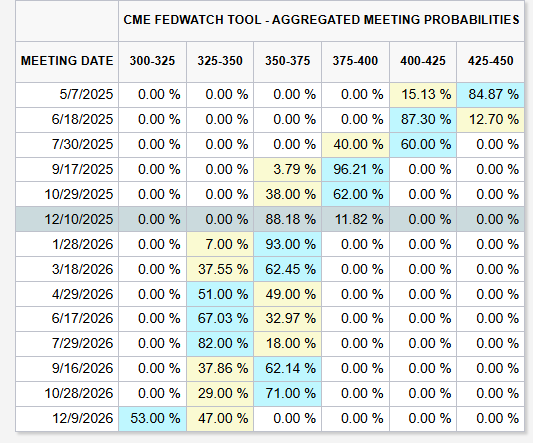
Markets starting to be more optimistic again on the possibility of rate cuts
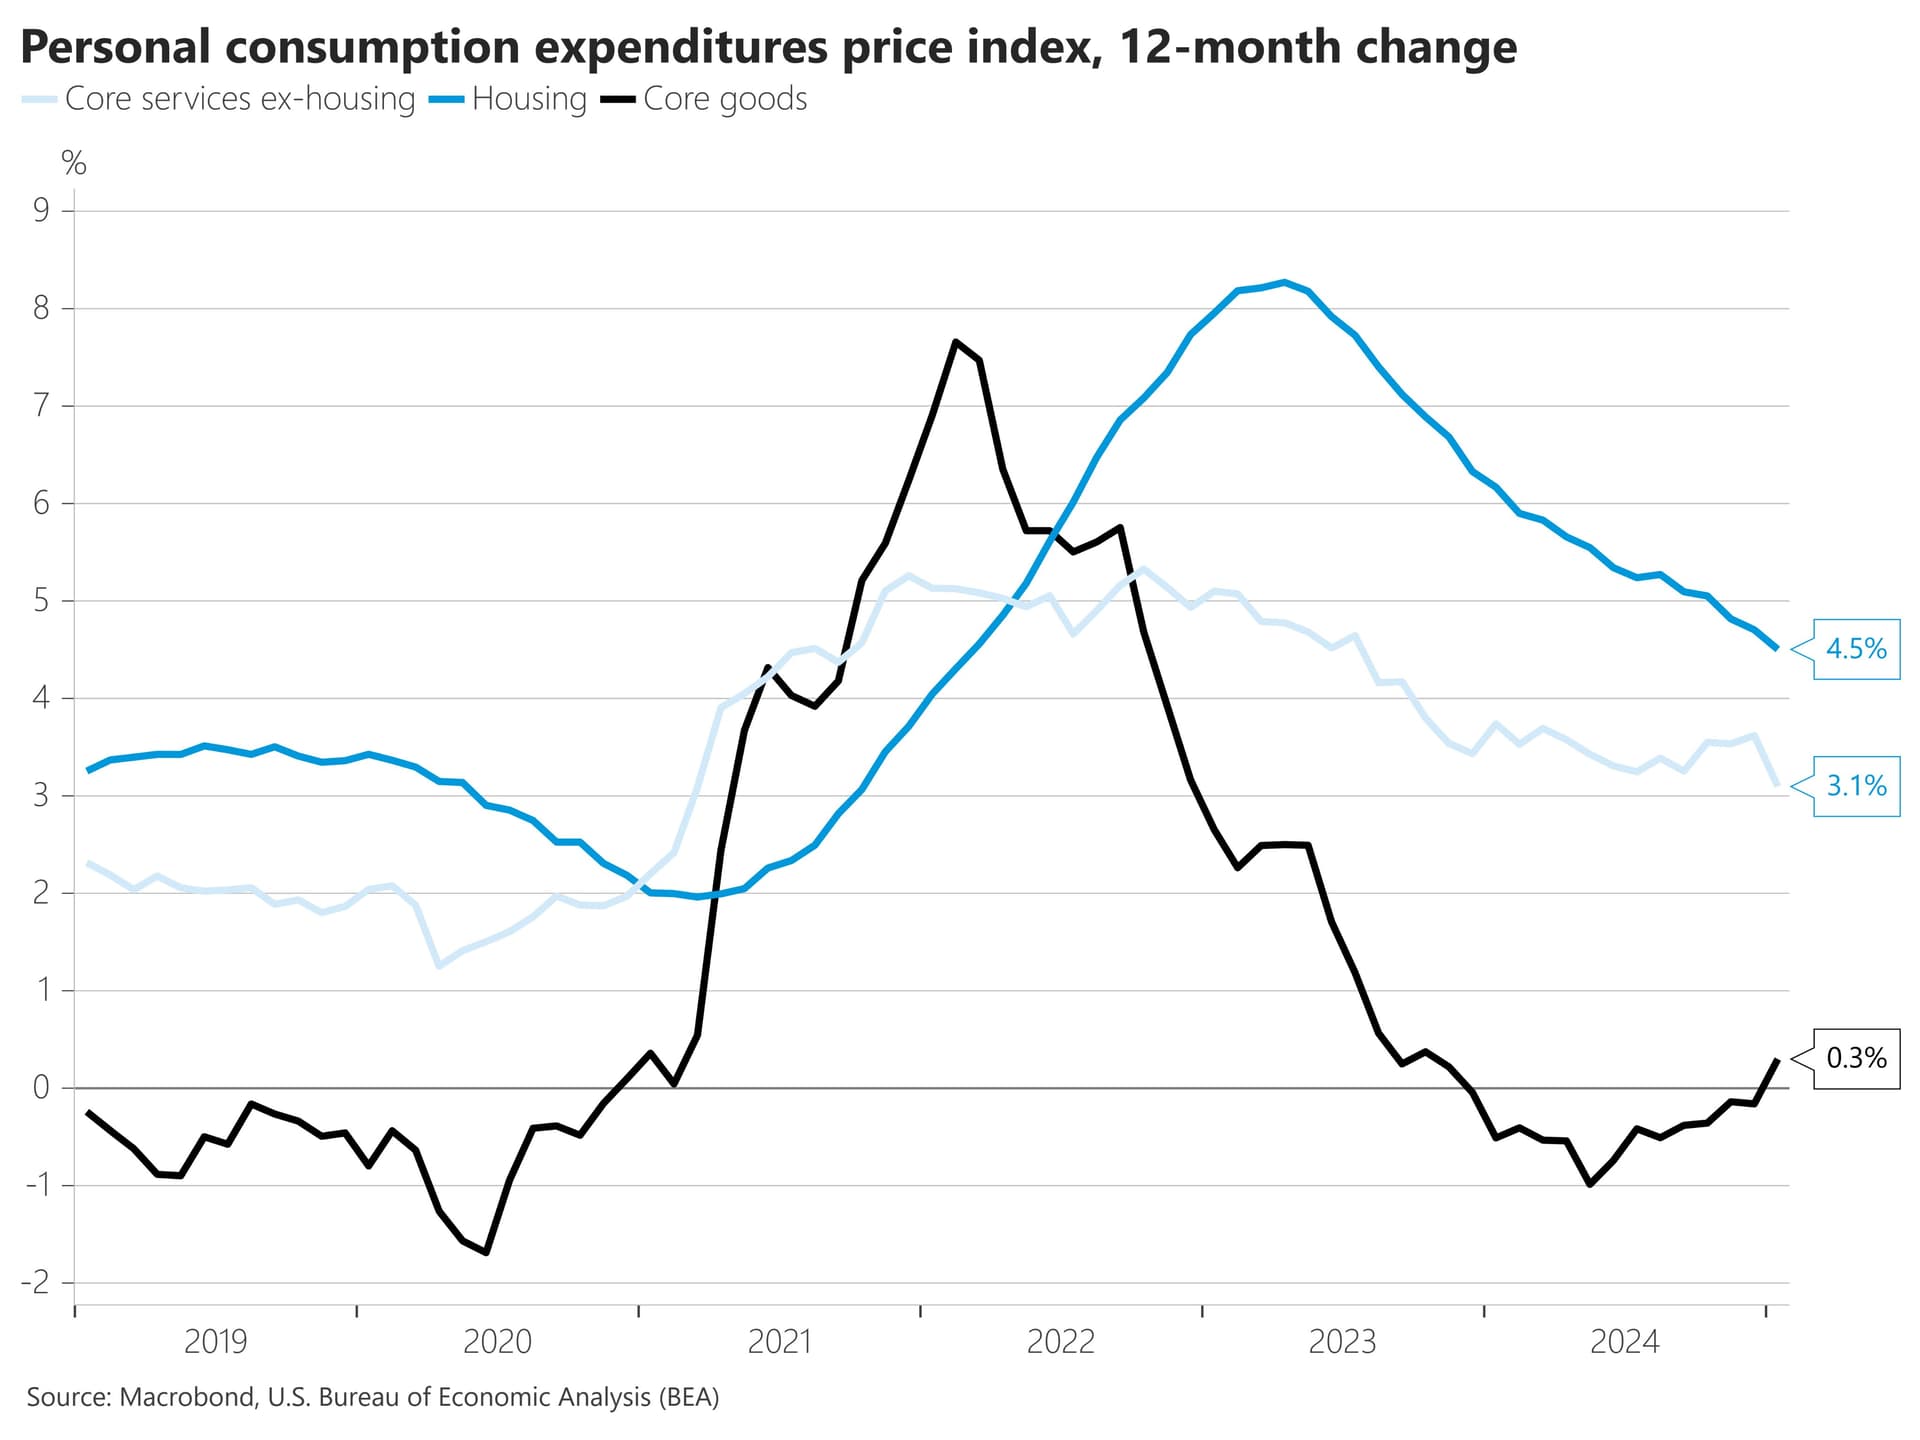
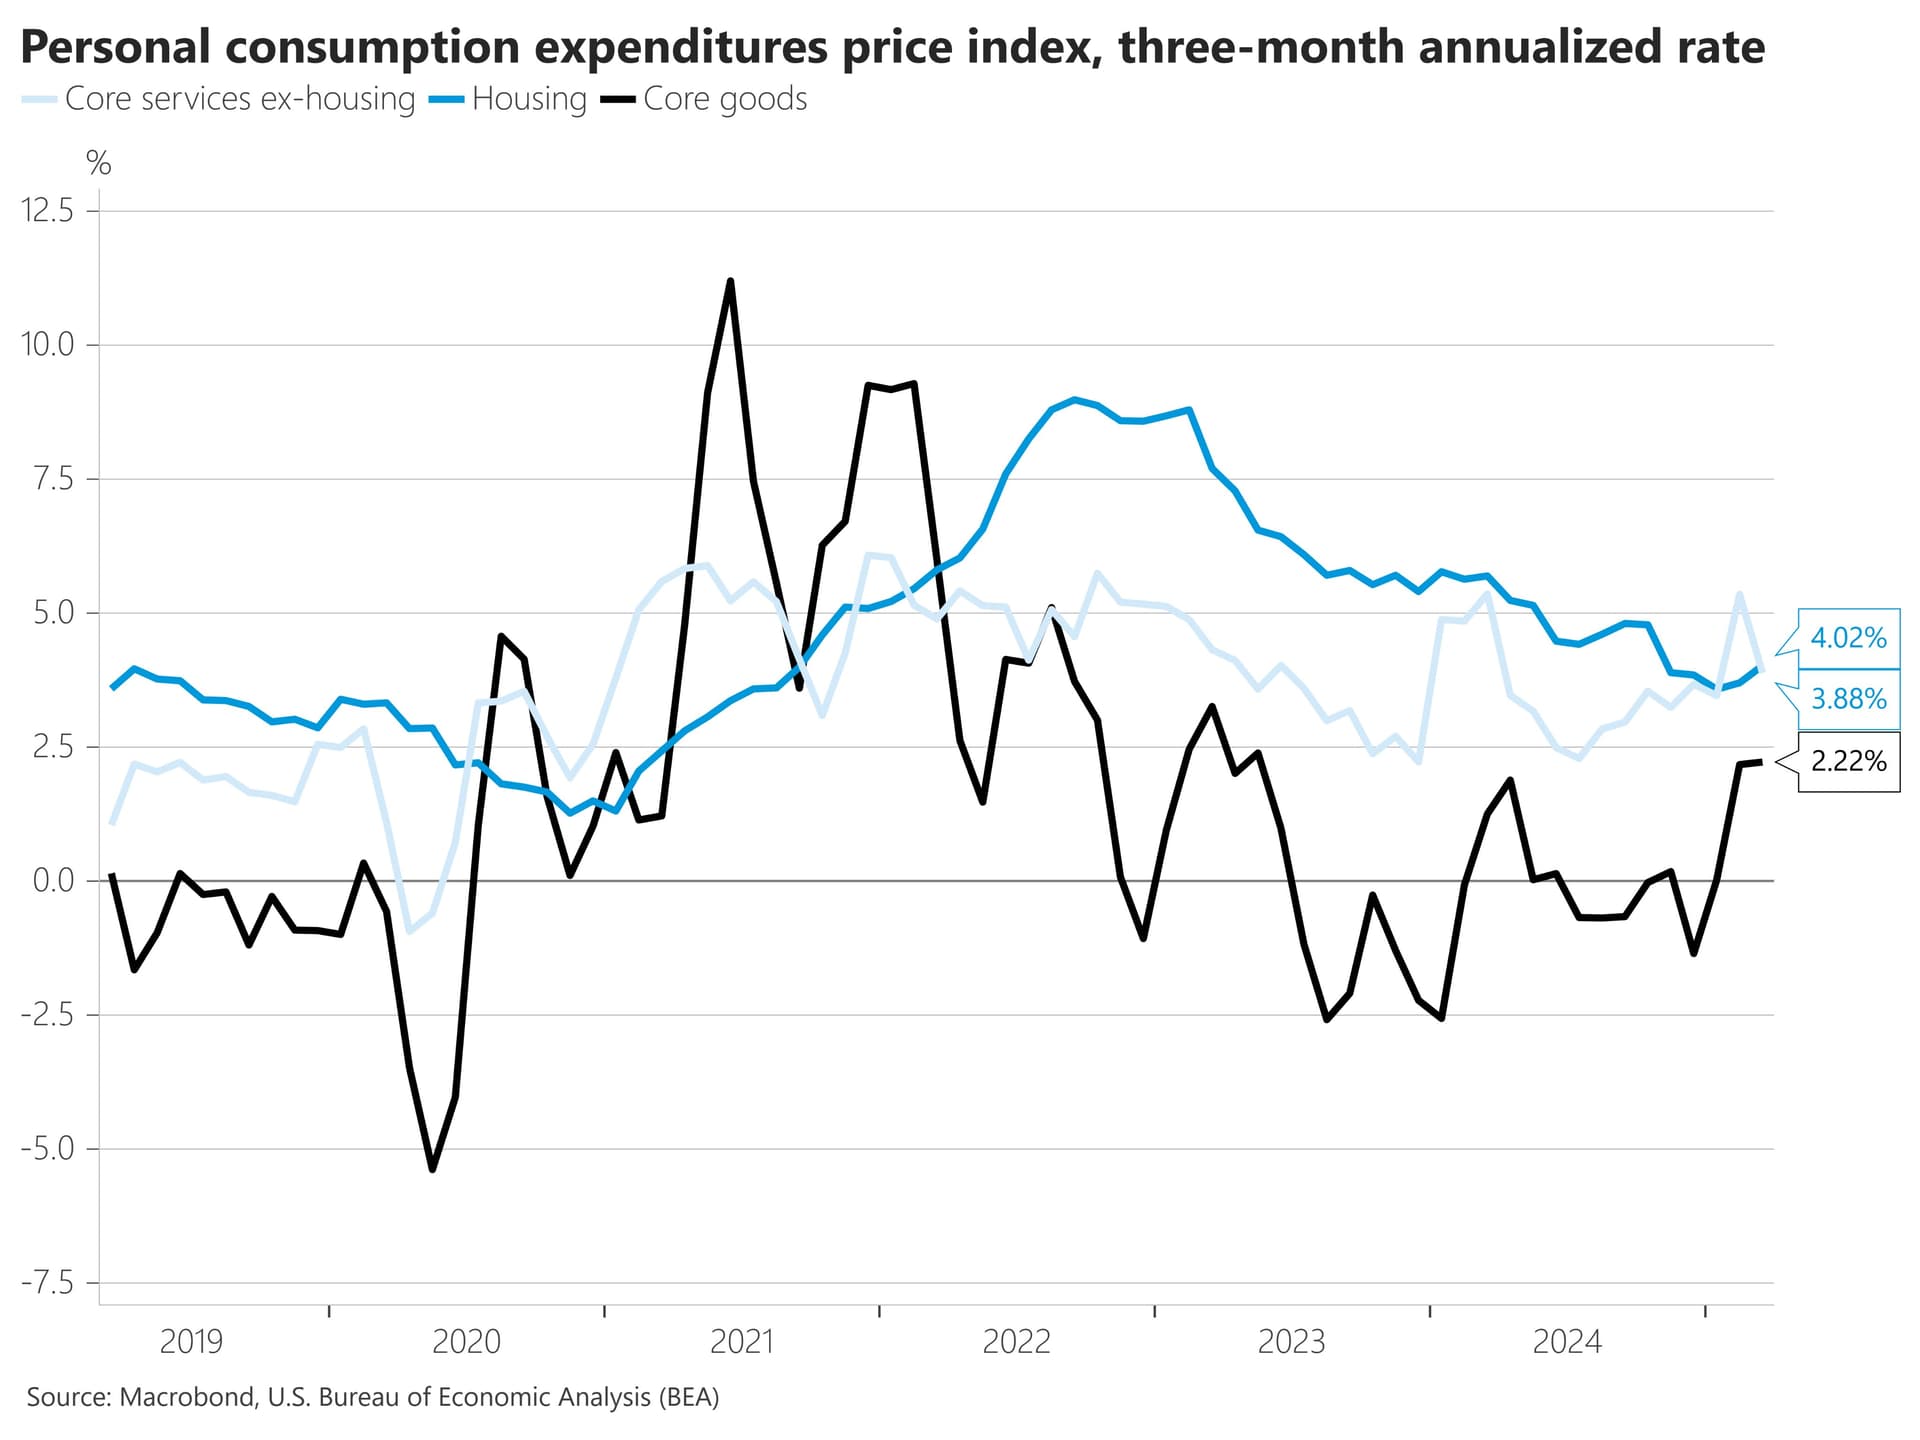
Diving into the components of core inflation, core goods was firm, printing at +0.41% in January. Core goods prices had been deflating but are now moving back up.
Core services ex-housing was mild, at +0.22% in January.
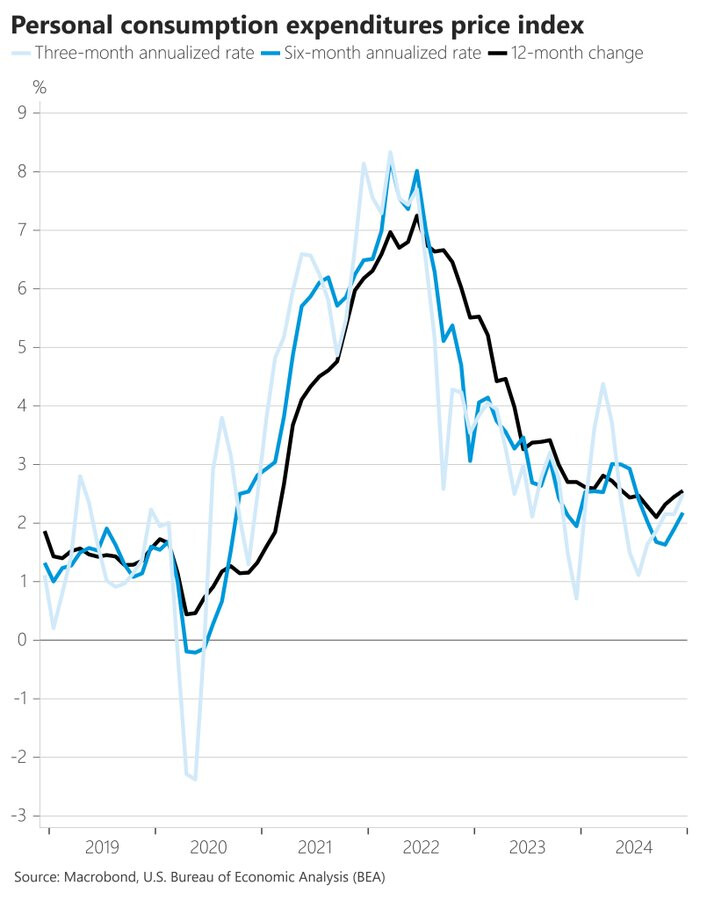
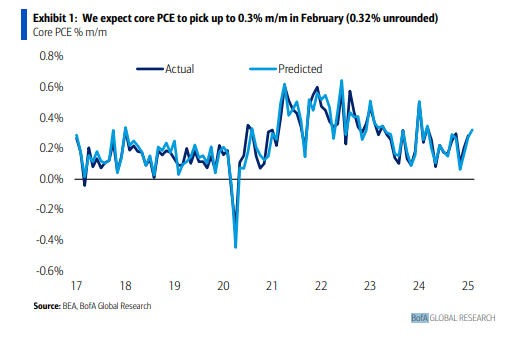
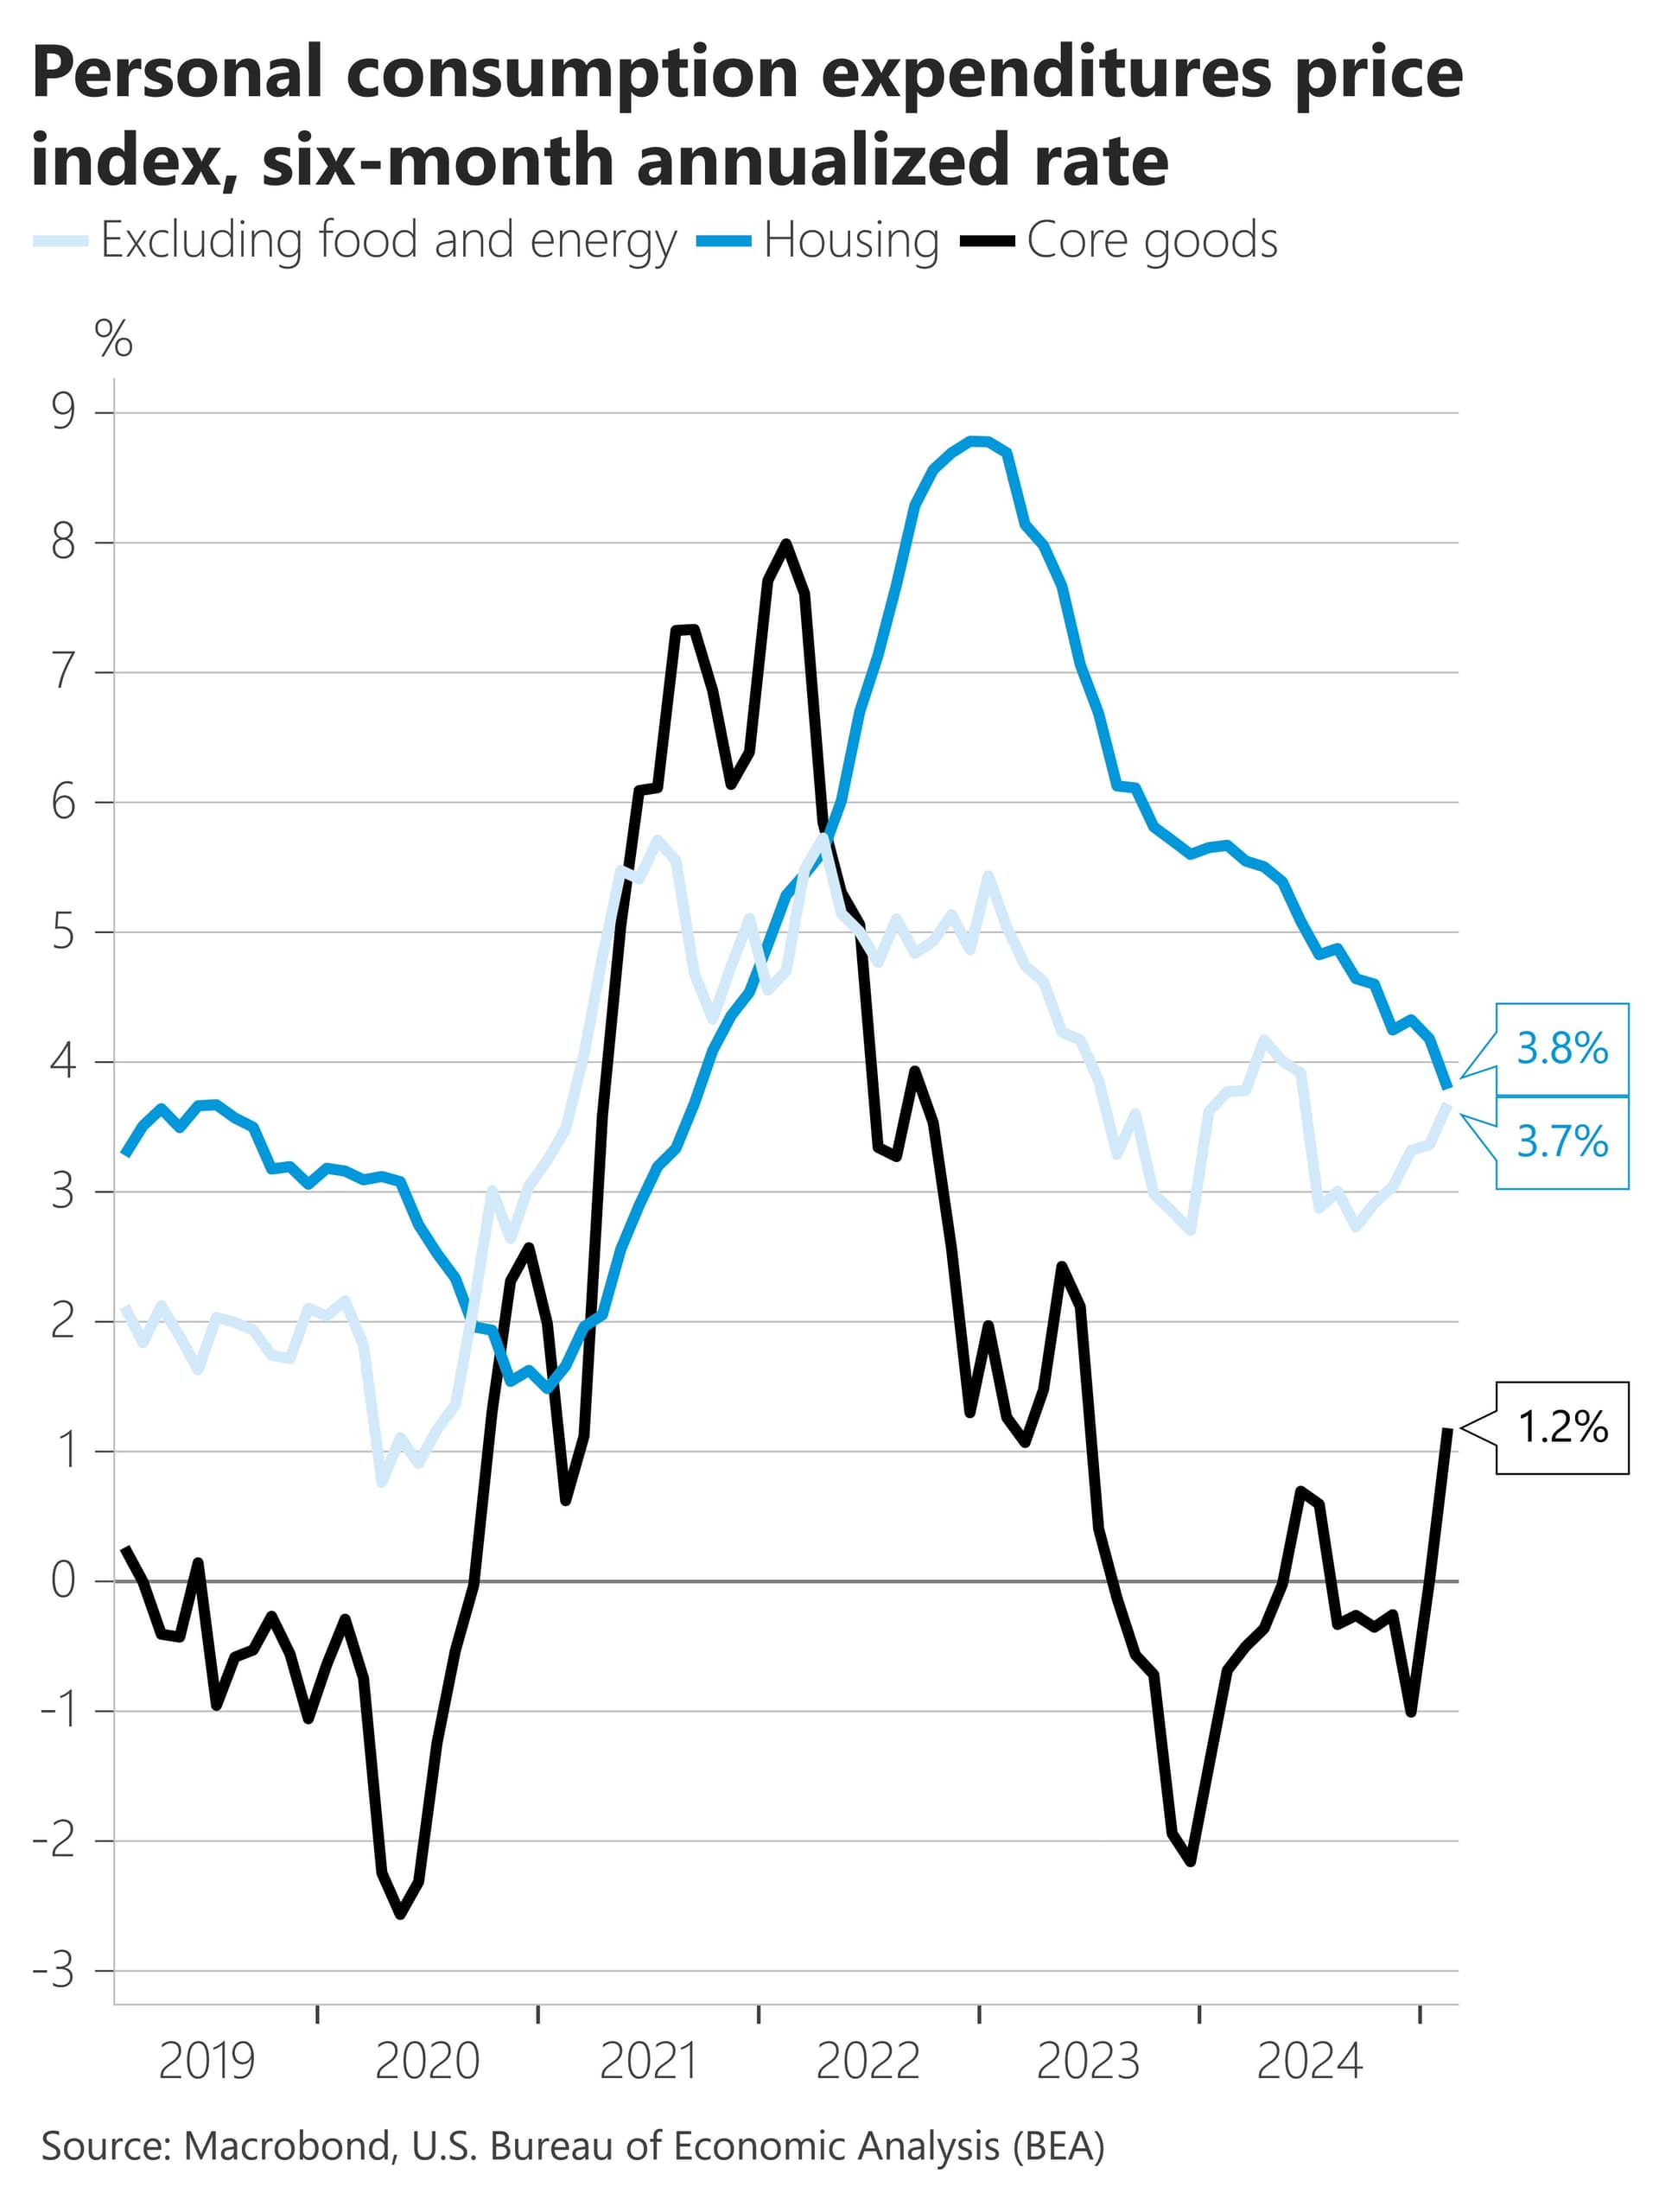
Bank of America: Given today’s PPI report and yesterday’s CPI data, they are tracking core PCE to rise by 0.3% m/m (0.32% unrounded) in February
See risk that the print could round up to 0.4% m/m.
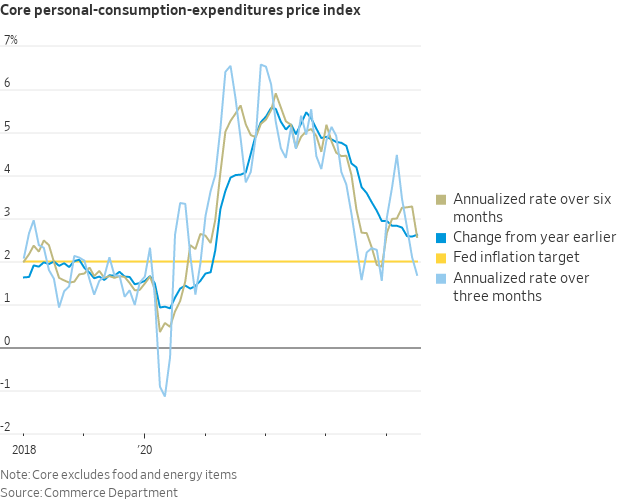
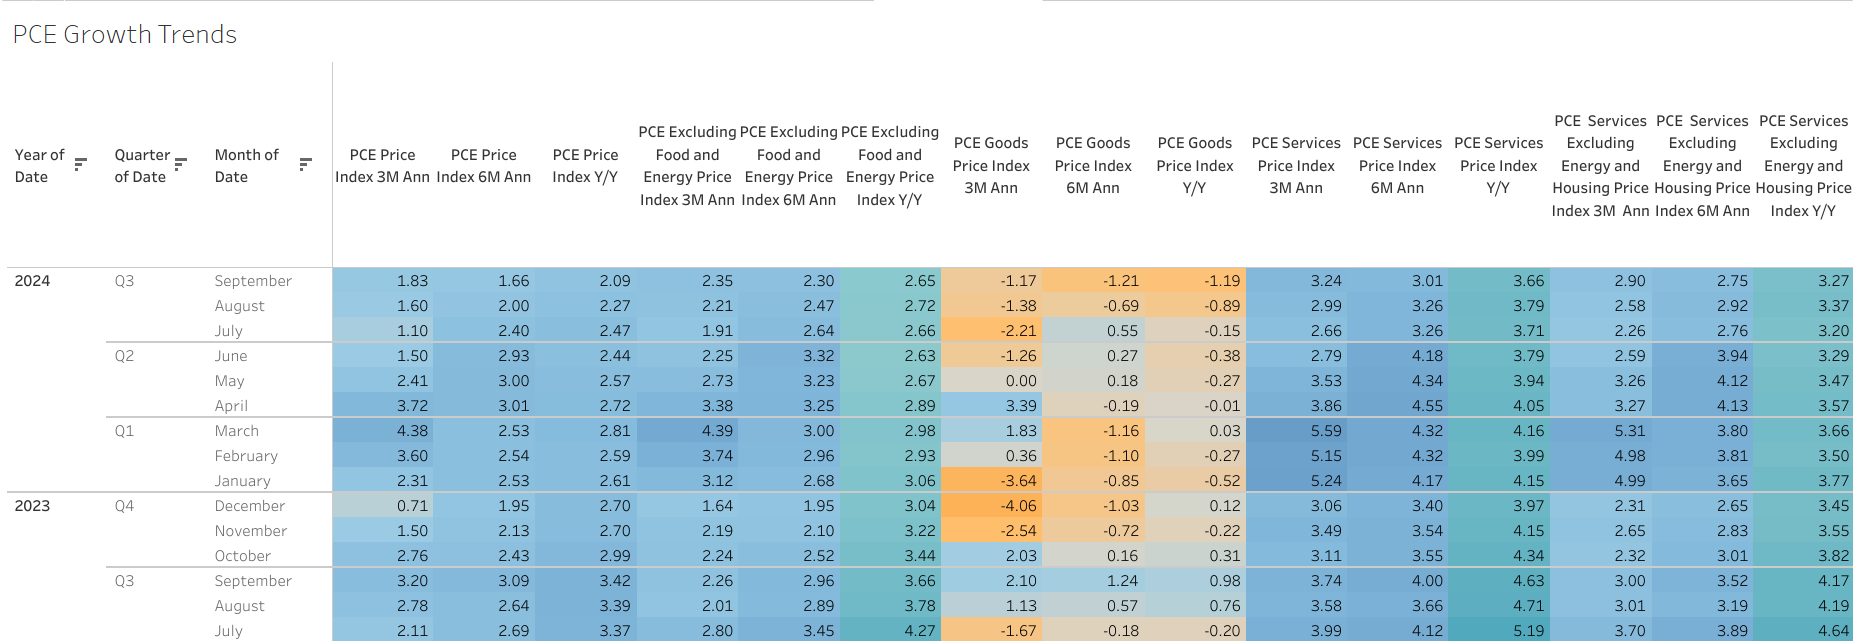
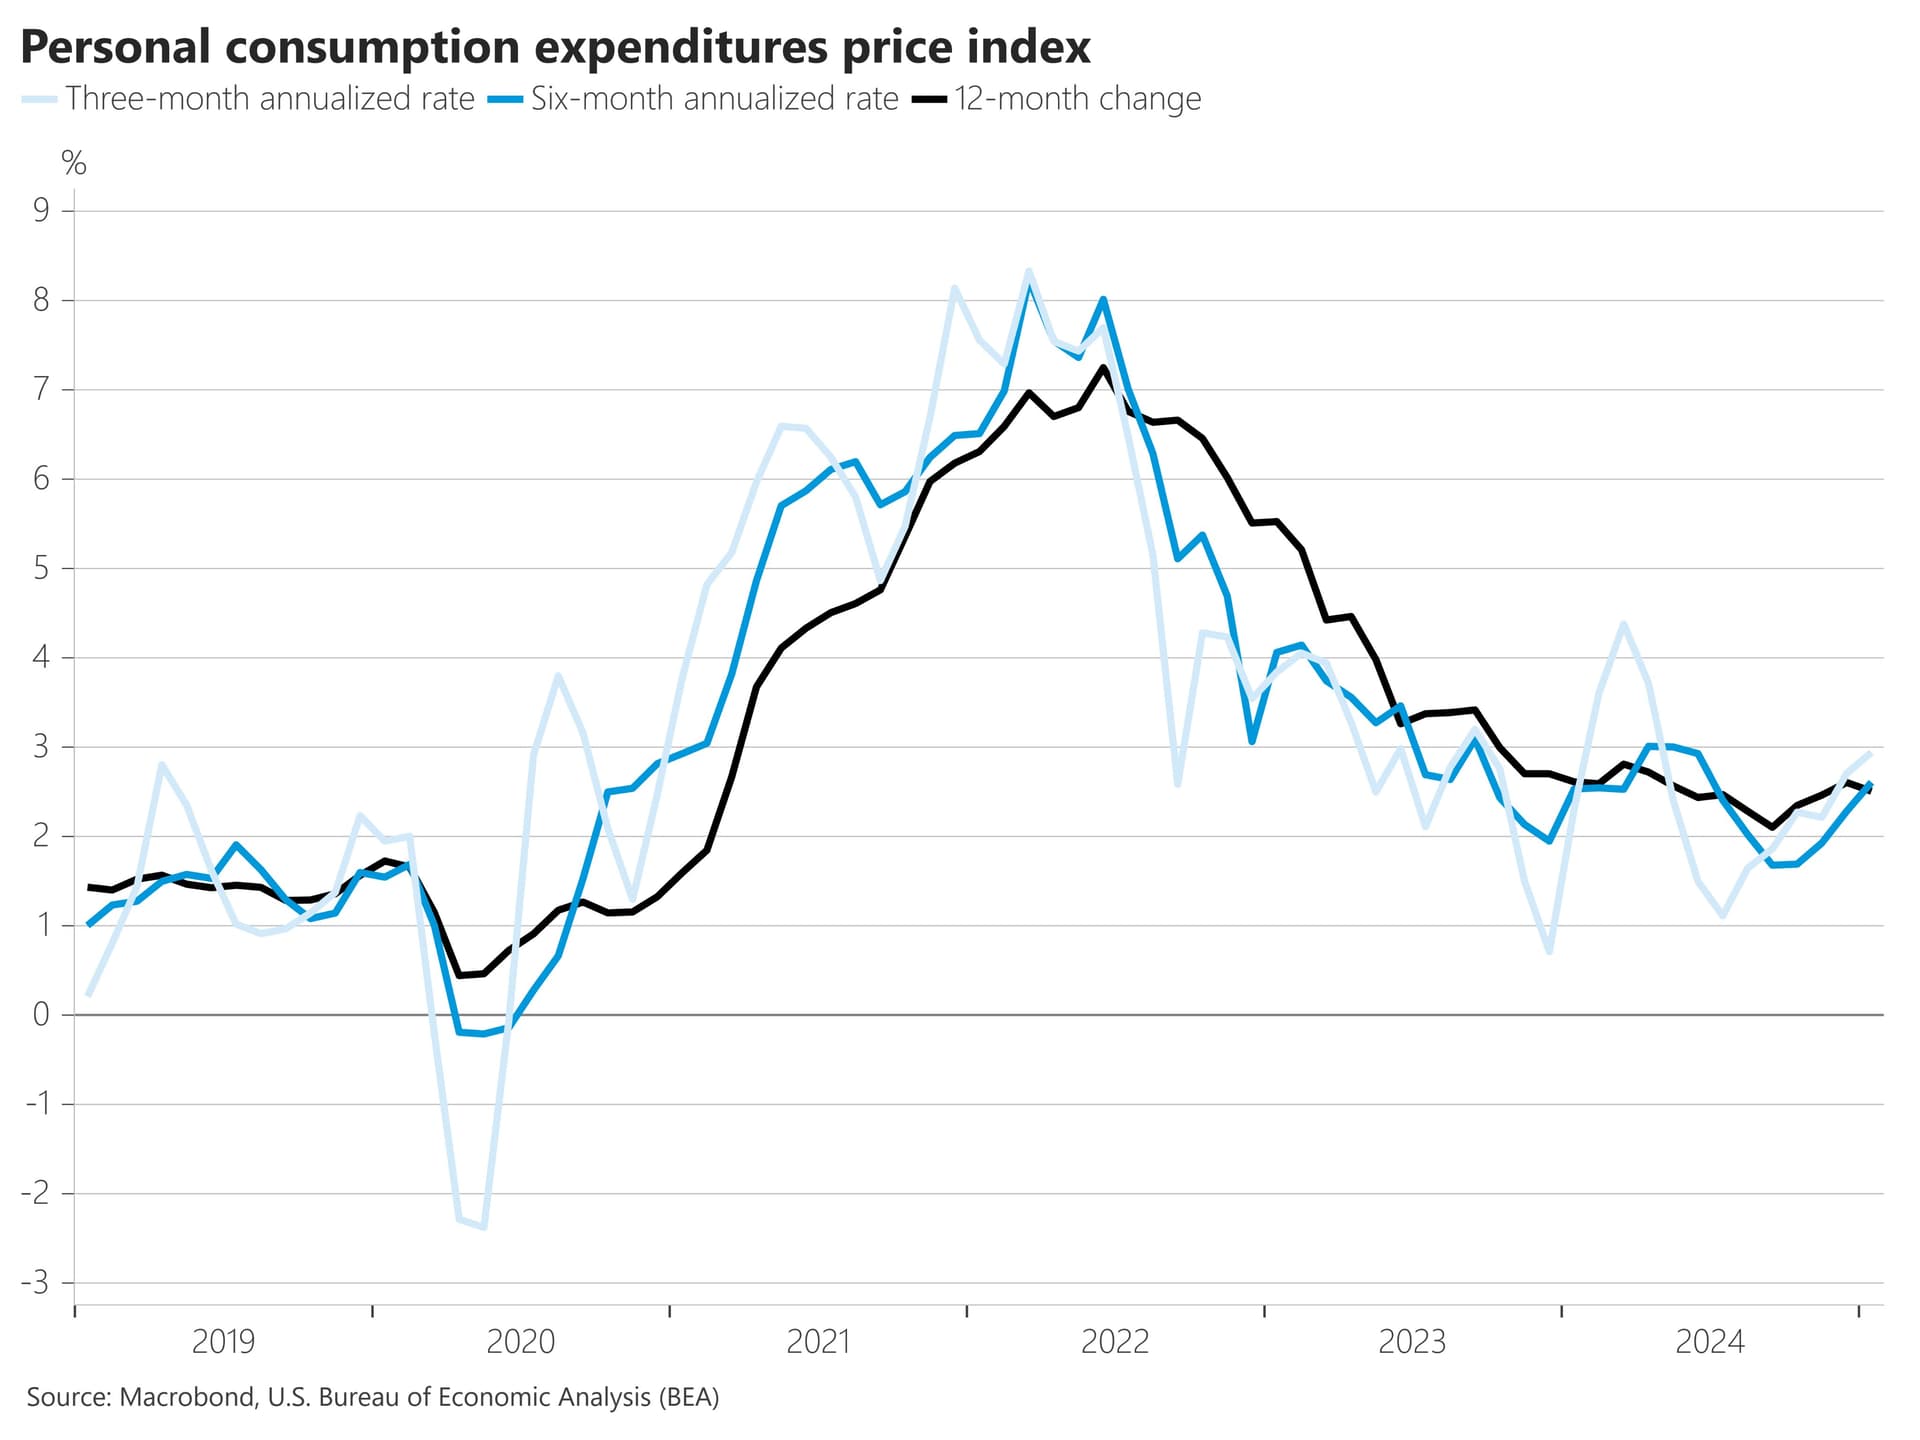
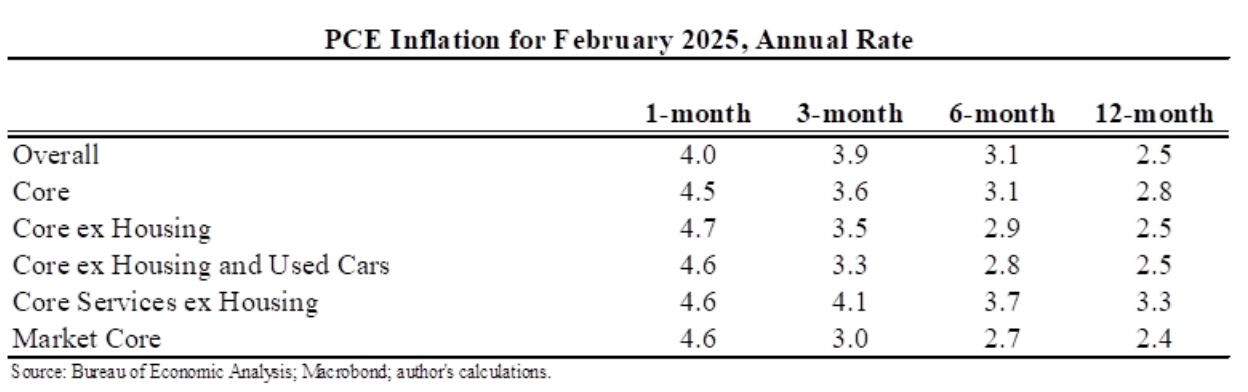
If our forecast is correct, inflation will take a step in the wrong direction. The 3-month (3.3%), 6-month (3.0%) and y/y (2.7%) rates would all increase relative to last month.
@Magaly do we have a detailed breakdown of PCE somewhere on an annual basis? I was looking briefly in this forum topic and the Wiki and I am surprised that we might not have it?
What I found was a breakdown into categories e.g. services, durable good, non durable goods here but not a detailed breakdown how much of this is cars, food etc. etc.
Ps: I just quickly searched and we get more insights into this definitely from GDP (p. 9) but maybe there are even better or more detailed sources out there or we have it already.
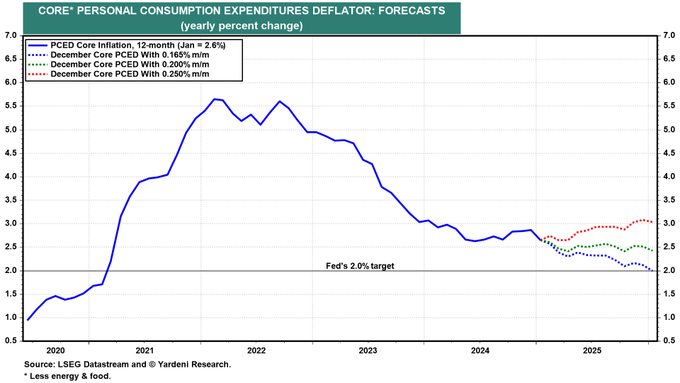
Not a positive development in PCE price index, which is before the bulk of the impact from tariffs in coming months. I currently see very difficult the 2% goal anytime soon, and think we could even go back to core PCE numbers at or above 3%.
Most developments are currently concerning imo, and leave the FED in a very difficult position in an economy that could be also slowing due to government policies.
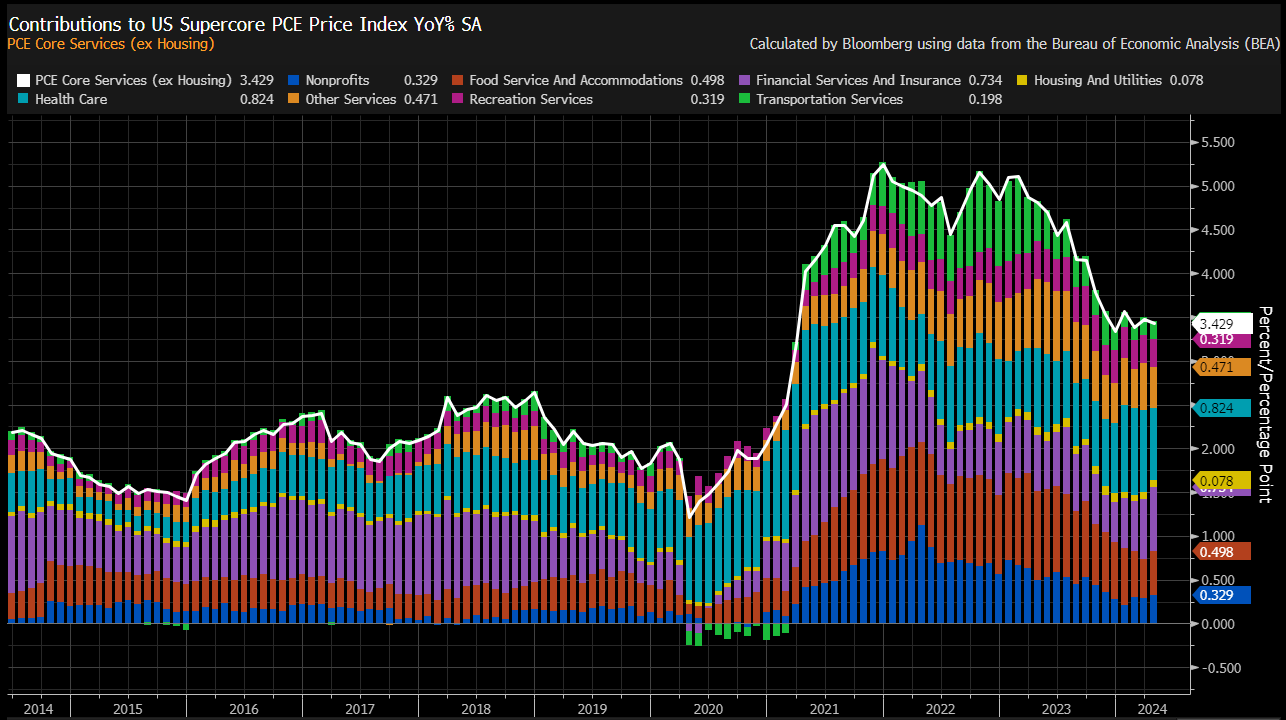
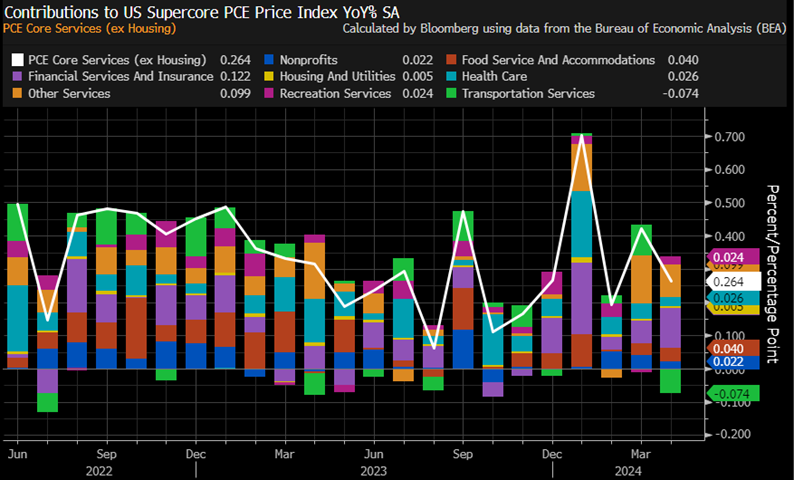
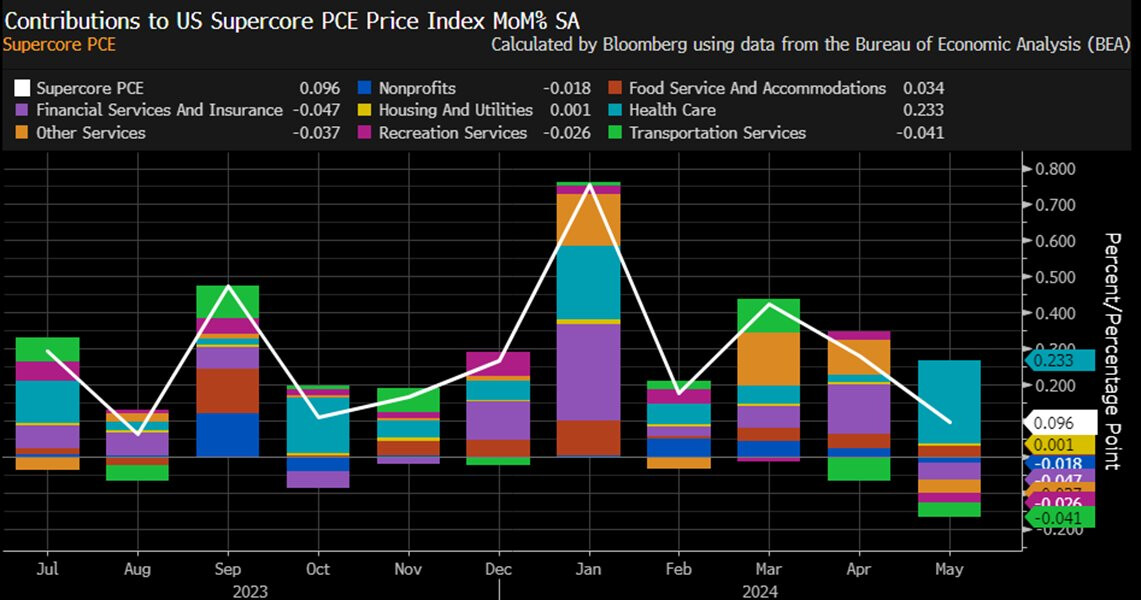
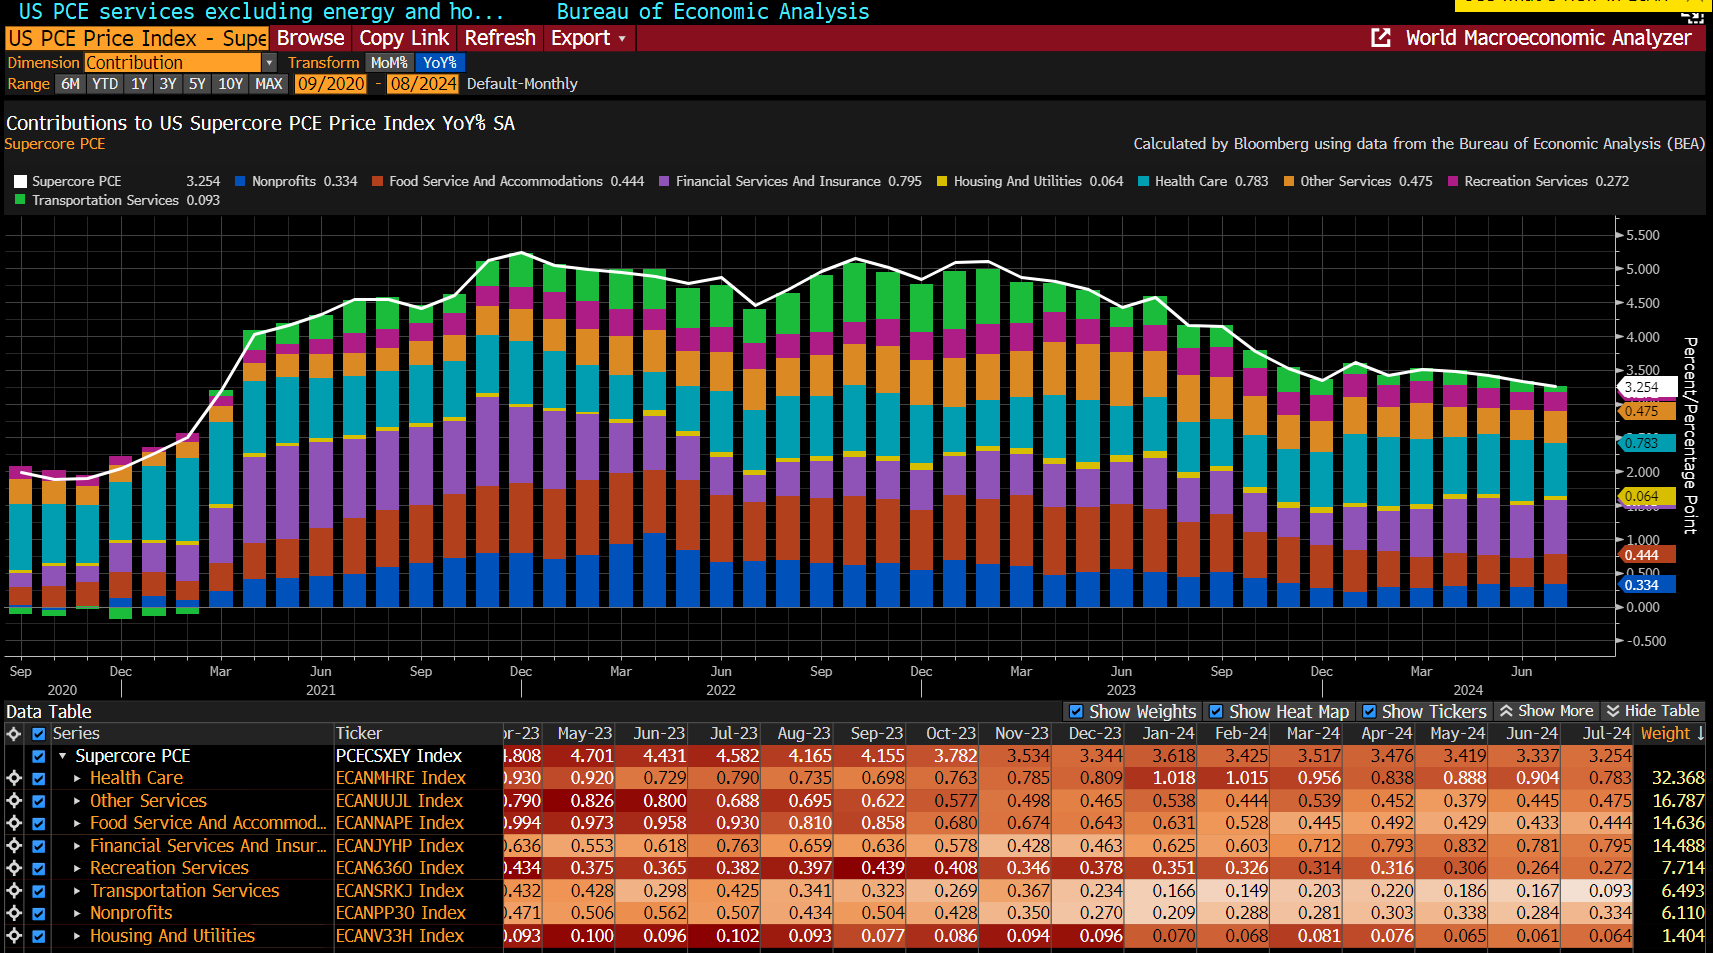
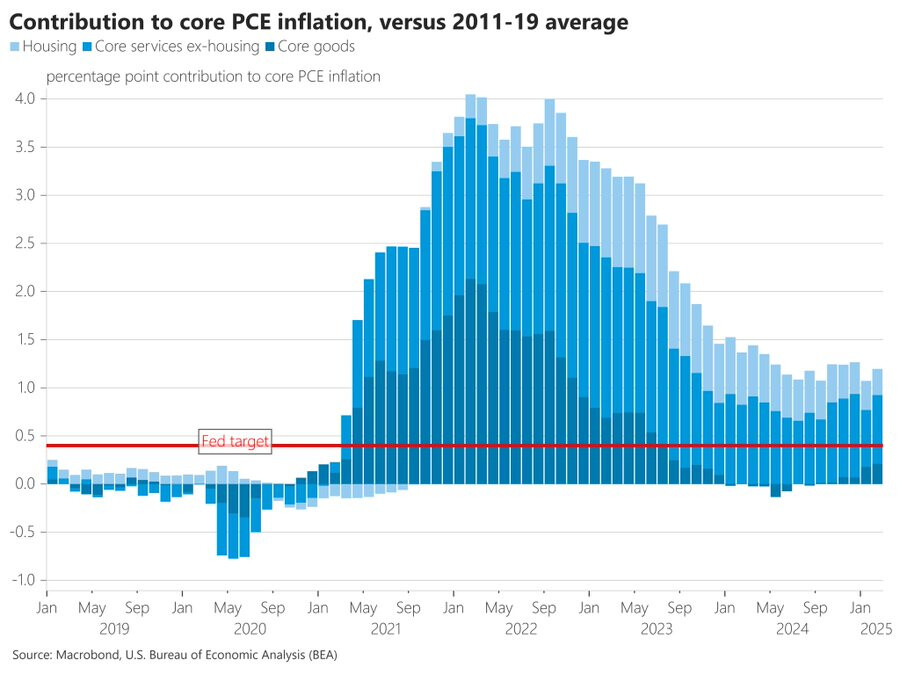
No much impact on PCE from tariffs yet, most upside in core PCE was from services (78%). This is not positive as goods inflation is expected to increase in the coming months also due to tariffs.
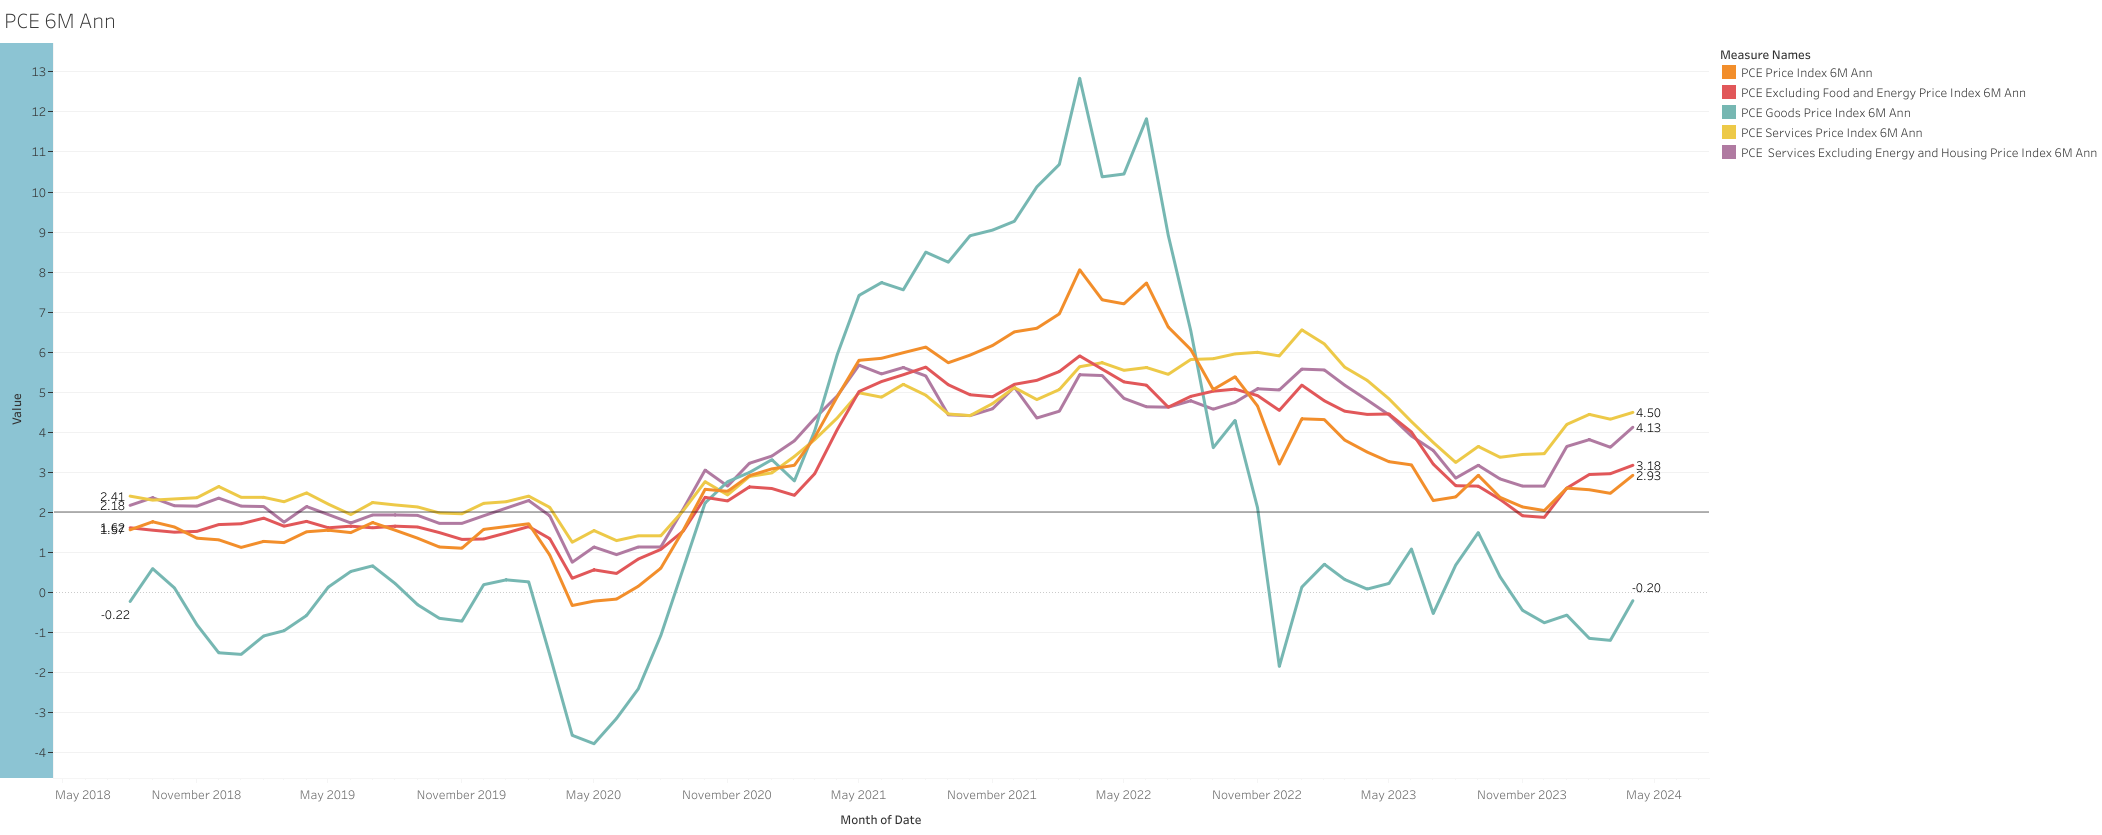
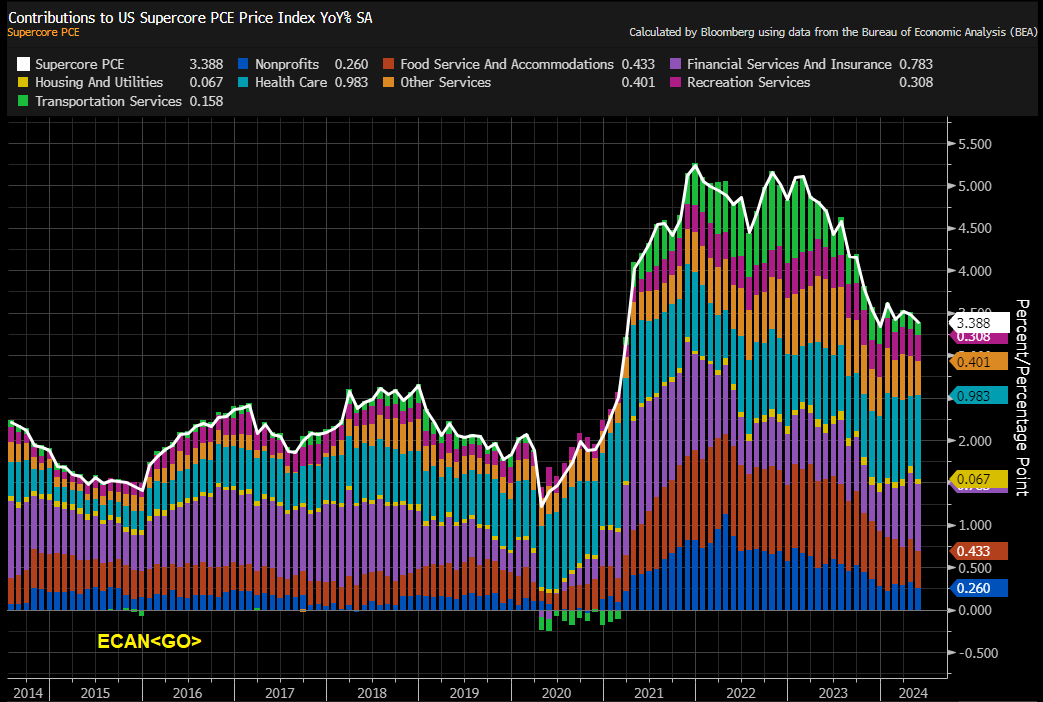
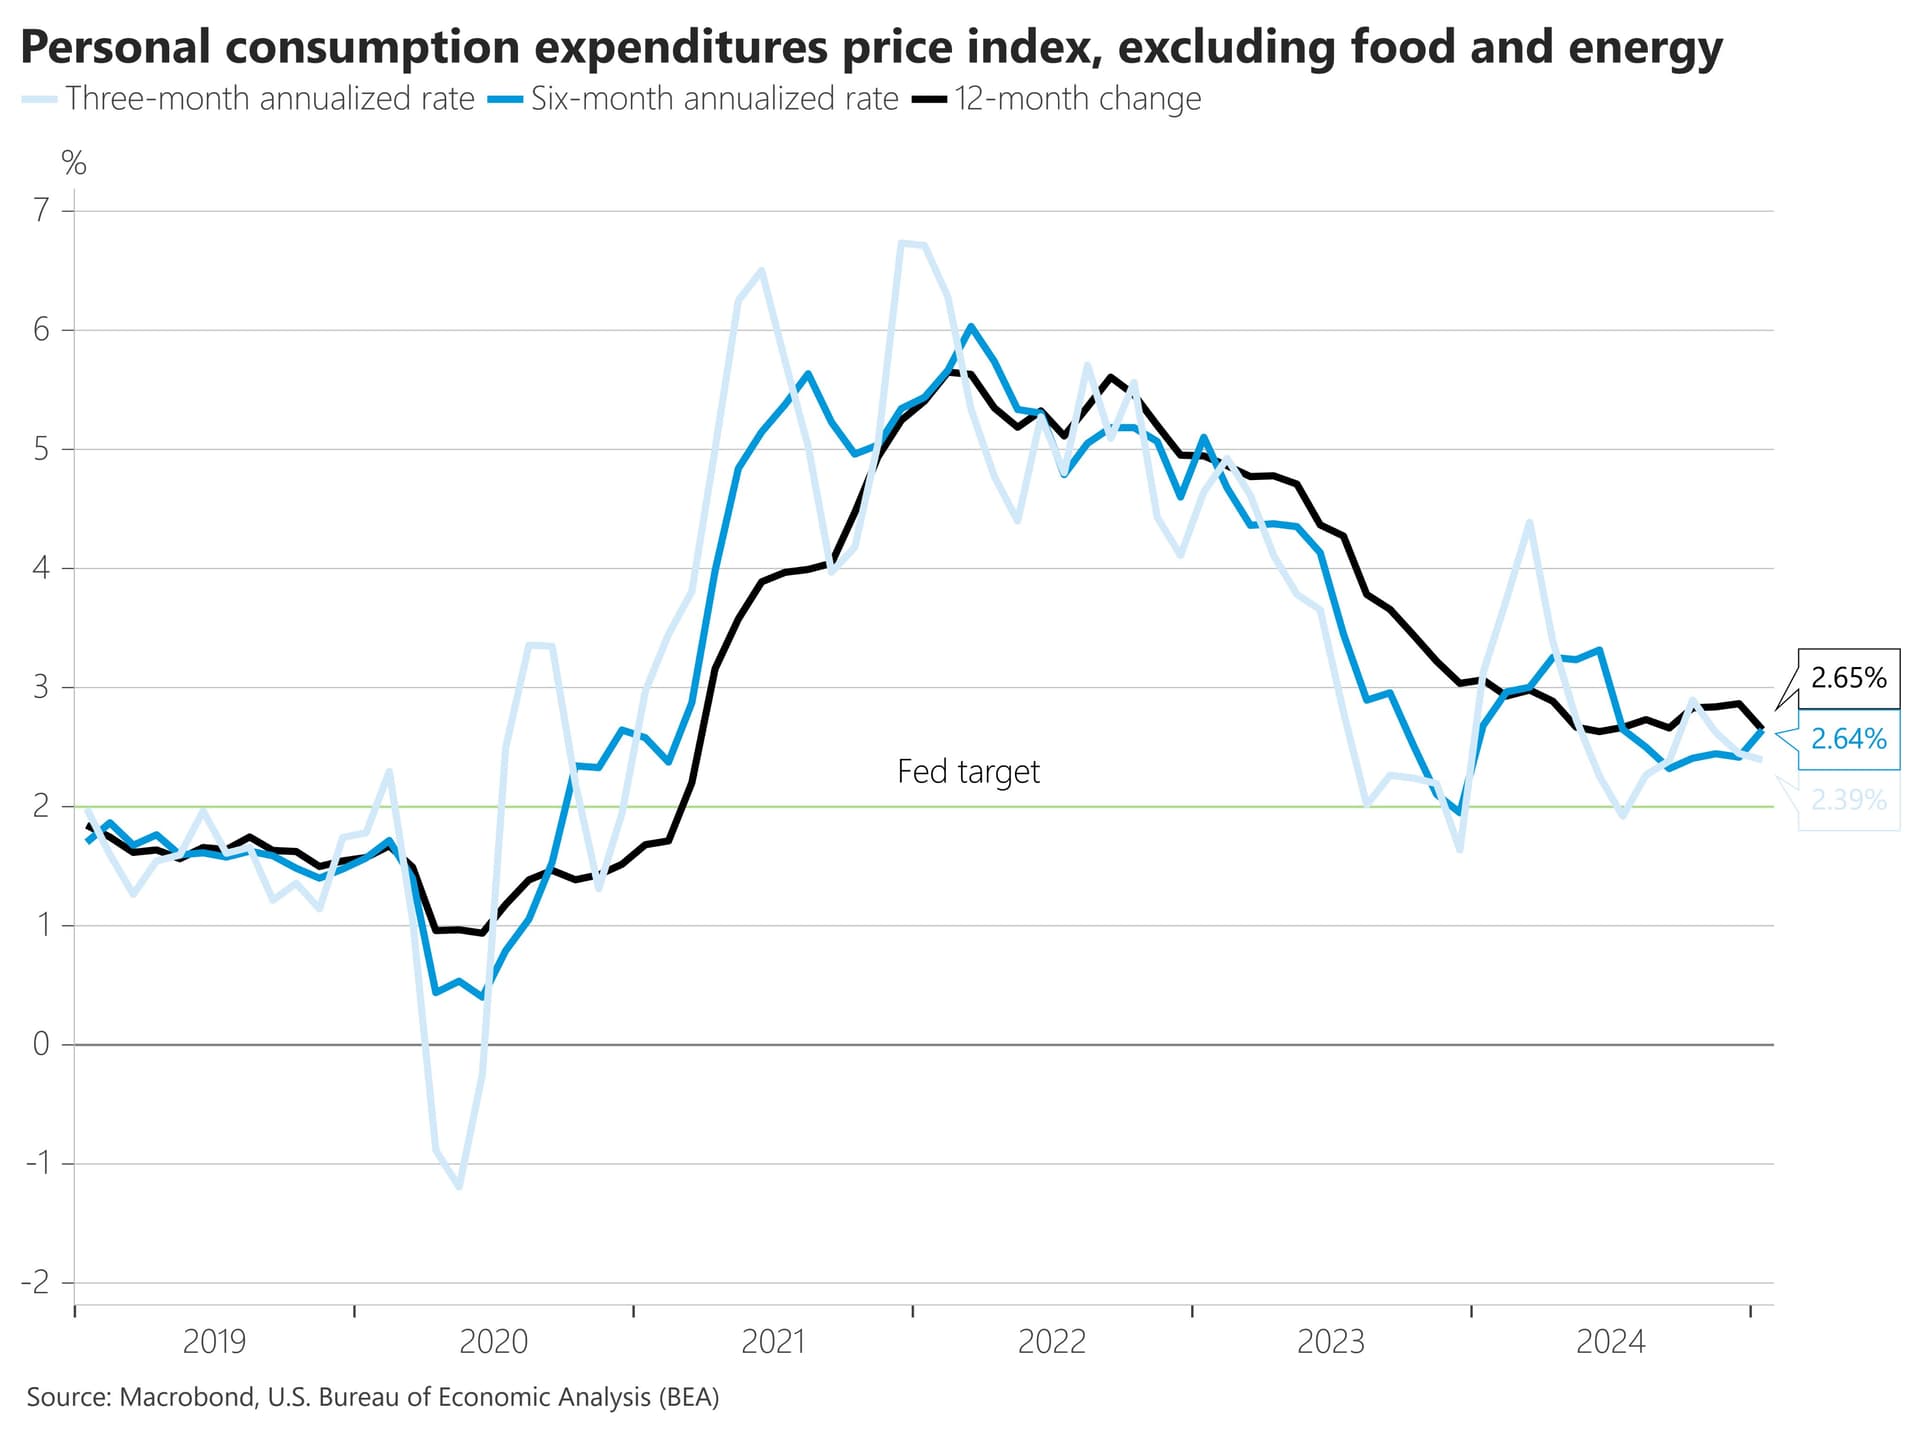
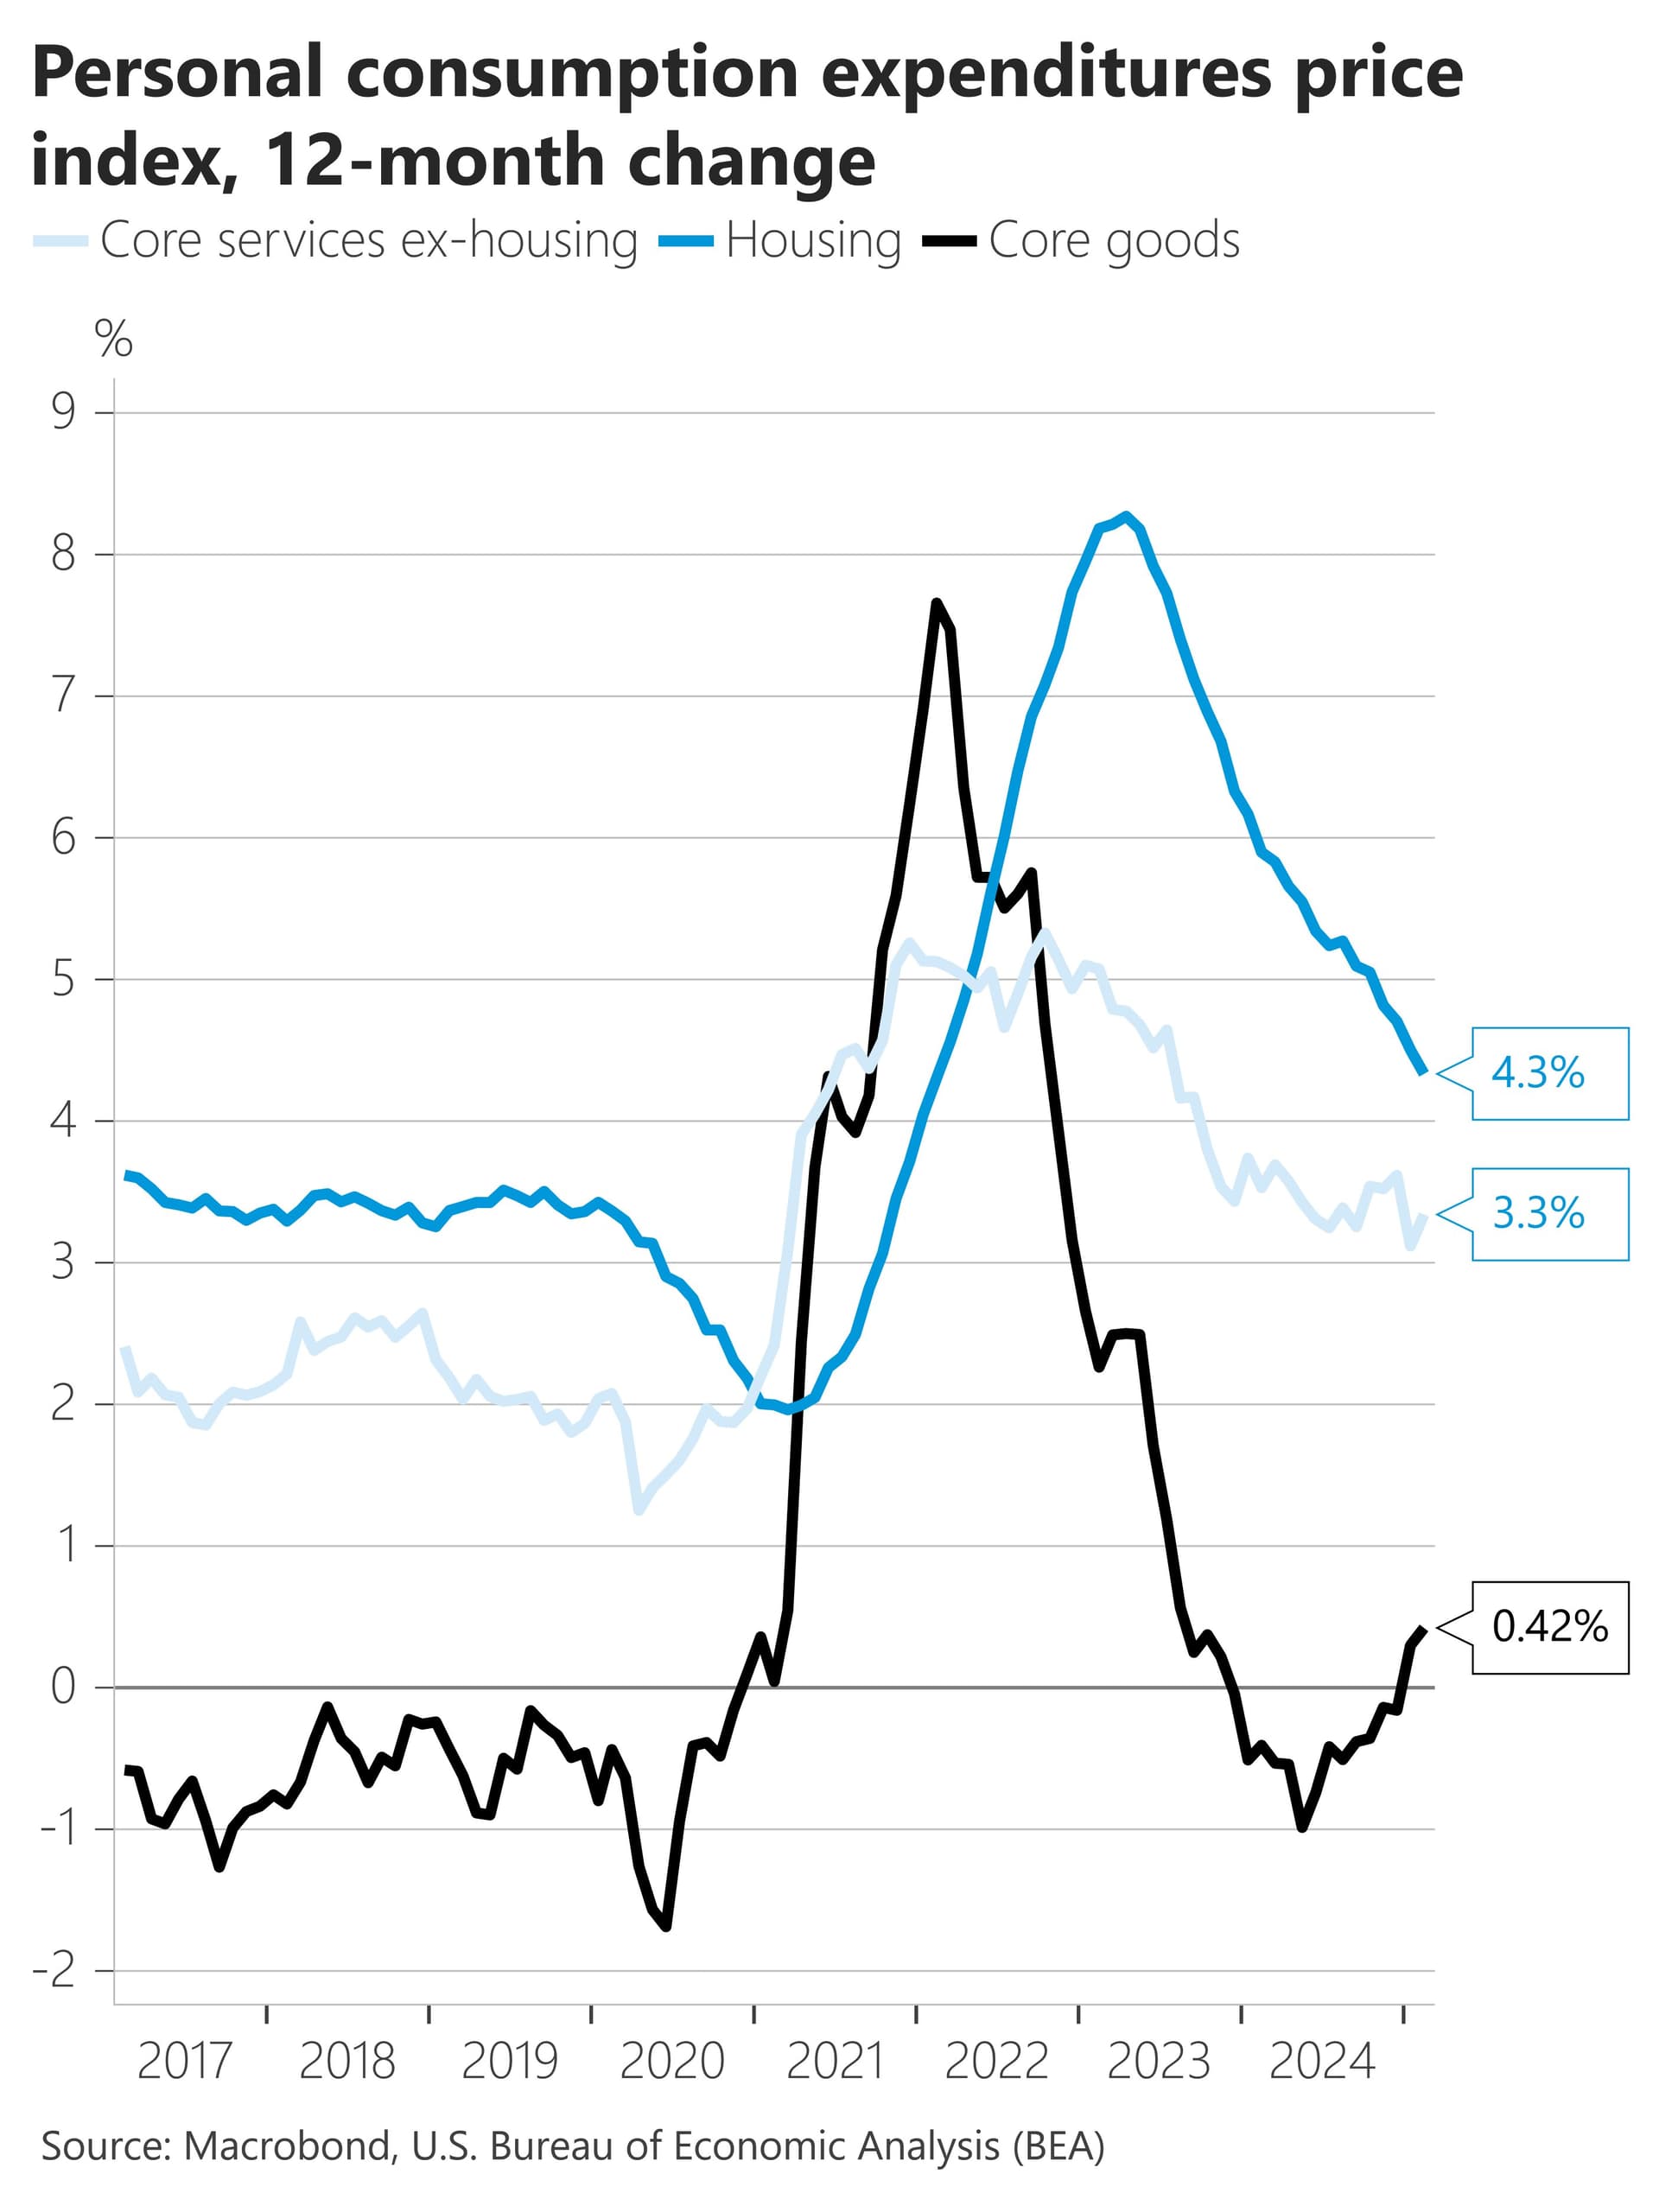
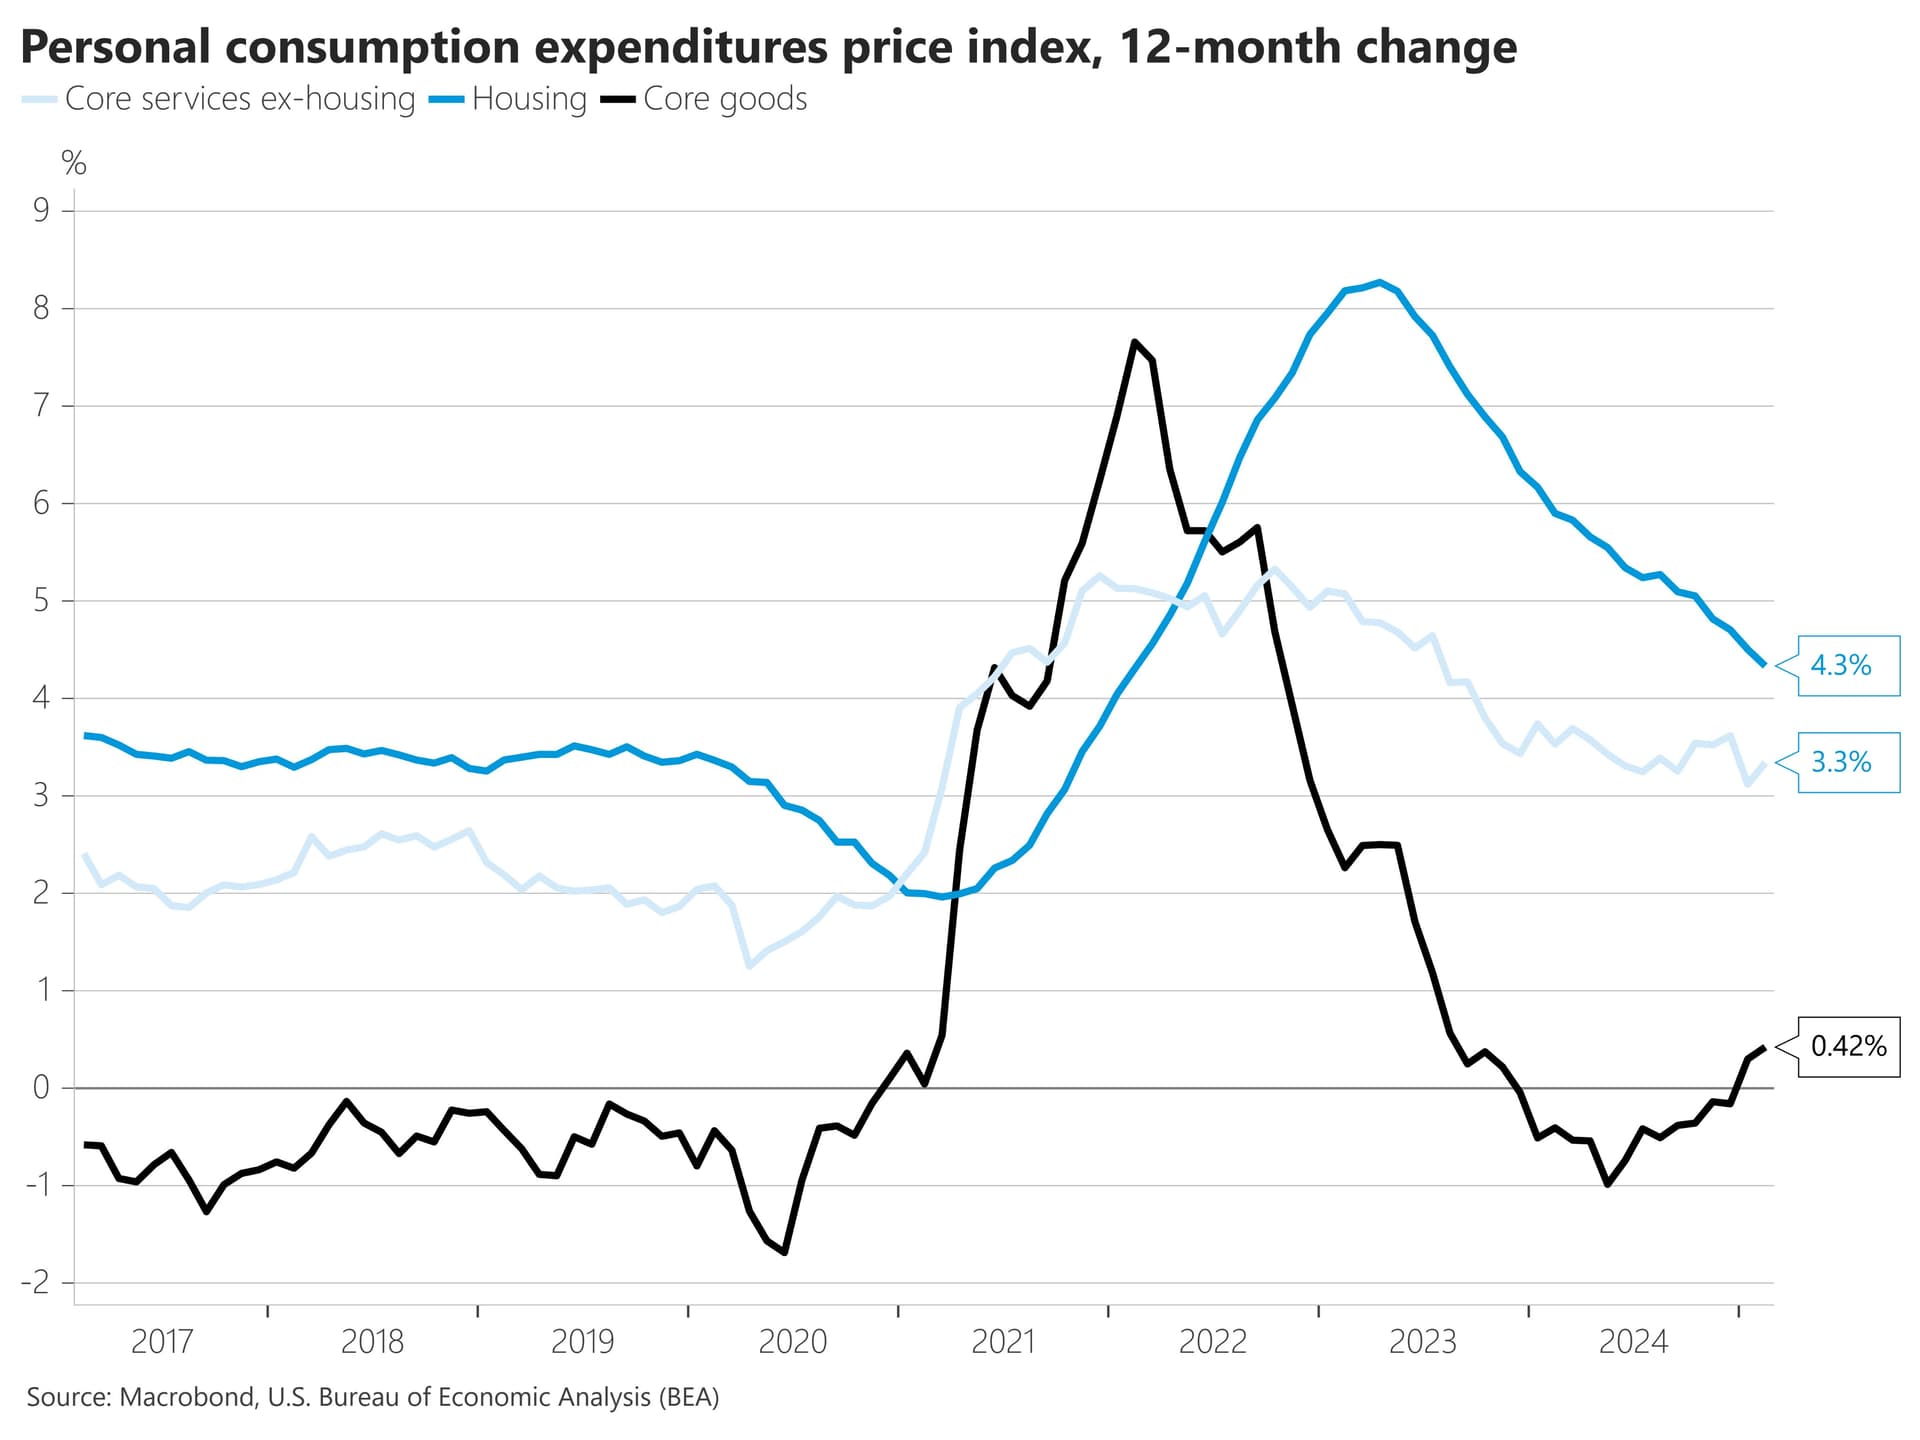
Most of the current overshoot still comes from core services ex-housing, which is running 0.7 pp above the prepandemic average (down from +0.8 pp one year ago).
Housing is now 0.3 pp above its prepandemic average (down from +0.5 pp one year earlier)
Core goods is 0.2 pp above its prepandemic average. This is up from one year ago, when it had returned to the prepandemic average.
What is causing the inflation in services to be so high?
I think in terms of format we could still experiment to make it even easier to a reader to instantly see what is most important.
After all my vision for the Forum is to be a quick briefing but not a format for in depth research (which is instead done in the Wiki/Notion)
This is important because otherwise it decreases the chance that people incl. me actually read the full forum post + it’s harder to derive the key value out of it fast.
For example I found the part focused on the pp above average a bit hard to understand.
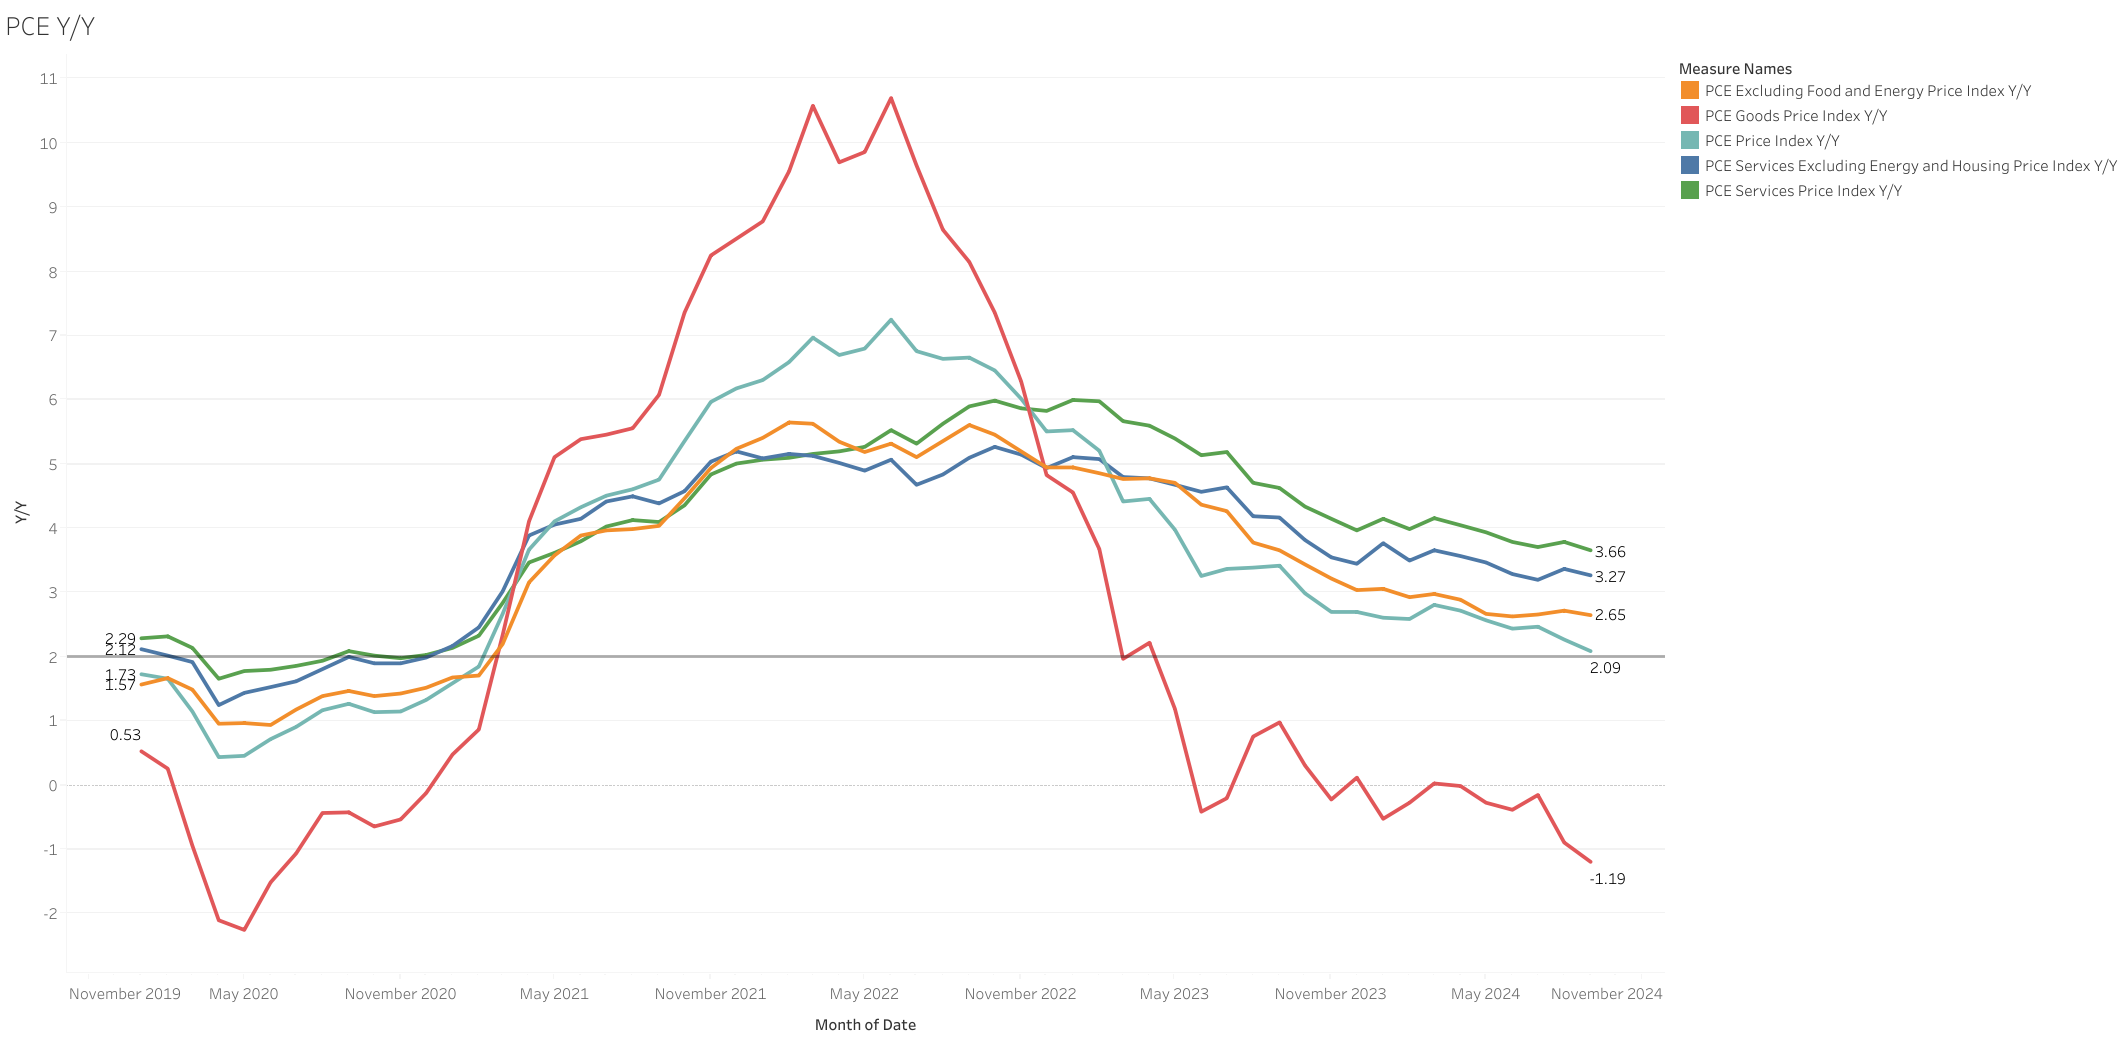
The chart is interesting for sure but in order to make sense of it I first needed to look up the service inflation in the chart above which stands at 2.47% y/y and then declude the 0.3pp that housing is above average and the 0.7pp that core services ex housing is above average to conclude that service inflation average might be 1.47%. (But even after doing this I am not 100% sure if my logic is correct and I don’t want to do further research to double check)
I think those kind of relations can be way better and more logically connected and described in our in depth research formats so that readers instantly understand those things without needing to make those connections themselves and we can effectively guide them (incl. me), through what is important, while reserving the forum mainly for briefings and discussions.