Personal Consumption Expenditure (PCE) Price Index

This topic is to discuss PCE data releases and developments during the month that could give us an indication about the FED direction in the coming months.

We track the data here: Personal Consumption Expenditure - InvestmentWiki

SI=2%, I=8

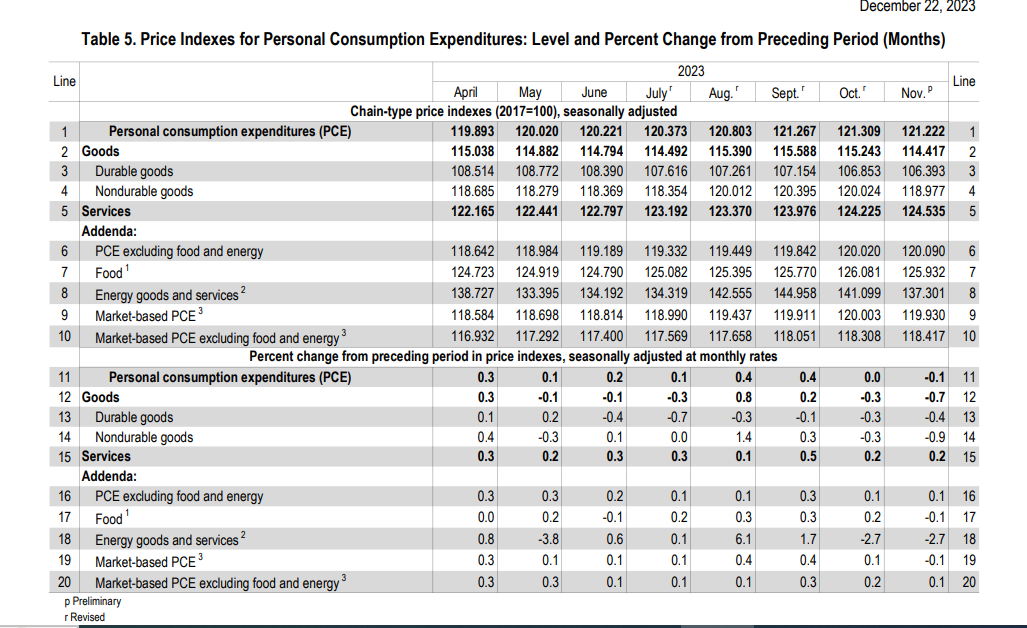
  • Core PCE rose 0.2% in June in-line with Dow Jones estimate, and lower than the 0.3% increase in May.

  • Year-over-year, core PCE increased 4.1% versus 4.2% estimate, and below 4.6% increase in May.

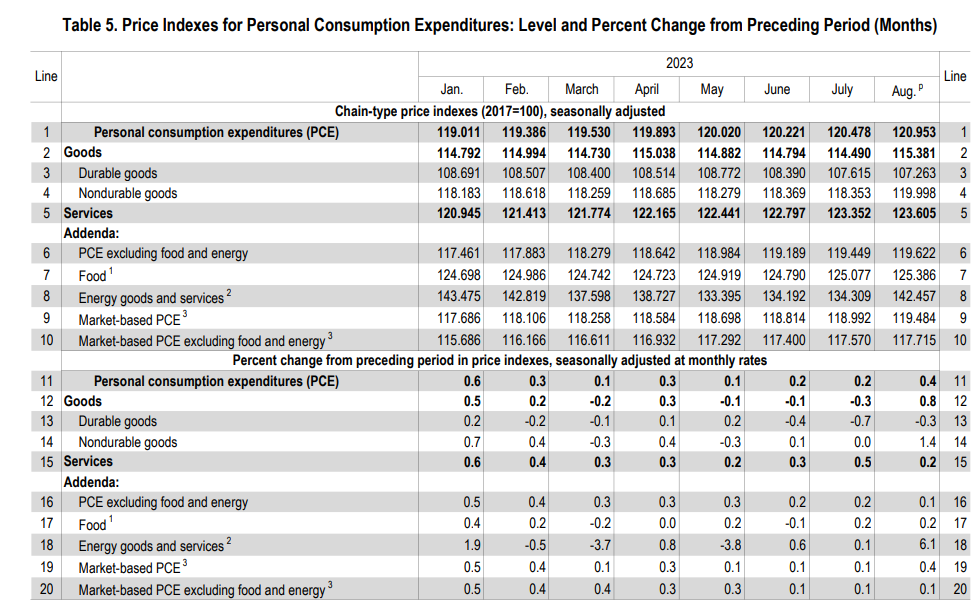
  • Headline PCE rose 0.2% in June versus 0.1% in May.

  • Yearly, headline PCE rose 3%, down from 3.8% increase in May.

  • Personal income(nominal) rose 0.3% in June versus 0.4% estimate.

  • Personal spending(nominal) rose 0.5% in-line with estimates.

    Personal Consumption Expenditure - InvestmentWiki

2 Likes

SI=0%, I=7

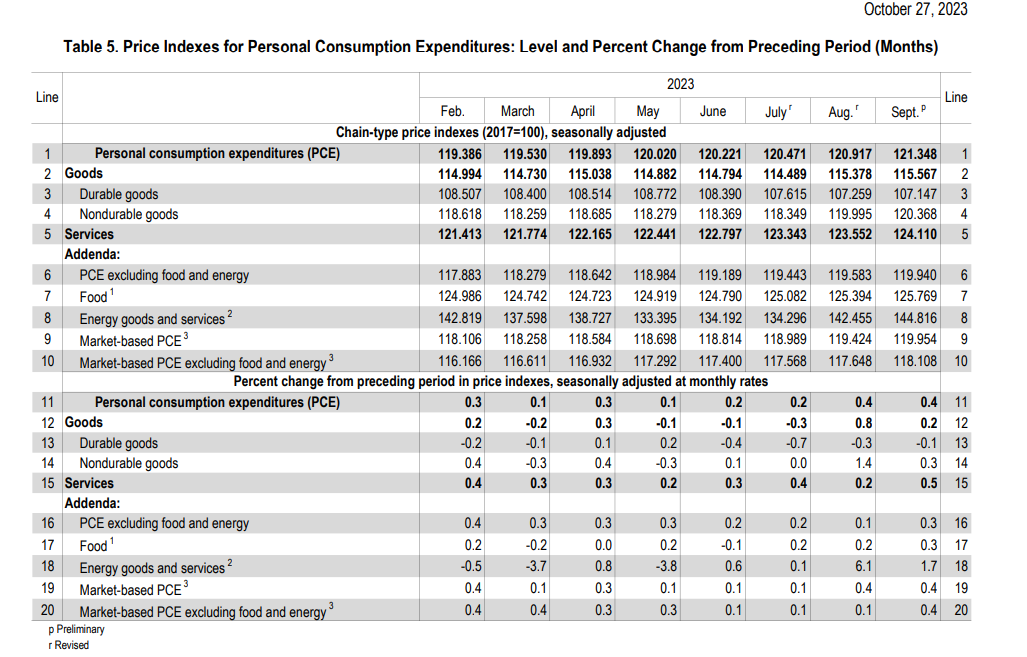
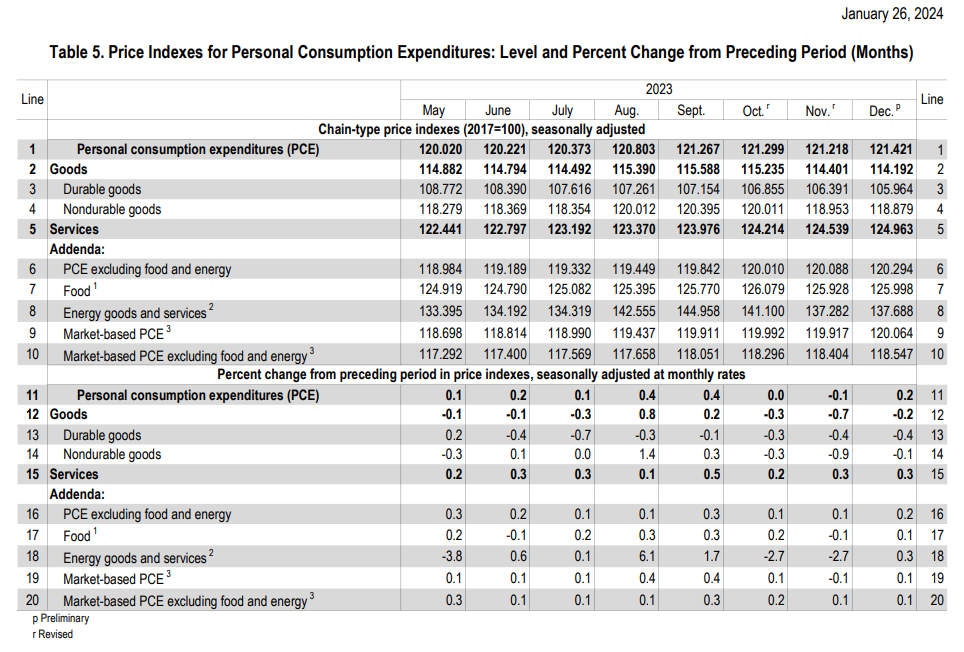
  • Core PCE increased 0.2% in July, in-line with the forecast and same as in June.

  • Yearly, core PCE rose 4.2% in July, also in-line with the estimate but above the 4.1% increase in June.

  • Headline PCE grew 0.2% in July, unchanged from June and in-line with the estimate.

  • Real consumer spending rose 0.6% for the month, above the 0.5% estimate.

  • Services inflation less housing and energy rose 0.5% in July, the biggest advance since January, contributed mainly by an outsize increase in management and investment advice service.

https://www.bloomberg.com/news/articles/2023-08-31/key-us-inflation-measures-post-modest-gains-while-spending-jumps

1 Like

I=8

  • Core personal consumption expenditures (PCE) price index rose 0.1% in August, below the 0.2% estimate and lower than the 0.2% gain in July.
  • Year over year, core PCE grew 3.9%, down from 4.3% gain in July (revised up from 4.2%) and in-line with the estimate.
  • Personal spending rose 0.4%, in-line with estimates and below 0.9% (revised up from 0.8%) gained in July.
  • Personal income rose 0.4%, also in-line with the estimate but above the 0.2% gain in July.
  • Inflation in August was largely driven by energy which rose 6.1% in August.
  • Super core inflation rose 0.1% for the month after rising 0.5% in July.

Y/Y Change:
Core goods: +0.5%
Housing: +7.4%
Core services ex-housing: +4.4%
image
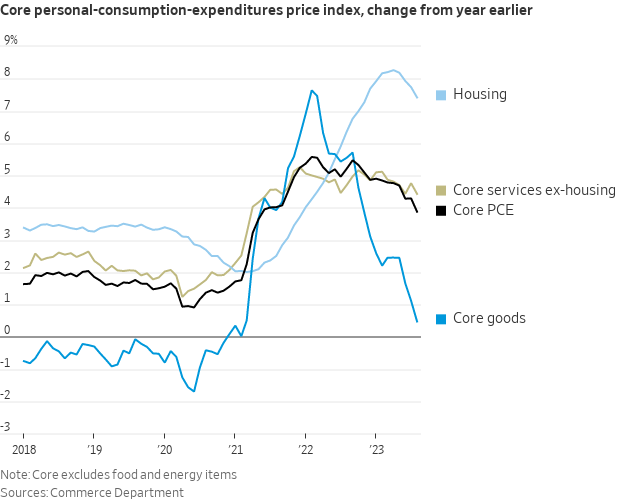
https://twitter.com/NickTimiraos/status/1707763133048107358/photo/1

1 Like

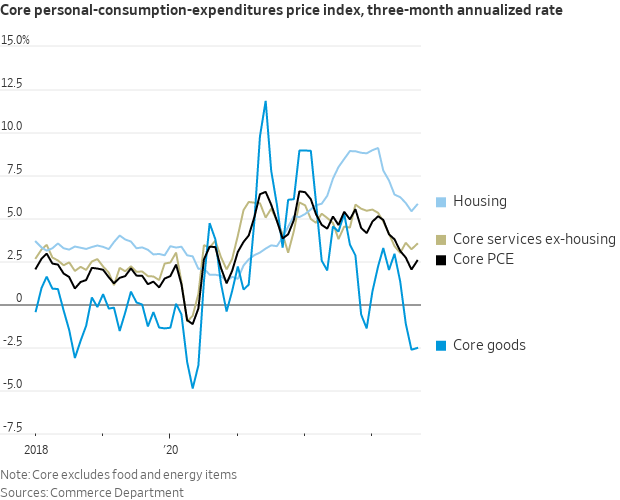
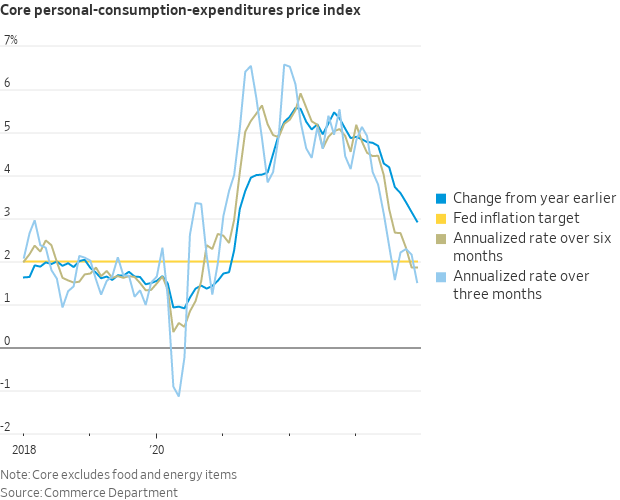
Core looking good, but headline still uncertain.
image
image

  • Core PCE rose 0.3% in September, in-line with estimates and above 0.1% increase in August.
  • Personal spending rose 0.7%, above 0.5% etimate.
  • Personal income increased 0.3%, below 0.4% estimate.
  • Headline PCE rose 0.4% for the month, unchanged from August.
  • Year-over-year, core PCE rose 3.7%, in-line with estimate and below 3.8% in August (revised down from 3.9%).
  • Year-over-year, headline PCE rose 3.4%, unchanged from August (revised down from 3.5%).

1 Like

Different components, while the y/y is declining nicely, and 3 month trend is not great. Similar to CPI.
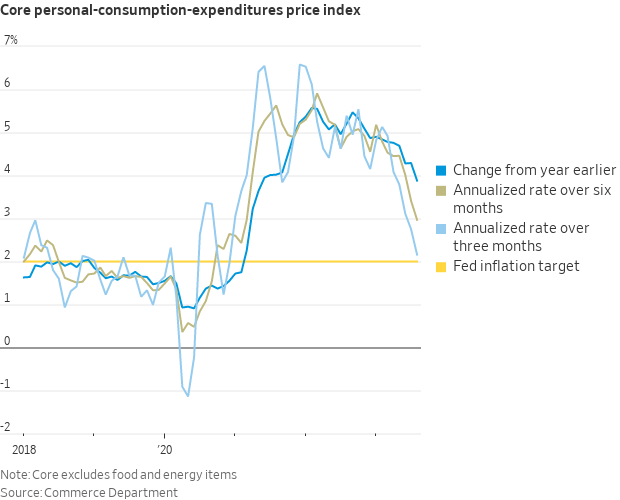
image
image
https://twitter.com/NickTimiraos/status/1717894838538908086

I=7

  • Core PCE rose 0.2% in October and 3.5% on a yearly basis, both in-line with the estimates.
  • Personal income and spending grew by 0.2% on the month, both in-line with the estimates.
  • Headline PCE was flat in October but grew 3% year-over-year, compared to growth of 3.4% year-over-year in September.

2 Likes

I=7

  • Core PCE rose 0.1% in November, lower than the 0.2% estimate and same as the previous month (revised down from 0.2%).
  • Yearly, core PCE rose 3.2%, lower than 3.3% expected and 3.4% in October (revised down from 3.5%).
  • Personal income rose 0.4% while and spending grew by 0.3% on the month, both in-line with the estimates.
  • Headline PCE fell 0.1% in November versus expectations to be flat.
  • Year-over-year, Headline PCE was up 2.6%, lower than 2.8% estimate and 2.9% in October (revised down from 3.0%).

https://www.bea.gov/sites/default/files/2023-12/pi1123.pdf

1 Like

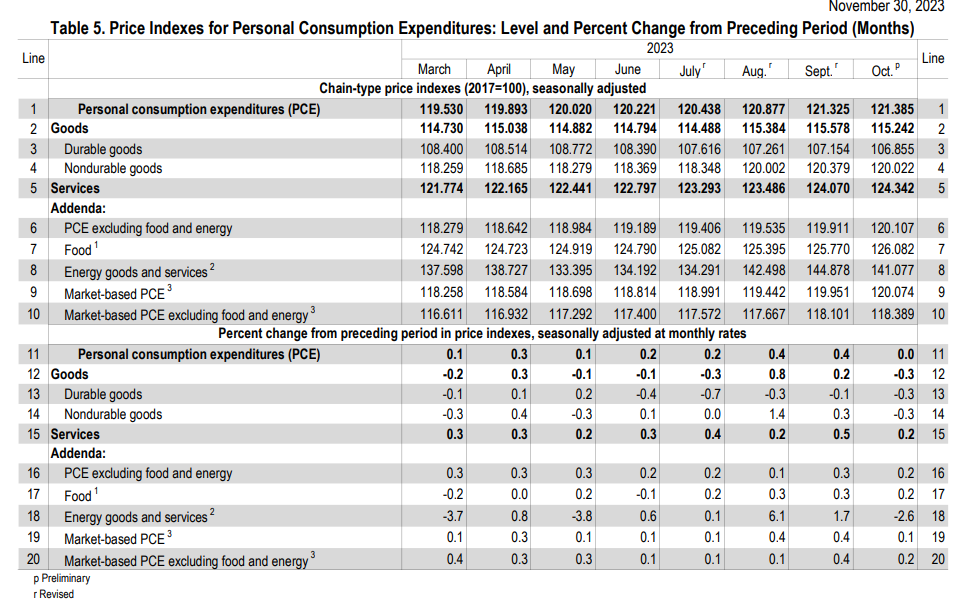
Six months annualized rate for core is now at 1.9%. Rates saying 5.5% are making policy more and more tight each month if inflation comes down.
I sometimes wonder or give some thinking to the possibility that the FED will actually be late to cut rates (will not be the first time), and cause instead some deflation next year due to the fear of a 70-80’s scenario again.
A totally unexpected outcome currently in the markets.
Is a tricky environment currently to know what the right move will be, as the path is not really clear and all scenarios have some possibility still.

For now, is good to see it come down, and spending being still stable. Is probably going to continue to fuel the soft landing narrative and positive sentiment currently.
image
https://twitter.com/NickTimiraos/status/1738191709370978309/photo/1
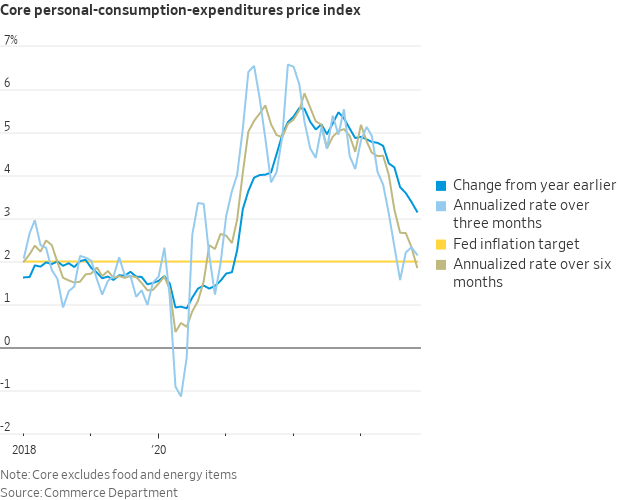
1 Like

I=6

  • Core PCE rose 0.2% in December, in line with the estimate.
  • On a yearly basis, core PCE rose 2.9%, below expectations for a 3% increase.
  • Personal income fell to 0.3%, in line with the forecast while spending rose 0.7%, exceeding the 0.5% estimate.
  • Headline PCE rose 0.2% on the month and 2.6% on a yearly basis, both in line with the forecasts.

2 Likes

This is the evolution of super core PCE. Currently at 3.3T Y/Y.


https://twitter.com/zerohedge/status/1750877423573327997/photo/1

At a 6 month annualized rate, core PCE is already at target.
image
https://twitter.com/NickTimiraos/status/1750874882496217207/photo/1

2 Likes

I=6

  • Headline PCE rose 0.3% in January and 2.4% on a yearly basis, both in-line with the estimates.
  • Core PCE grew by 0.4% in January and 2.8% on a yearly basis, both in-line with the estimates.
  • Core PCE and headline PCE growths for the month of December were revised down to 0.1% from 0.2%.
  • Personal income rose 1%, exceeding 0.3% estimate while spending fell 0.1%, below expectations for a 0.2% increase.
  • Stock futures were up following the report. The Dow Jones Industrial Average futures rose 0.2%, S&P 500 gained 0.5% while Nasdaq composite climbed 0.9%.

2 Likes

The developments for Super core PCE are not the best for January at 0.59% m/m.
Highest m/m since 2021.


https://twitter.com/zerohedge/status/1763199024511824178/photo/1

2 Likes
  • Headline PCE rose 0.3% in January and 2.5% on a yearly basis, in-line with the estimates
  • Core PCE grew by 0.3% in January and 2.8% on a yearly basis, in-line with the estimates too
  • Core PCE 3M and 6M annualized pace rose to 3.5% and 2.9%, respectively. That is up form 2.8% and 2.6% respectively in January.
  • Super core at 0.18% from 0.66% in January. The 6M annualized pace rose 3.8% vs 3.5% last month.
  • January headline was revised from 0.3% to 0.4%, and core from 0.4% to 0.5%.
  • Personal income rose 0.3%, below 0.4% estimate while spending rose 0.8%, above expectations for a 0.5% increase.
  • Real Spending was 0.4% m/m.


6M Trends

Y/Y

Super Core

2 Likes

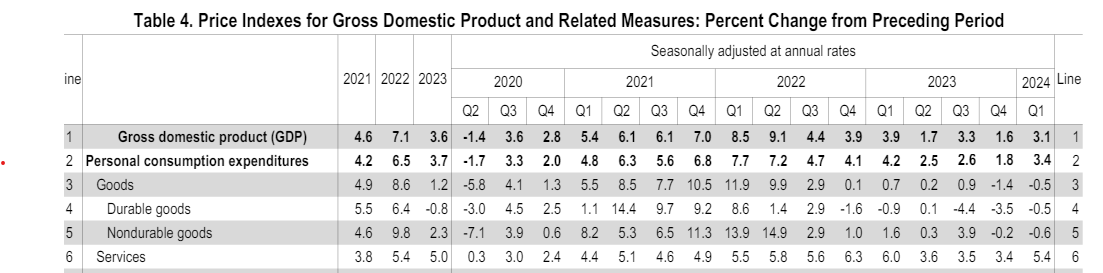
Today we also got PCE quarterly data along with the GDP report.
Q1 PCE is significantly higher compared to Q3 2023 numbers.

  • PCE at 3.4% Q/Q Ann vs 2.9% expected and 1.8% in Q4 2023.
  • Core PCE 3.7% Q/Q Ann vs 3.4% expected and 2% in Q4 2023. It was 2.9% Y/Y from 3.1% in Q3 2023.

There is speculation this would mean a hotter-than-expected report for tomorrow’s March report but is difficult to know with certainty since PCE usually has revisions to prior months.
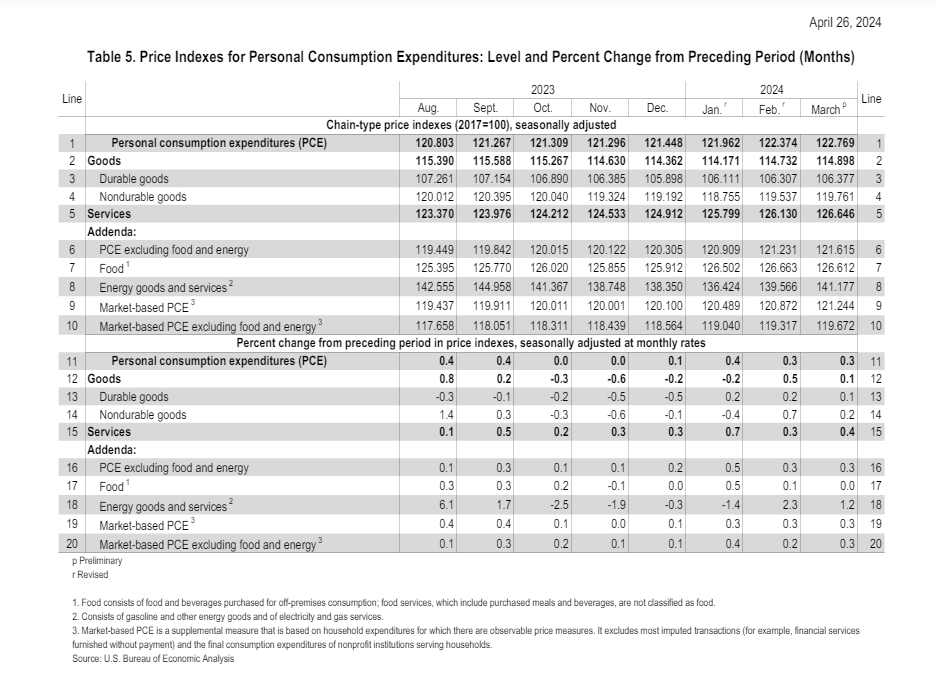
Current expectations are for 0.3% M/M, so between 0.3/0.4% could be possible.
But a soft report (probably with a lower probability) could result in a significant rally tomorrow since expectations are already skewed to be hot.

The quarterly report is not as disaggregated as the monthly one, so we would need to wait until tomorrow for more details. But today’s report showed higher prices on services mostly. Goos continue to be negative, bus much less than before.


https://www.bea.gov/sites/default/files/2024-04/gdp1q24-adv.pdf
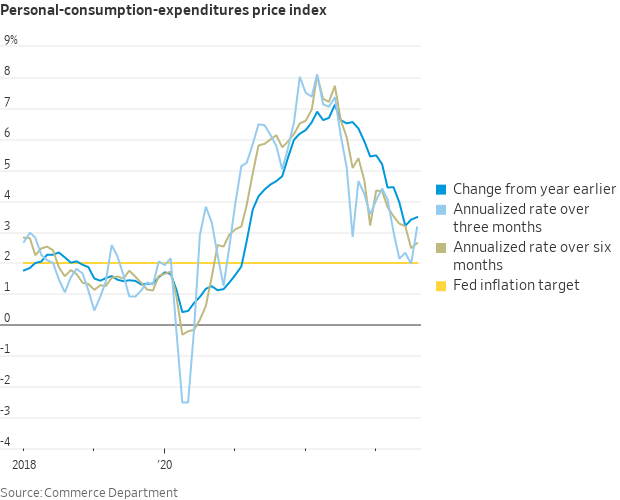
2 Likes

I=7

  • Core PCE rose by 2.8% y/y in March, above 2.7% estimate and 0.3% on a monthly basis as expected.
  • The headline PCE was up 2.7% on a yearly basis, above 2.6% estimate and 0.3% on a monthly basis as expected.
  • Real consumer spending was up 0.5% in March, higher-than 0.3% estimate.
  • Personal spending rose 0.8% on the month, higher-than 0.7% estimate while personal income was up 0.5% in-line with expectations.

https://www.bea.gov/sites/default/files/2024-04/pi0324.pdf

2 Likes

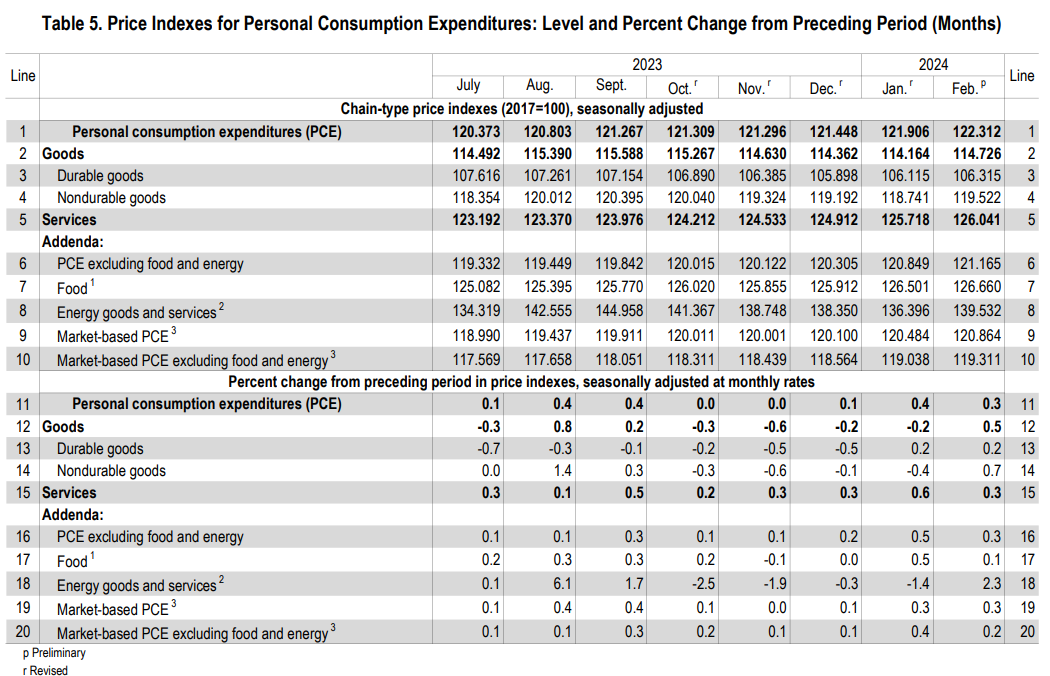
PCE data came in better than feared yesterday.
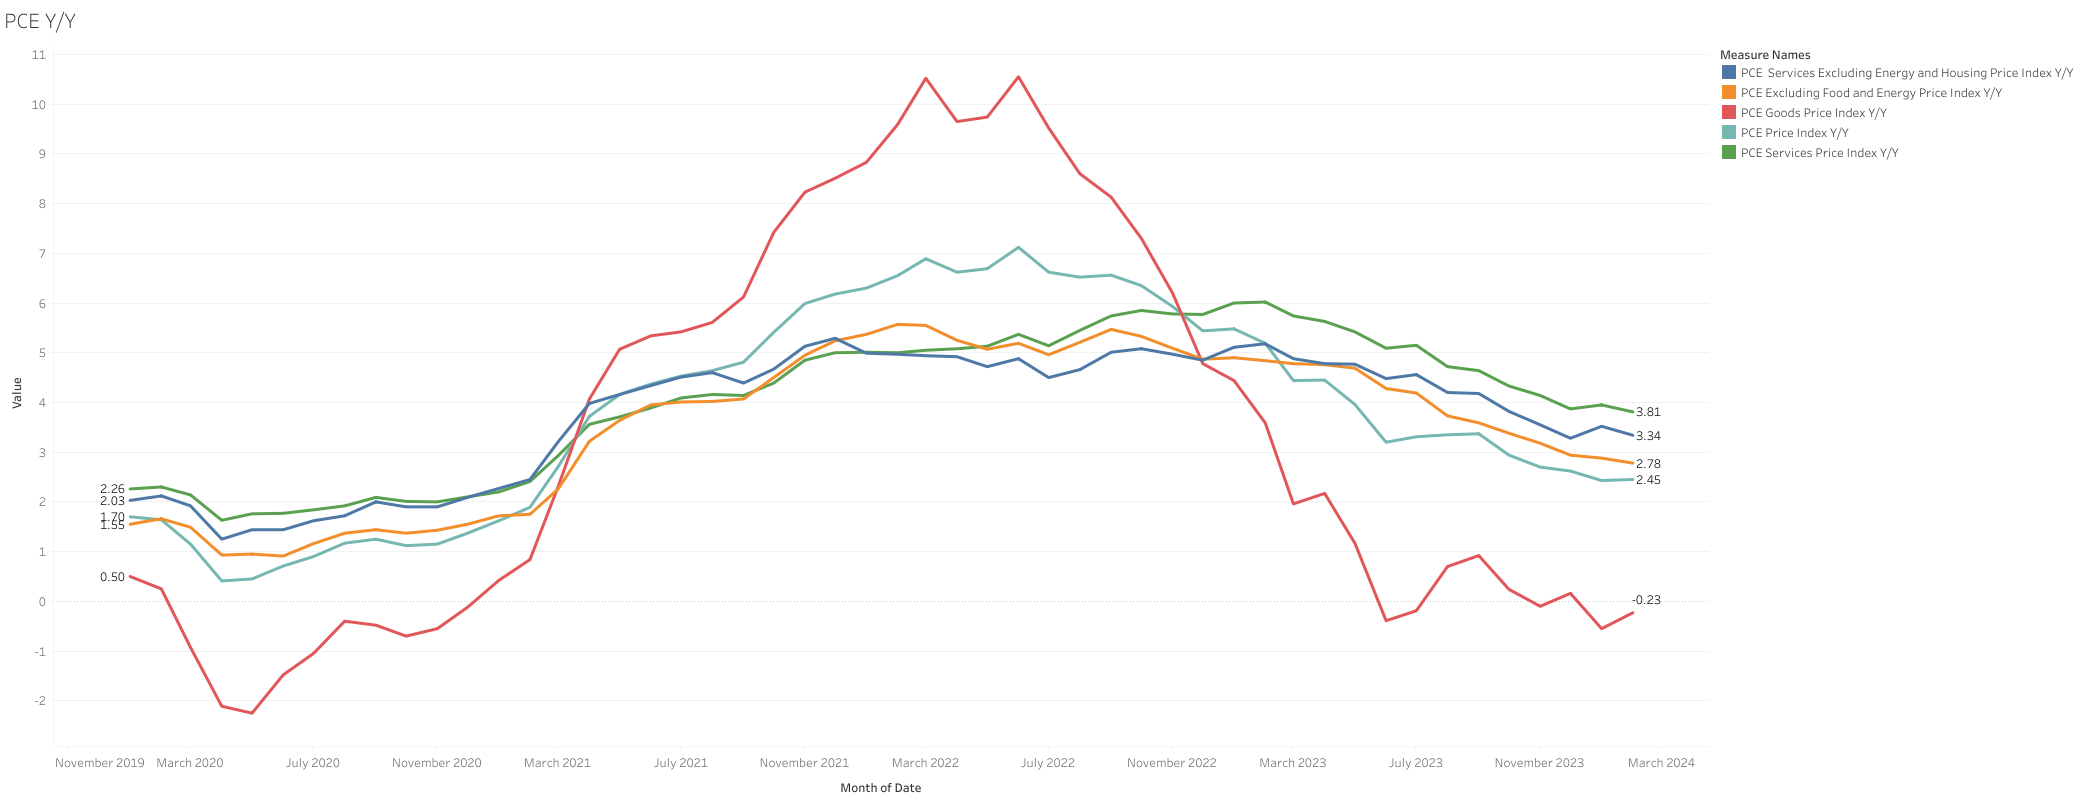
However, PCE is still showing an upward trend, especially in the last 3 months.

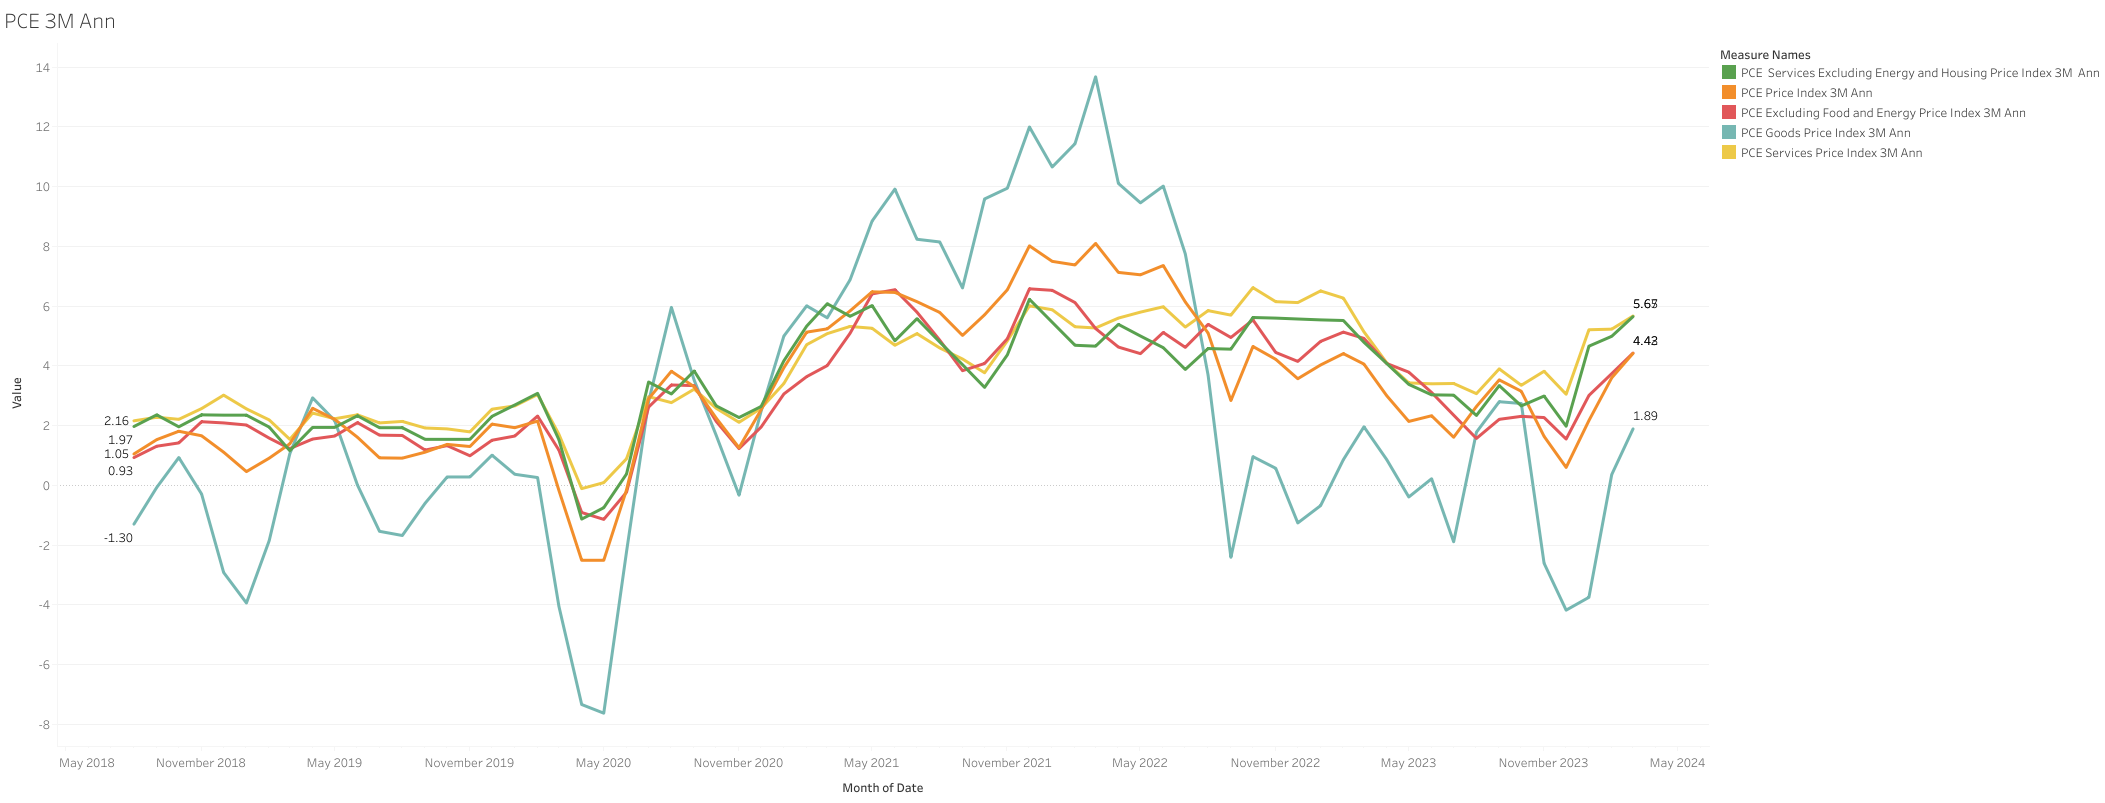
3M ann rates, in a clear uptrend, even goods inflation has had a significant rebound, but still low.

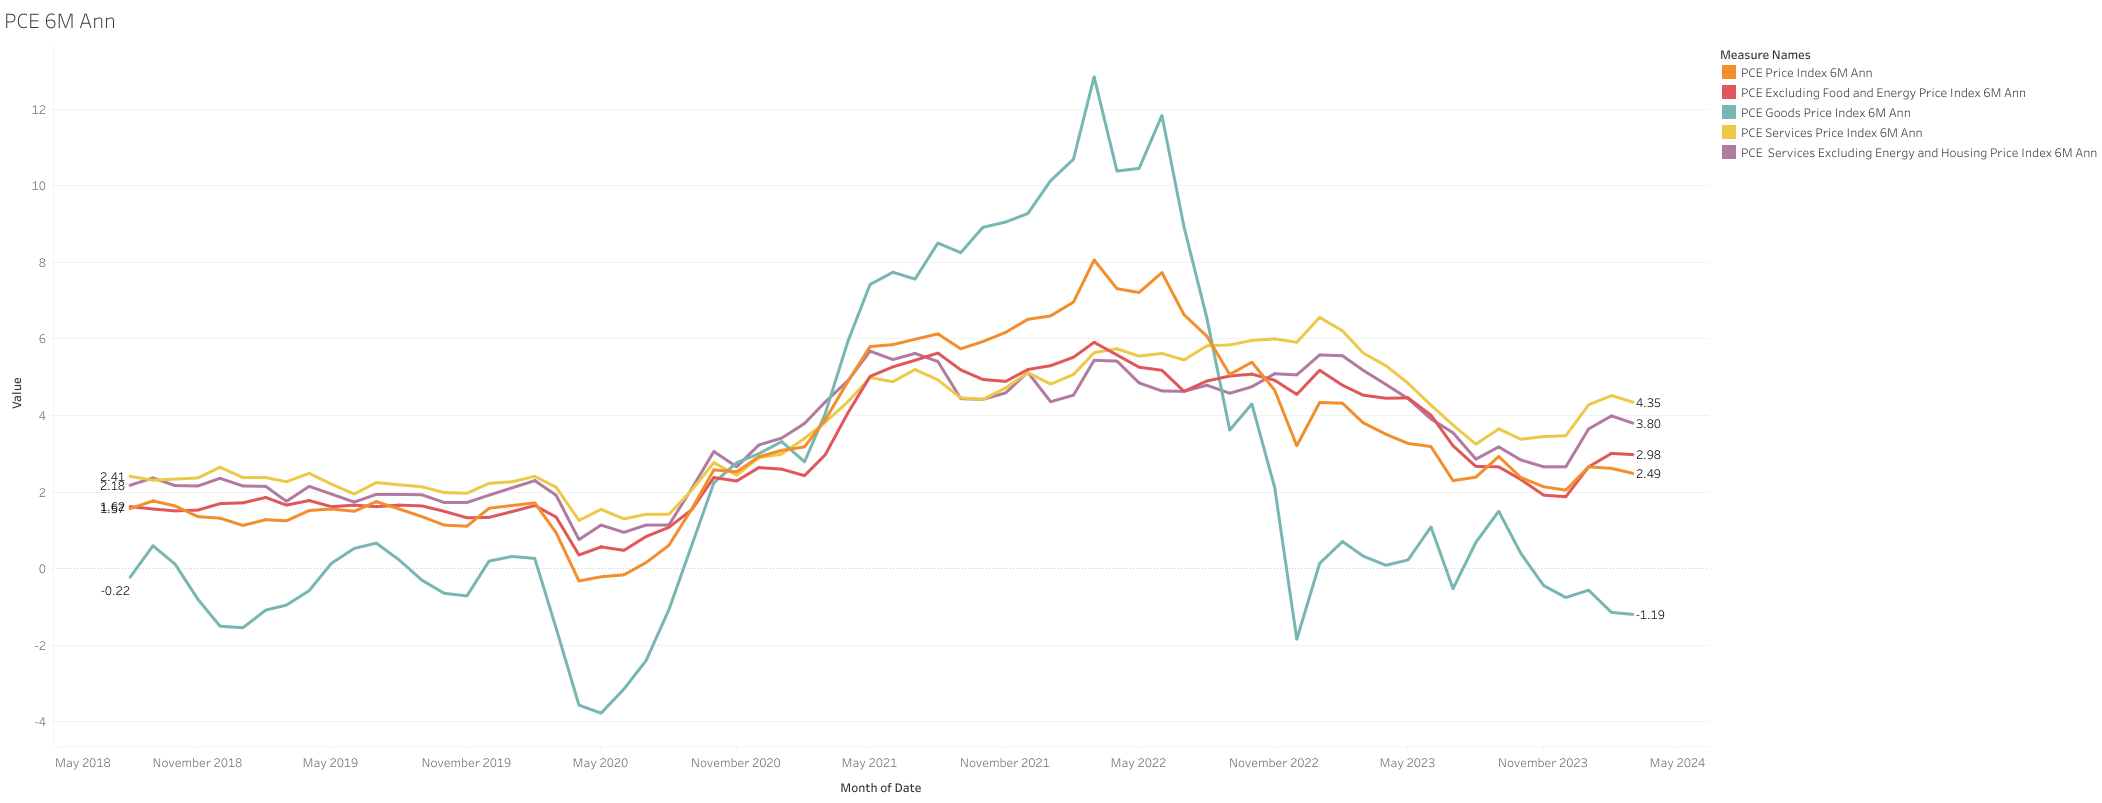
The 6m ann rates uptrend trend is still more muted, but services and super core services are still around ~4% 6m ann, a bit better than the prior month.

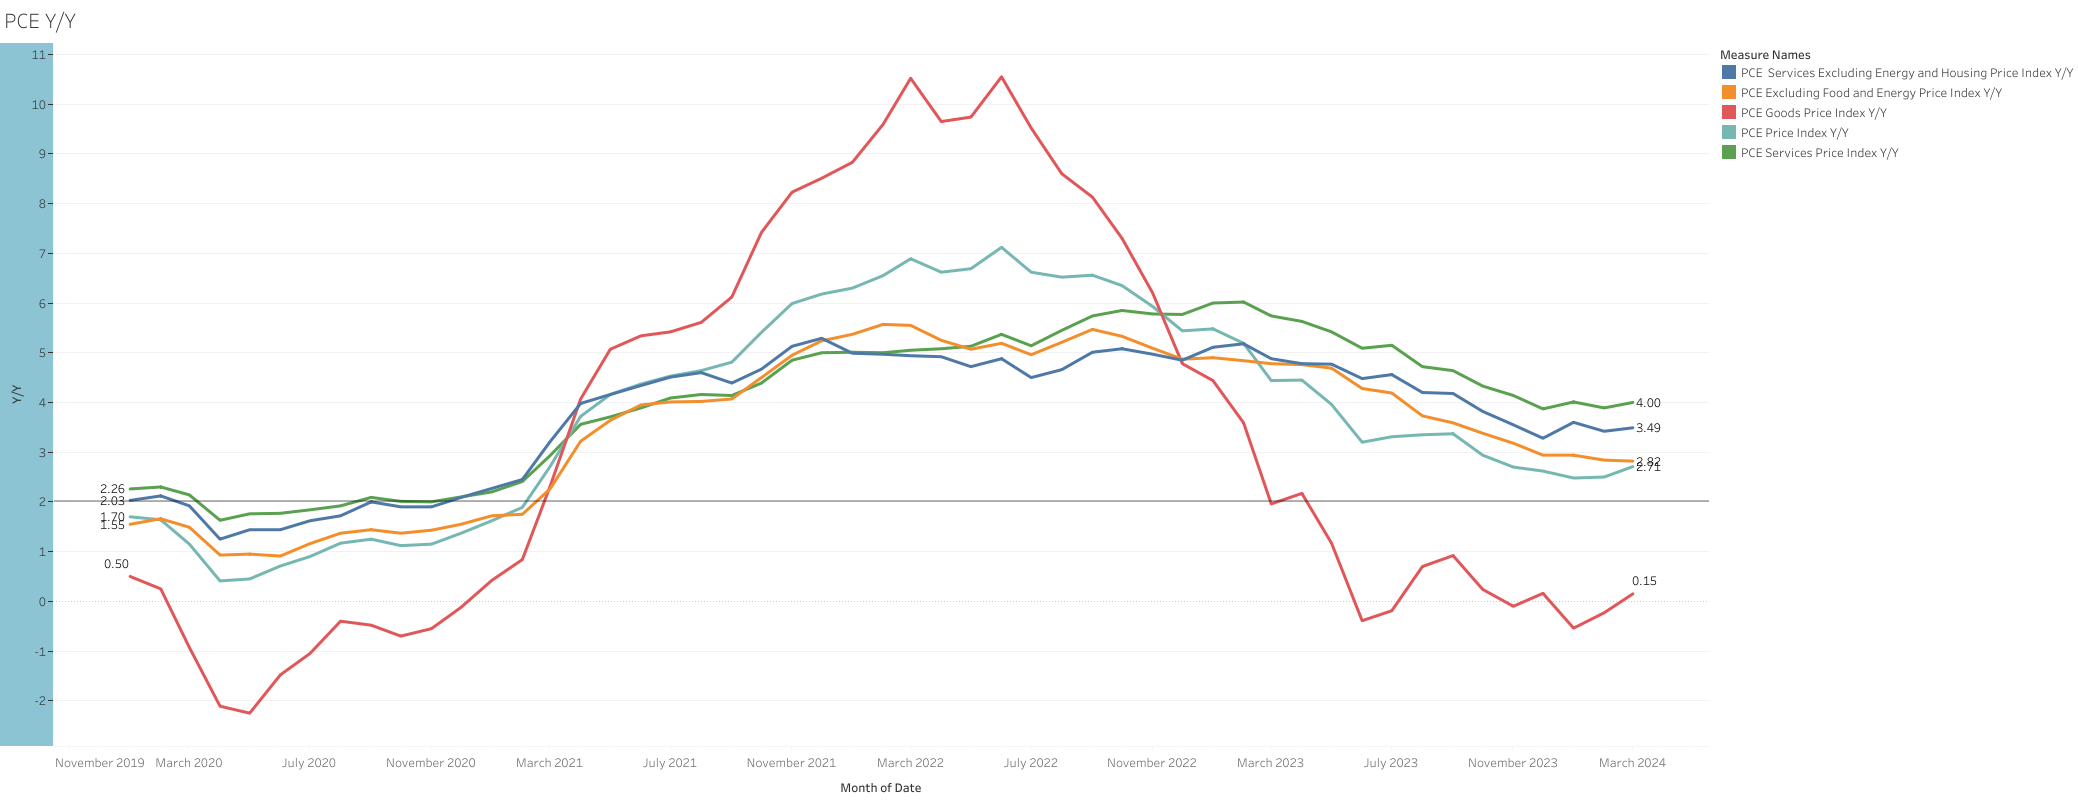
Y/Y measures show signs of bottoming at a higher level than the target.

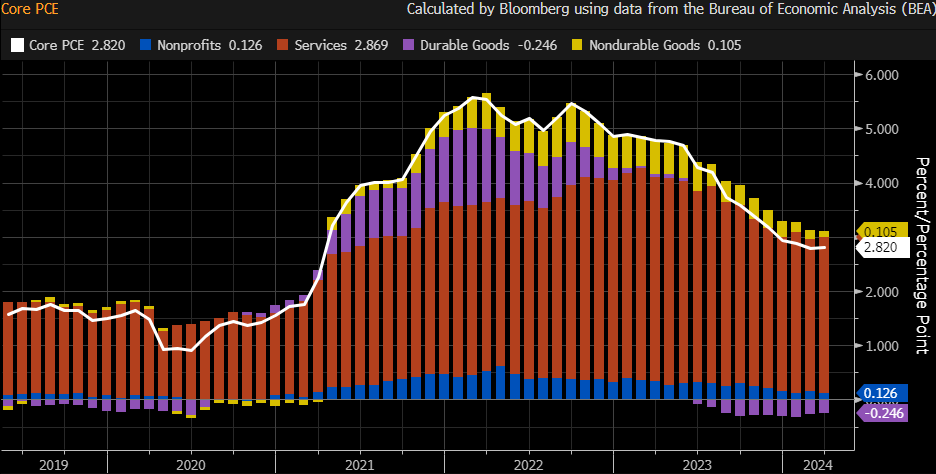
Contributions to PCE


Inflation data: US Economic Data - Google Sheets

1 Like

I=7

  • Core PCE rose 2.8% y/y in April and 0.2% on the month, both in-line with the estimates.
  • Headline PCE was up 2.7% on a yearly basis and 0.3% on a monthly basis, both in-line with the estimates as well.
  • Real consumer spending was down 0.1% against expectations for a 0.1% increase.
  • Personal income rose 0.3% on the month, in-line wit the estimate while personal spending was up 0.2%, below 0.4% estimate and lower-than 0.7% increase in March (revised downwards from 0.8%).
  • Stock futures were slightly up following the report- Dow futures rose 0.2% while S&P 500 and Nasdaq 100 added 0.3%.

https://www.bea.gov/sites/default/files/2024-05/pi0424.pdf

2 Likes