July 2024 Market Update
New Vehicle
July saw new-vehicle sales decrease 2.0% year over year and decrease 3.0% month over month despite having the same number of selling days as July 2023.
- The July seasonally adjusted annual rate (SAAR) was 15.8 million, down 0.8% from the previous year.
- The July SAAR was up 4.2% from June’s downwardly revised 15.2 million, which was impacted by the CDK software disruption. At this point it appears that July did not see a full recovery of the disrupted/lost sales in June.
- The SAAR year to date remains 15.5 million, which was the total for last year, but YTD last year as of July was 15.4 million.
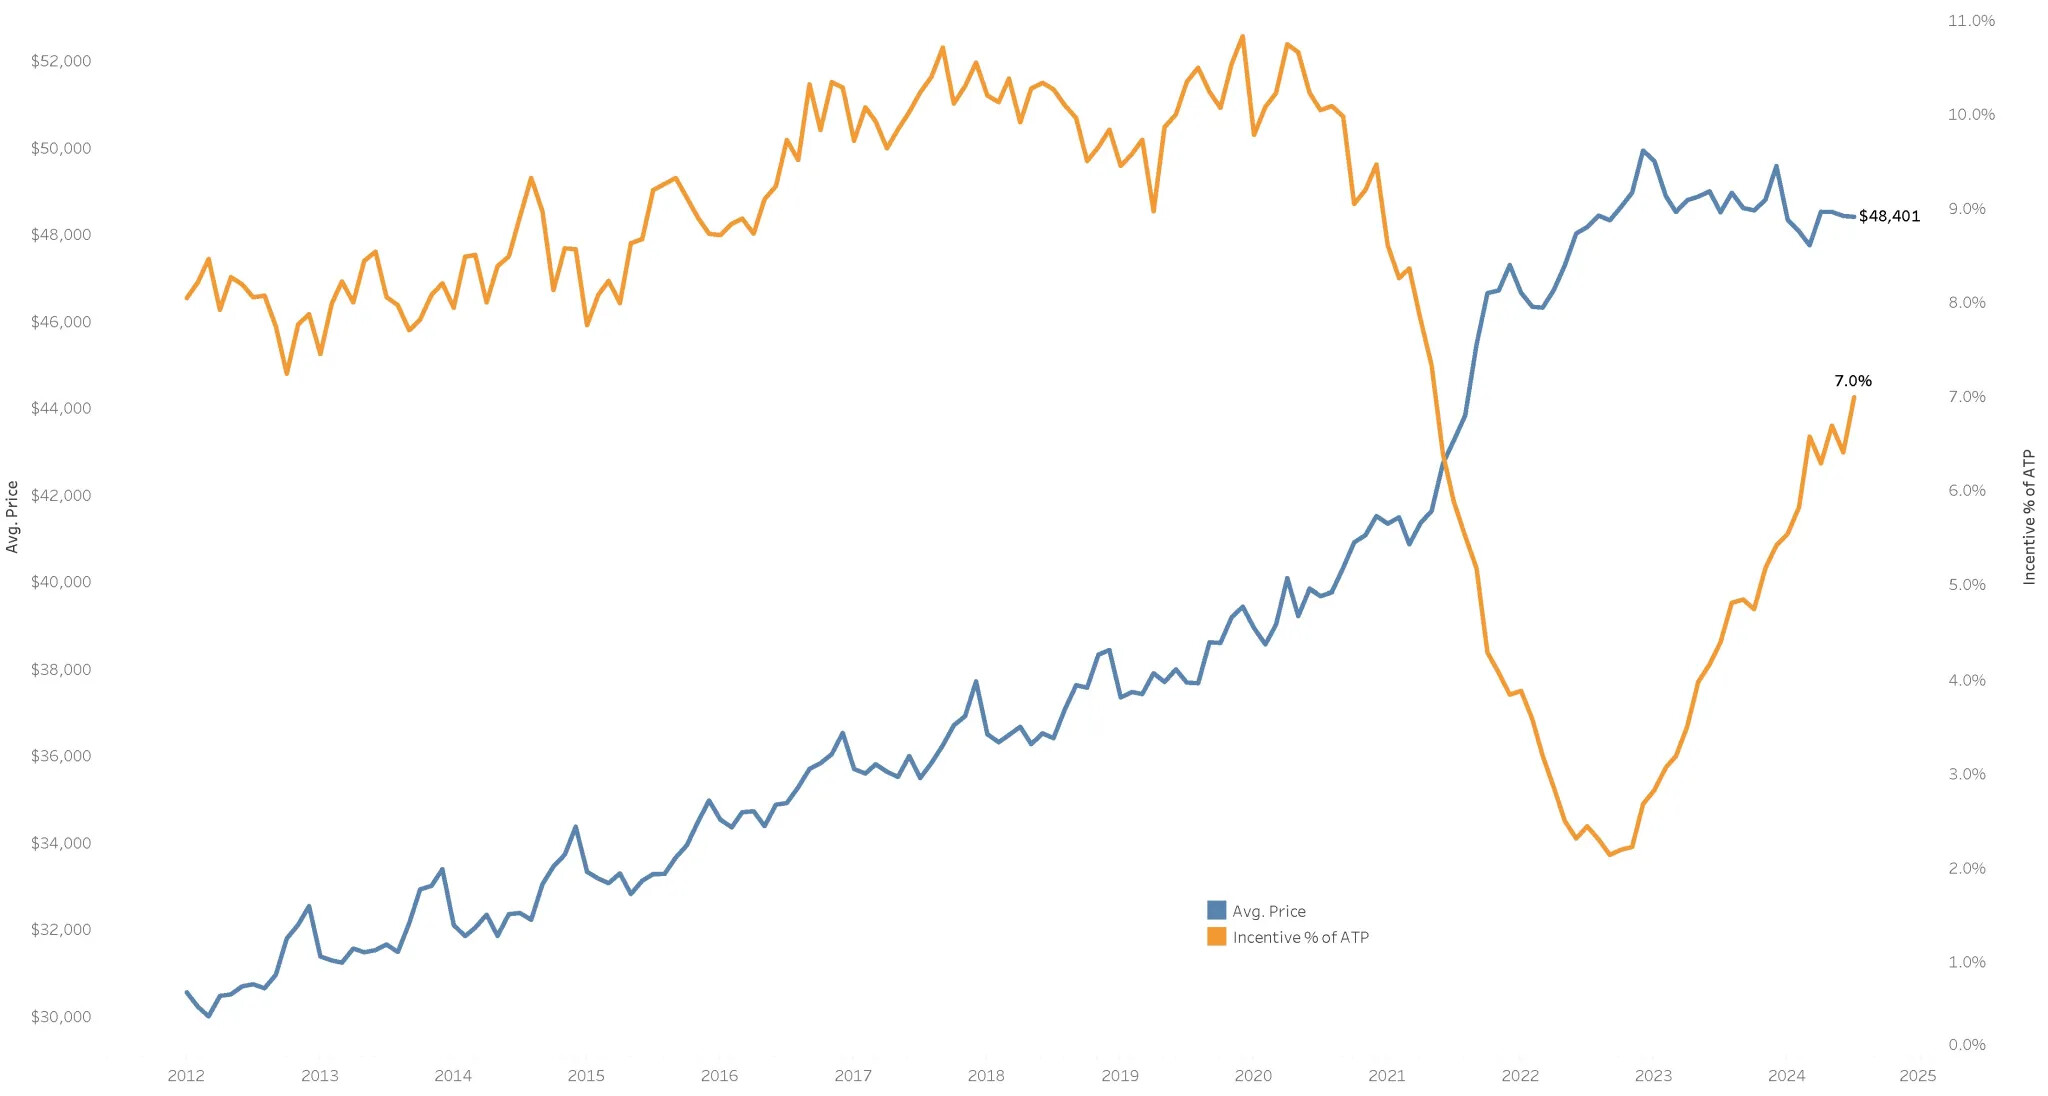
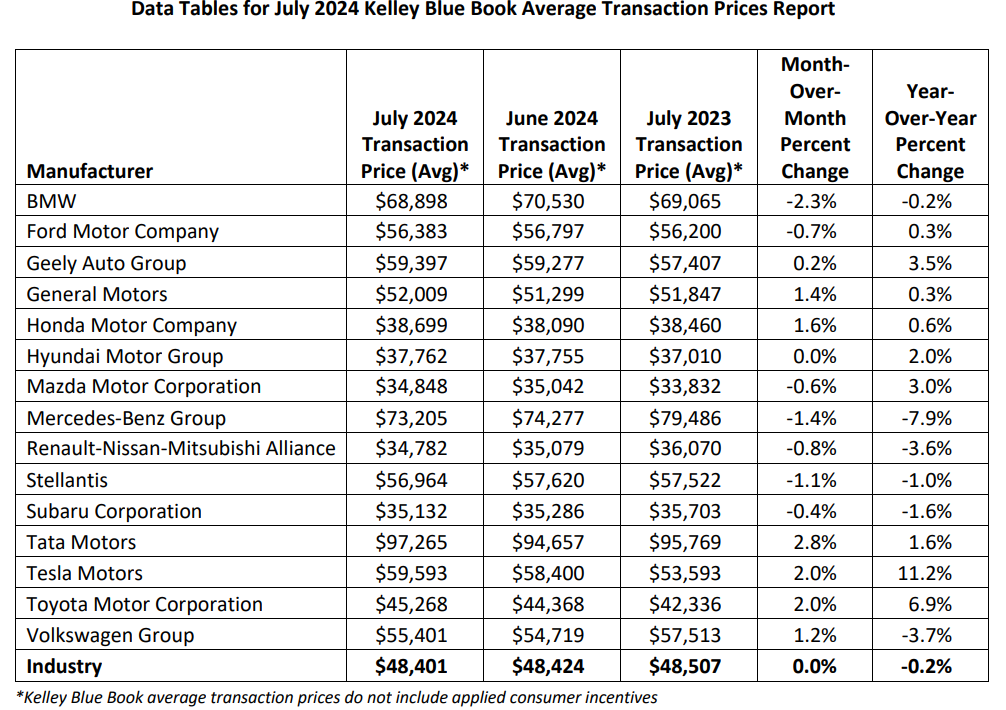
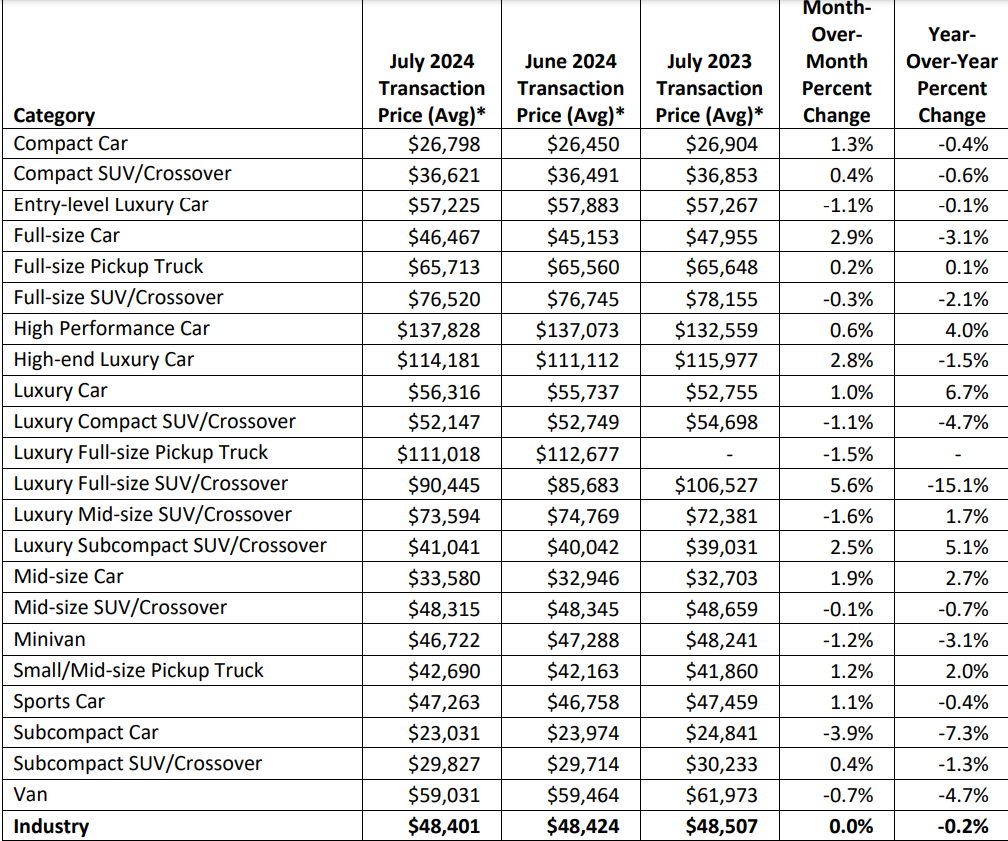
The average transaction price (ATP) for a new vehicle in the U.S. was $48,401.
- New-vehicle prices in July were mostly unchanged from the revised-lower June ATP of $48,424 (lower by $23) and last year ($106).
- New-vehicle ATPs were lower in July by 3.1% from the peak in December 2022 at $49,929
- Average incentives in July rose to 7.0% of the average transaction price – $3,383 – up from 6.4% in June and the most generous level seen in 2024
- The average transaction price for an EV in July, at $56,520, was higher than in June but lower year over year by 1.5%.
Used Vehicle
- Retail used-vehicle sales in July increased from June, rising by 27.6% month over month. A total of 1.6 million used vehicles were sold at retail – from both franchised and independent dealers – during July, up 16.5% year over year.
- Days’ supply for July was 41, down from a revised 53 days in June.
Prices
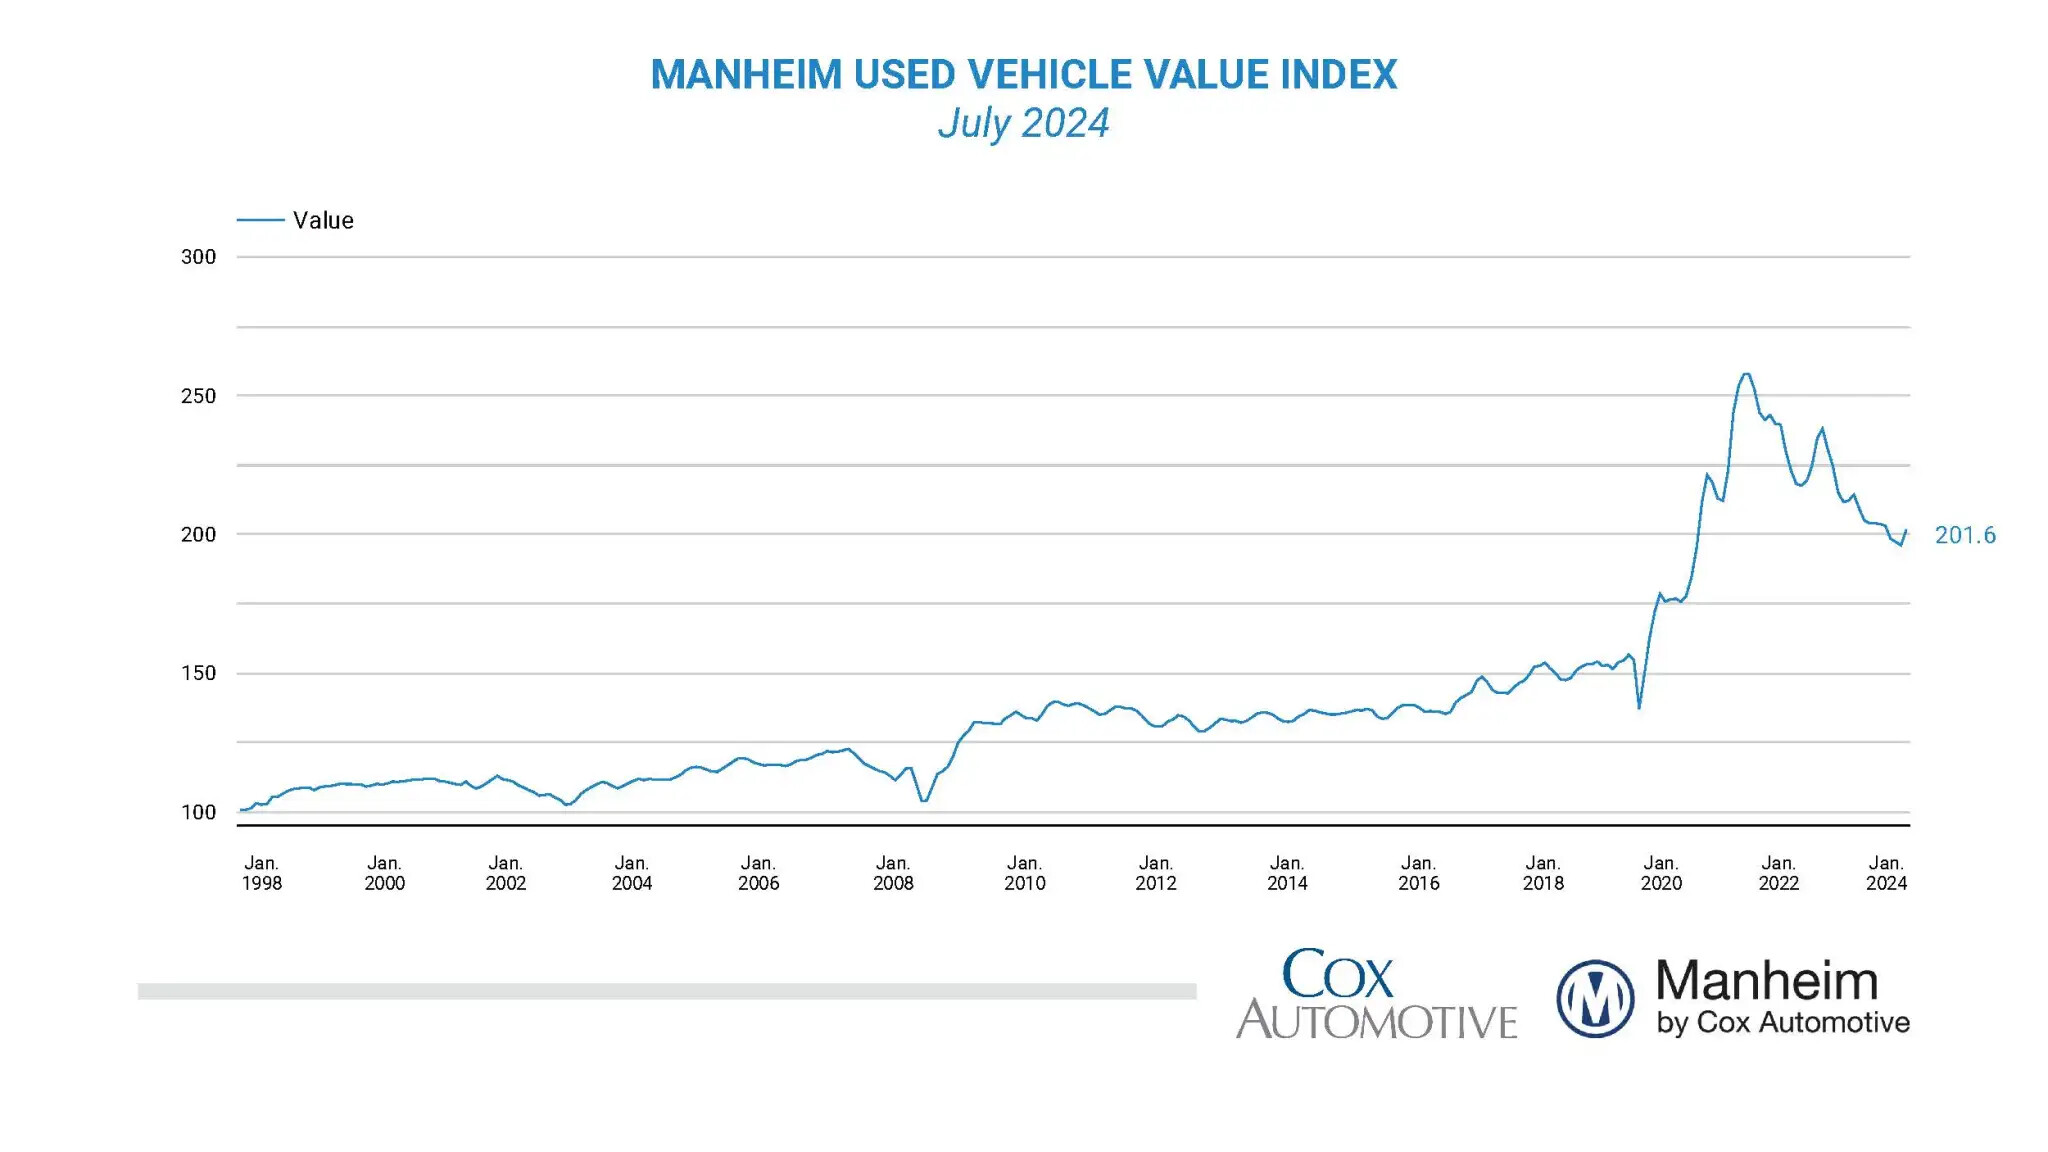
The Manheim Used Vehicle Value Index (MUVVI) rose to 201.6, a decline of 4.8% from a year ago.
- Values that rose 2.8% month over month.
- Over the last four weeks, the Three-Year-Old Index increased an aggregate of 1.1%, including a rise of 0.5% in the last week of the month.