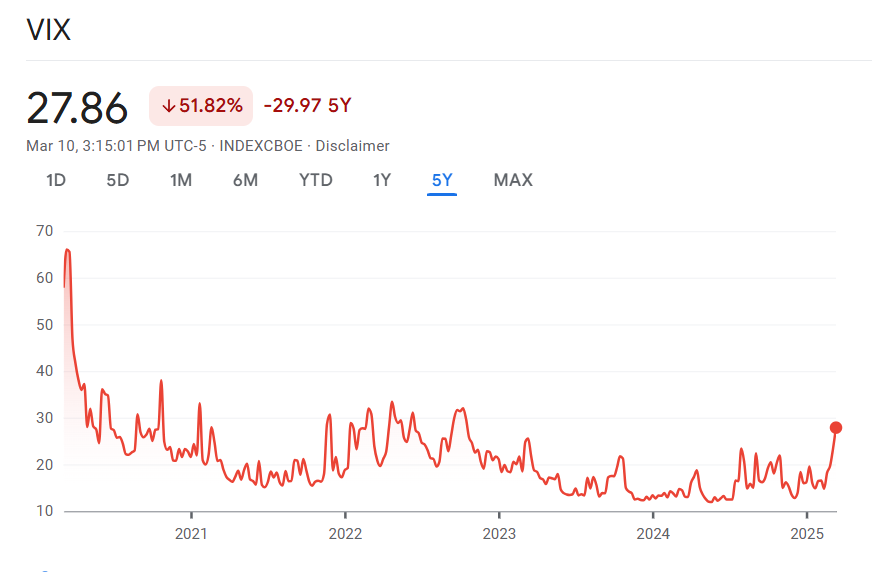
The VIX (CBOE Volatility Index) is a real-time measure of the expected volatility of the S&P 500 over the next 30 days. It is often referred to as the “fear gauge” because it reflects market uncertainty and investor sentiment. The VIX is calculated using S&P 500 index options (both calls and puts) and represents the market’s expectations of volatility, not actual past volatility.
Why is the VIX Important
- Market Sentiment Indicator
- A rising VIX suggests increasing fear and uncertainty in the market.
- A falling VIX indicates confidence and stability.
- Portfolio Hedging & Risk Management
- Investors use the VIX to hedge portfolios against downturns.
- A high VIX may signal a good time to reduce exposure to risk assets.
- Macro and Liquidity Insights
- Extreme VIX levels (high or low) can reflect broader macroeconomic concerns, such as central bank policy shifts or geopolitical tensions.
- A persistently low VIX could signal complacency, making markets vulnerable to sudden shocks.
- Correlation with Market Movements
- The VIX generally moves inversely to the S&P 500.
- When stocks sell off, volatility usually rises, pushing the VIX higher.
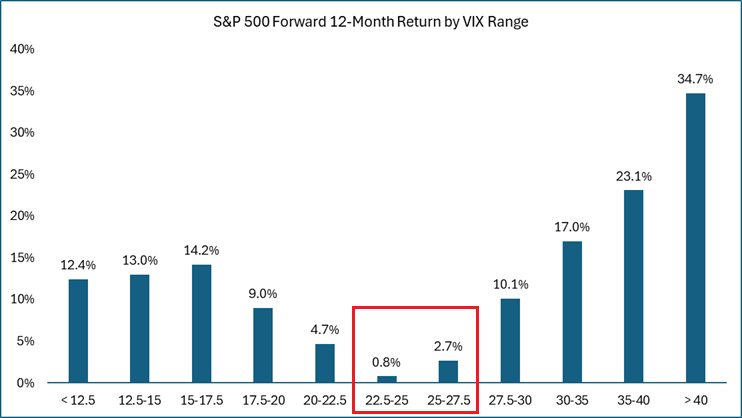
- A high VIX does not necessarily mean a continued downtrend, as extreme VIX spikes often signal market bottoms.
What Do VIX Movements Signal
1. Low VIX (<15) – Complacency & Risk-On Environment
- Market optimism and stable conditions.
- Investors expect low volatility and strong economic performance.
- Risk assets (stocks, high-yield bonds) tend to perform well.
- Potential risk: Overconfidence could lead to a sudden market correction if unexpected bad news arises.
2. Moderate VIX (15-25) – Normal Volatility
- Typical market environment where stocks move up or down within normal ranges.
- Healthy levels of risk-taking and market uncertainty.
3. High VIX (>25) – Fear & Uncertainty
- Indicates market stress, uncertainty, or crisis.
- Often seen during financial crashes, recessions, or geopolitical events.
- Investors hedge aggressively, leading to higher options premiums.
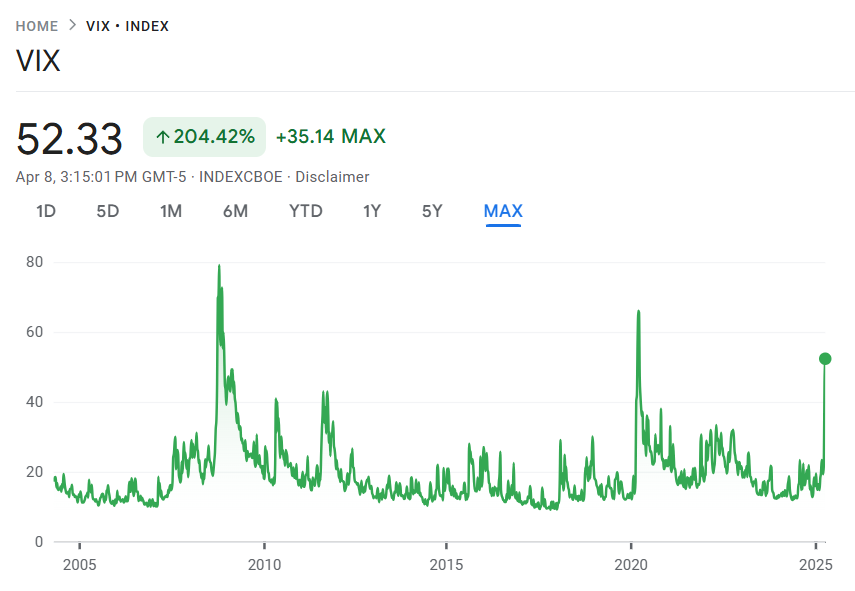
4. Extreme VIX Spikes (>40) – Market Panic & Capitulation
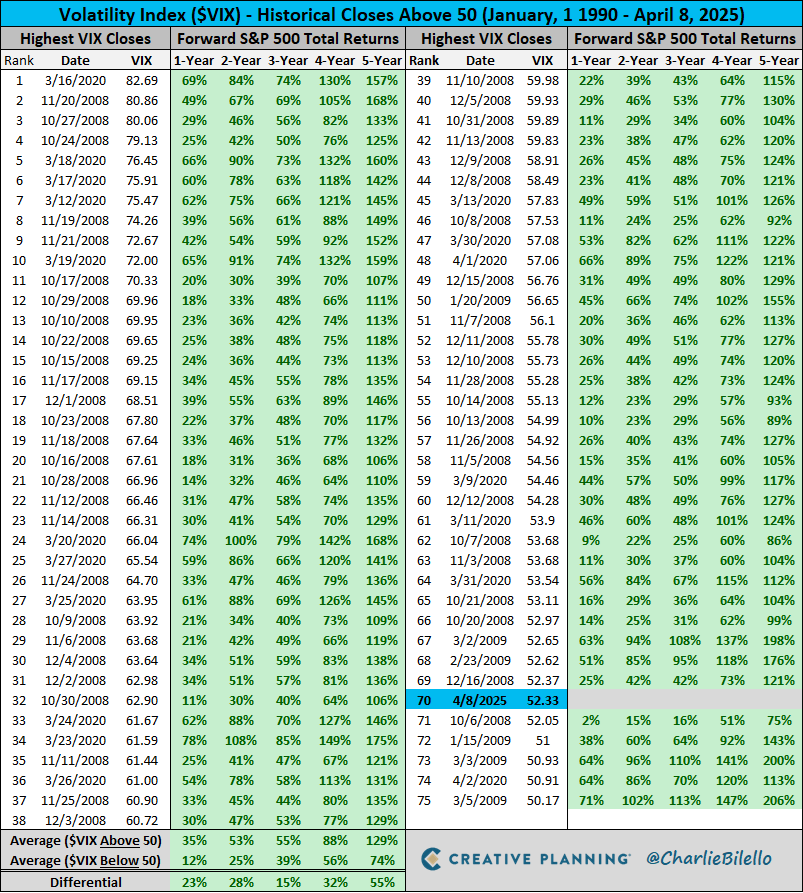
- Historically signals potential market bottoms (e.g., 2008 Financial Crisis, March 2020 COVID crash).
- Investors rush to hedge or liquidate positions, leading to oversold conditions.
- Contrarian investors may see this as a buying opportunity.
How to Use the VIX for Investing
- Contrarian Indicator:
- Extremely high VIX levels may suggest buying opportunities.
- Extremely low VIX levels may suggest overbought conditions.
- Options Trading & Hedging:
- Traders use VIX futures, options, and ETFs to hedge portfolios.
- A rising VIX benefits volatility-related instruments.
- Macro & Interest Rate Analysis:
- Rising VIX alongside rising bond yields may signal liquidity stress.
- A falling VIX with low bond yields suggests a stable, low-volatility regime.
Notion Page: