Main Article: Corporate Profits - InvestmentWiki
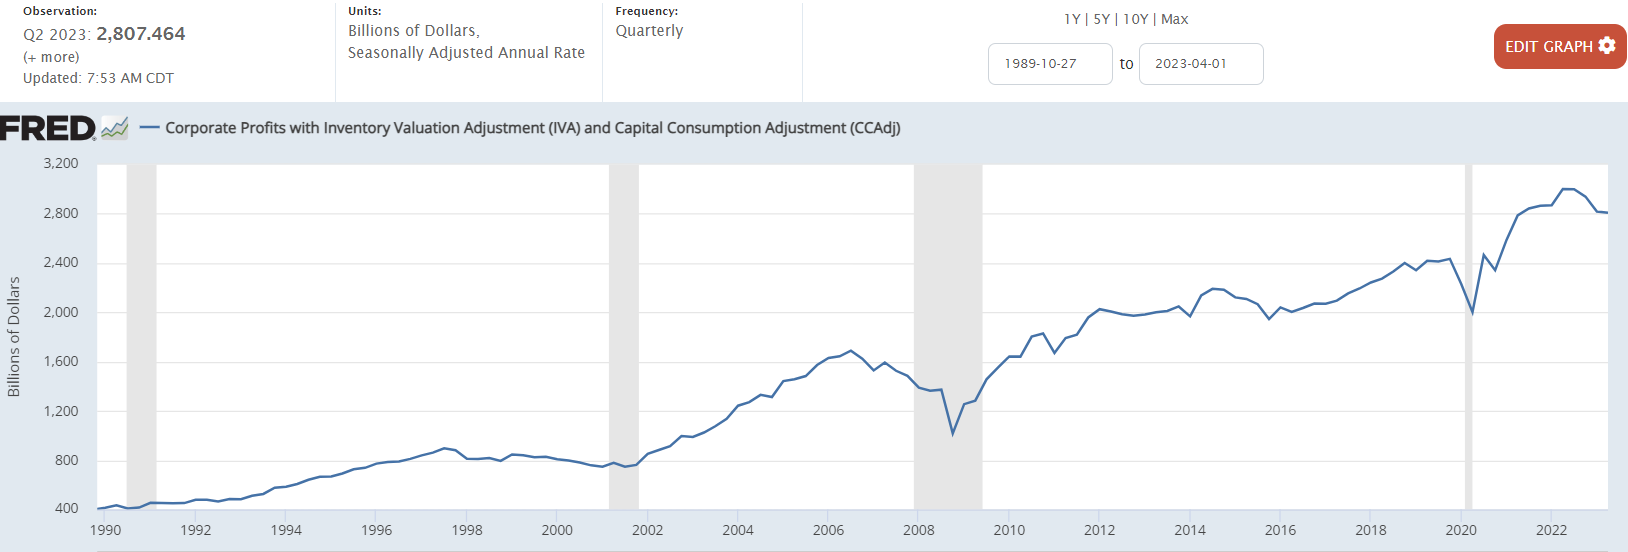
Q2 2023 profits before tax decreased 11B from Q1, a -0.38% Q/Q, and a -6.5 Y/Y. Profits after tax increased 68B from Q1 or a 1.63% Q/Q and declined -6.2% Y/Y.
*This are preliminary results, and can be revised later
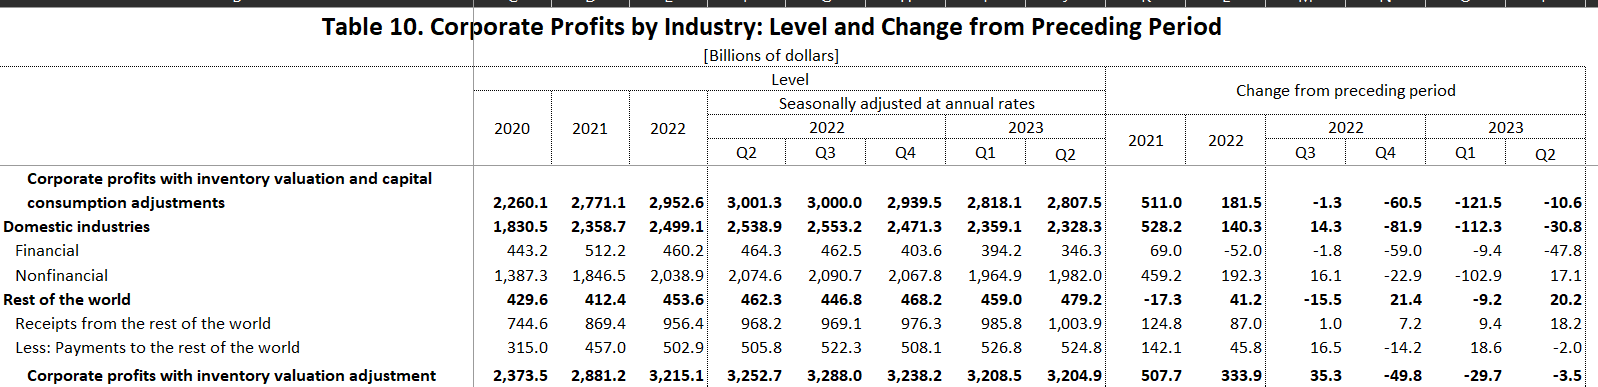
- Profits of domestic financial corporations decreased $47.8 billion in the second quarter, compared with a decrease of $9.4 billion in the first quarter.
- Profits of domestic nonfinancial corporations increased $17.1 billion in the second quarter, in contrast to a decrease of $102.9 billion in the first quarter.
- Rest-of-the-world profits increased $20.2 billion in the second quarter, in contrast to a decrease of $9.2 billion in the first quarter. In the second quarter, receipts increased $18.2 billion and payments decreased $2.0 billion.
https://www.bea.gov/news/2023/gross-domestic-product-second-quarter-2023-second-estimate-and-corporate-profits
1 Like
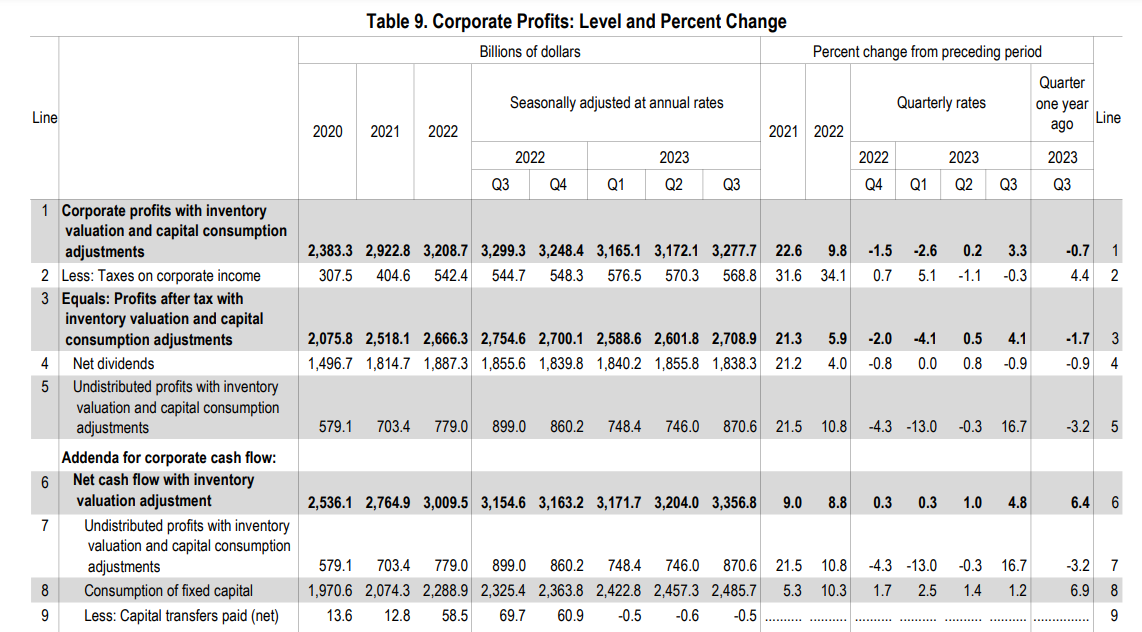
Profits from current production increased by $105.7 billion in the third quarter (3.3% q/q and -0.7y/y) to 3,278 Billion, compared with an increase of $6.9 billion in the second quarter.
Profits after tax increased $107 billion to $2,709 billion (4.1% q/q and -1.7 y/y)
*This is a preliminary figure.
- Profits of domestic financial corporations increased $18.8 billion in the third quarter to $462 Billion, in contrast to a decrease of $54.2 billion in the second quarter.
- Profits of domestic nonfinancial corporations increased $76.2 billion to $2,291 Billion, compared with an increase of $39.0 billion.
- Rest-of-the-world profits increased $10.7 billion to $525 Billion, compared with an increase of $22.1 billion.
https://www.bea.gov/sites/default/files/2023-11/gdp3q23_2nd.pdf
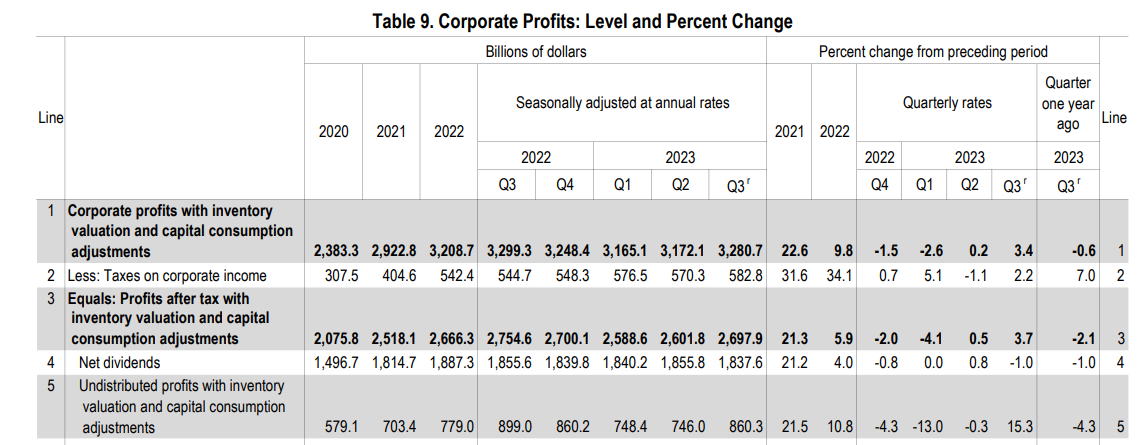
Corporate Profits for Q3 had a small revision up.
Profits from current production (corporate profits with inventory valuation and capital consumption adjustments) increased $108.7 billion in the third quarter, an upward revision of $3.0 billion from the previous estimate.
This means a 3.4% Q/Q and a -0.6% Y/Y
https://www.bea.gov/sites/default/files/2023-12/gdp3q23_3rd.pdf
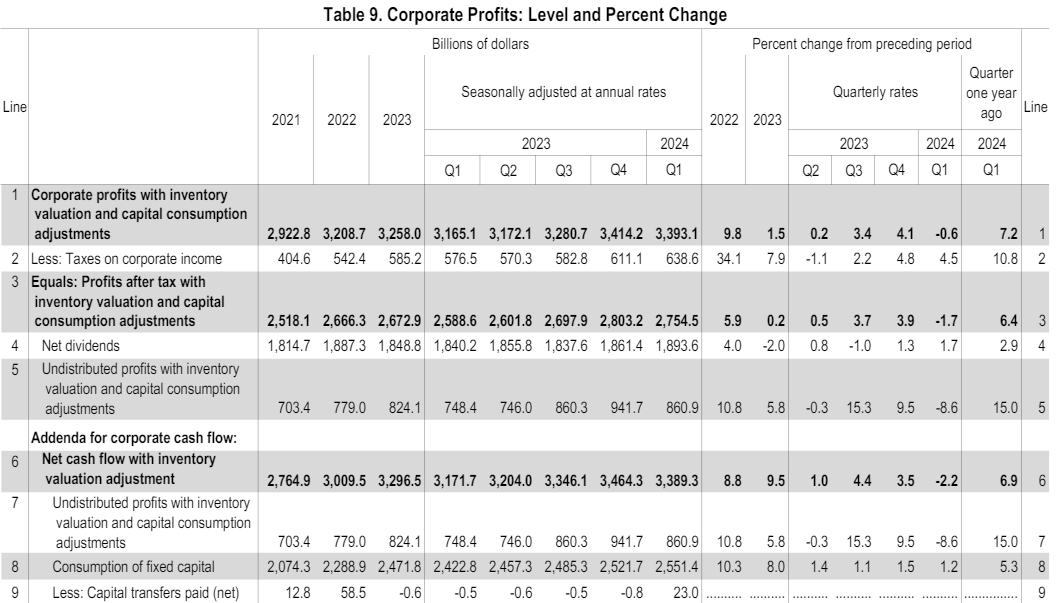
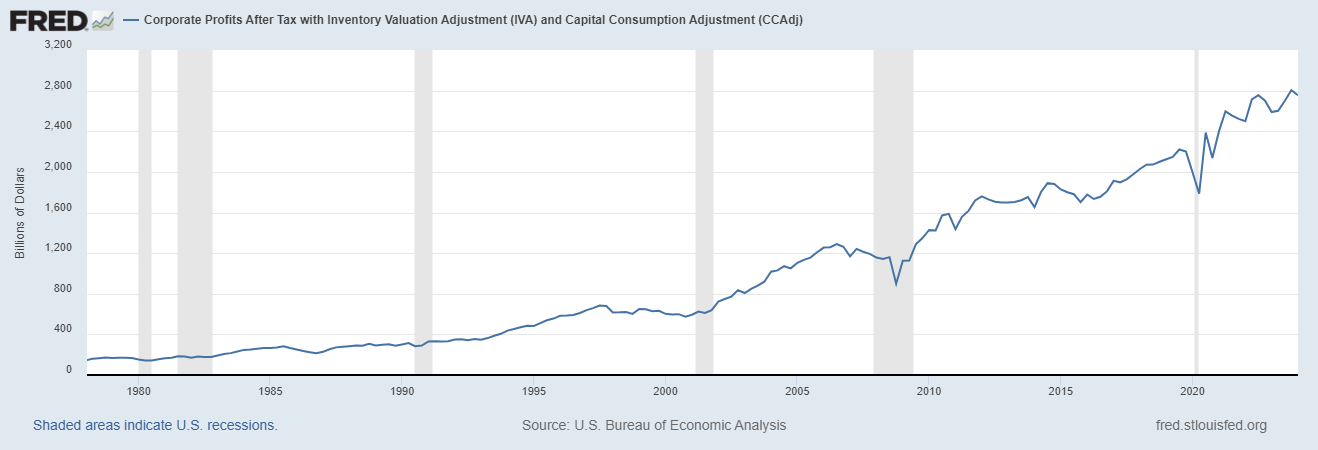
Corporate profits according to BEA declined in Q1 2024 but remained near record highs and above the trend before COVID-19.
- Profits after tax declined 21B, an -1.7% Q/Q (6.4% Y/Y)
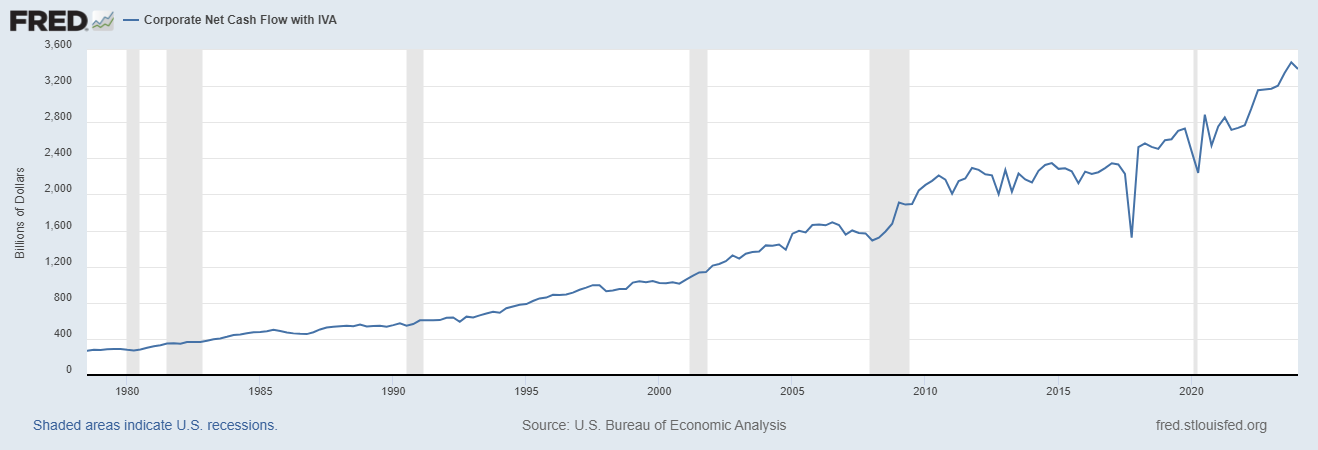
- Net cash flow declined 75B, a -2.2% Y/Y (6.9% Y/Y).
- Profits of domestic financial corporations increased $73.7 billion in the first quarter, compared with an increase of $5.9 billion in the fourth quarter. Profits of domestic nonfinancial corporations decreased $114.1 billion, in contrast to an increase of $136.5 billion. Rest-of-the-world profits increased $19.3 billion, in contrast to a decrease of $8.9 billion
https://www.bea.gov/sites/default/files/2024-05/gdp1q24-2nd.pdf
1 Like
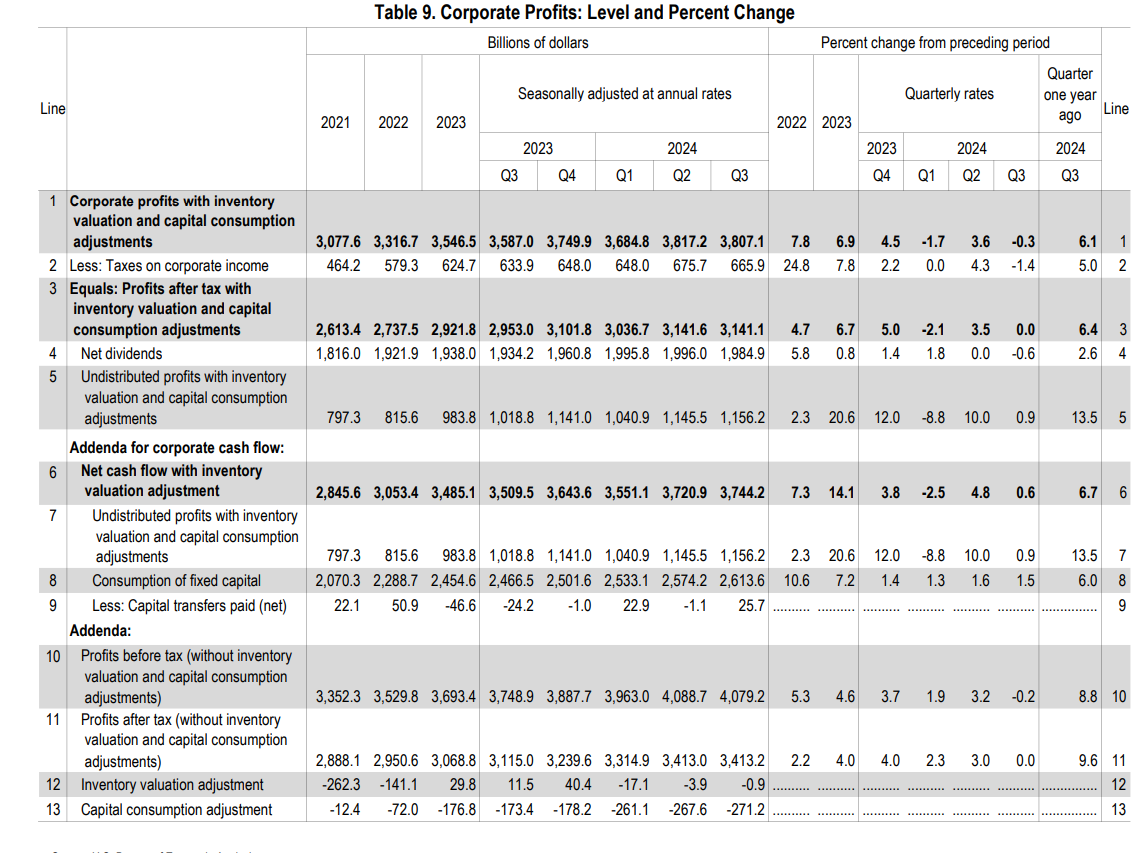
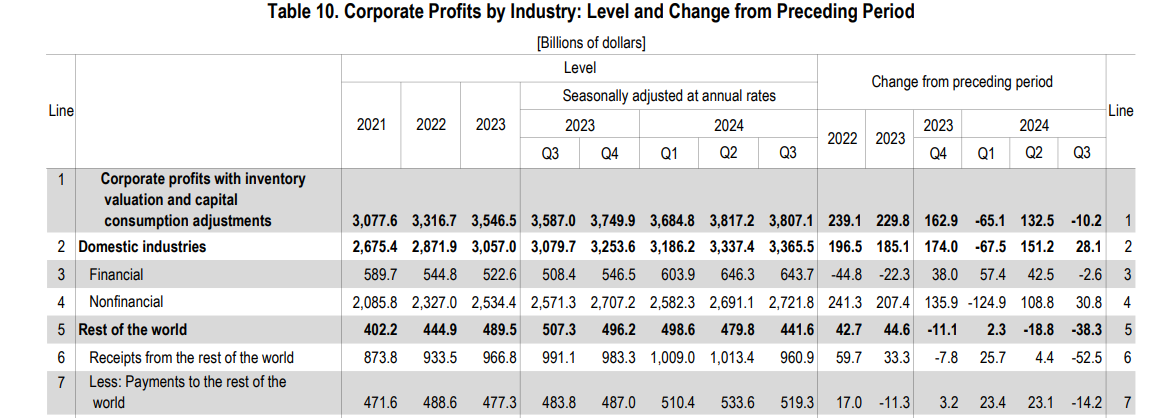
US corporate Profits were essentially flat q/q in Q3 2024, and 6.4% Y/Y
- Net cash flow at 3.7 trillion, 0.6% q/q and 6.7% y/y