Solana Developments that could provide an overview of its cycle and adoption
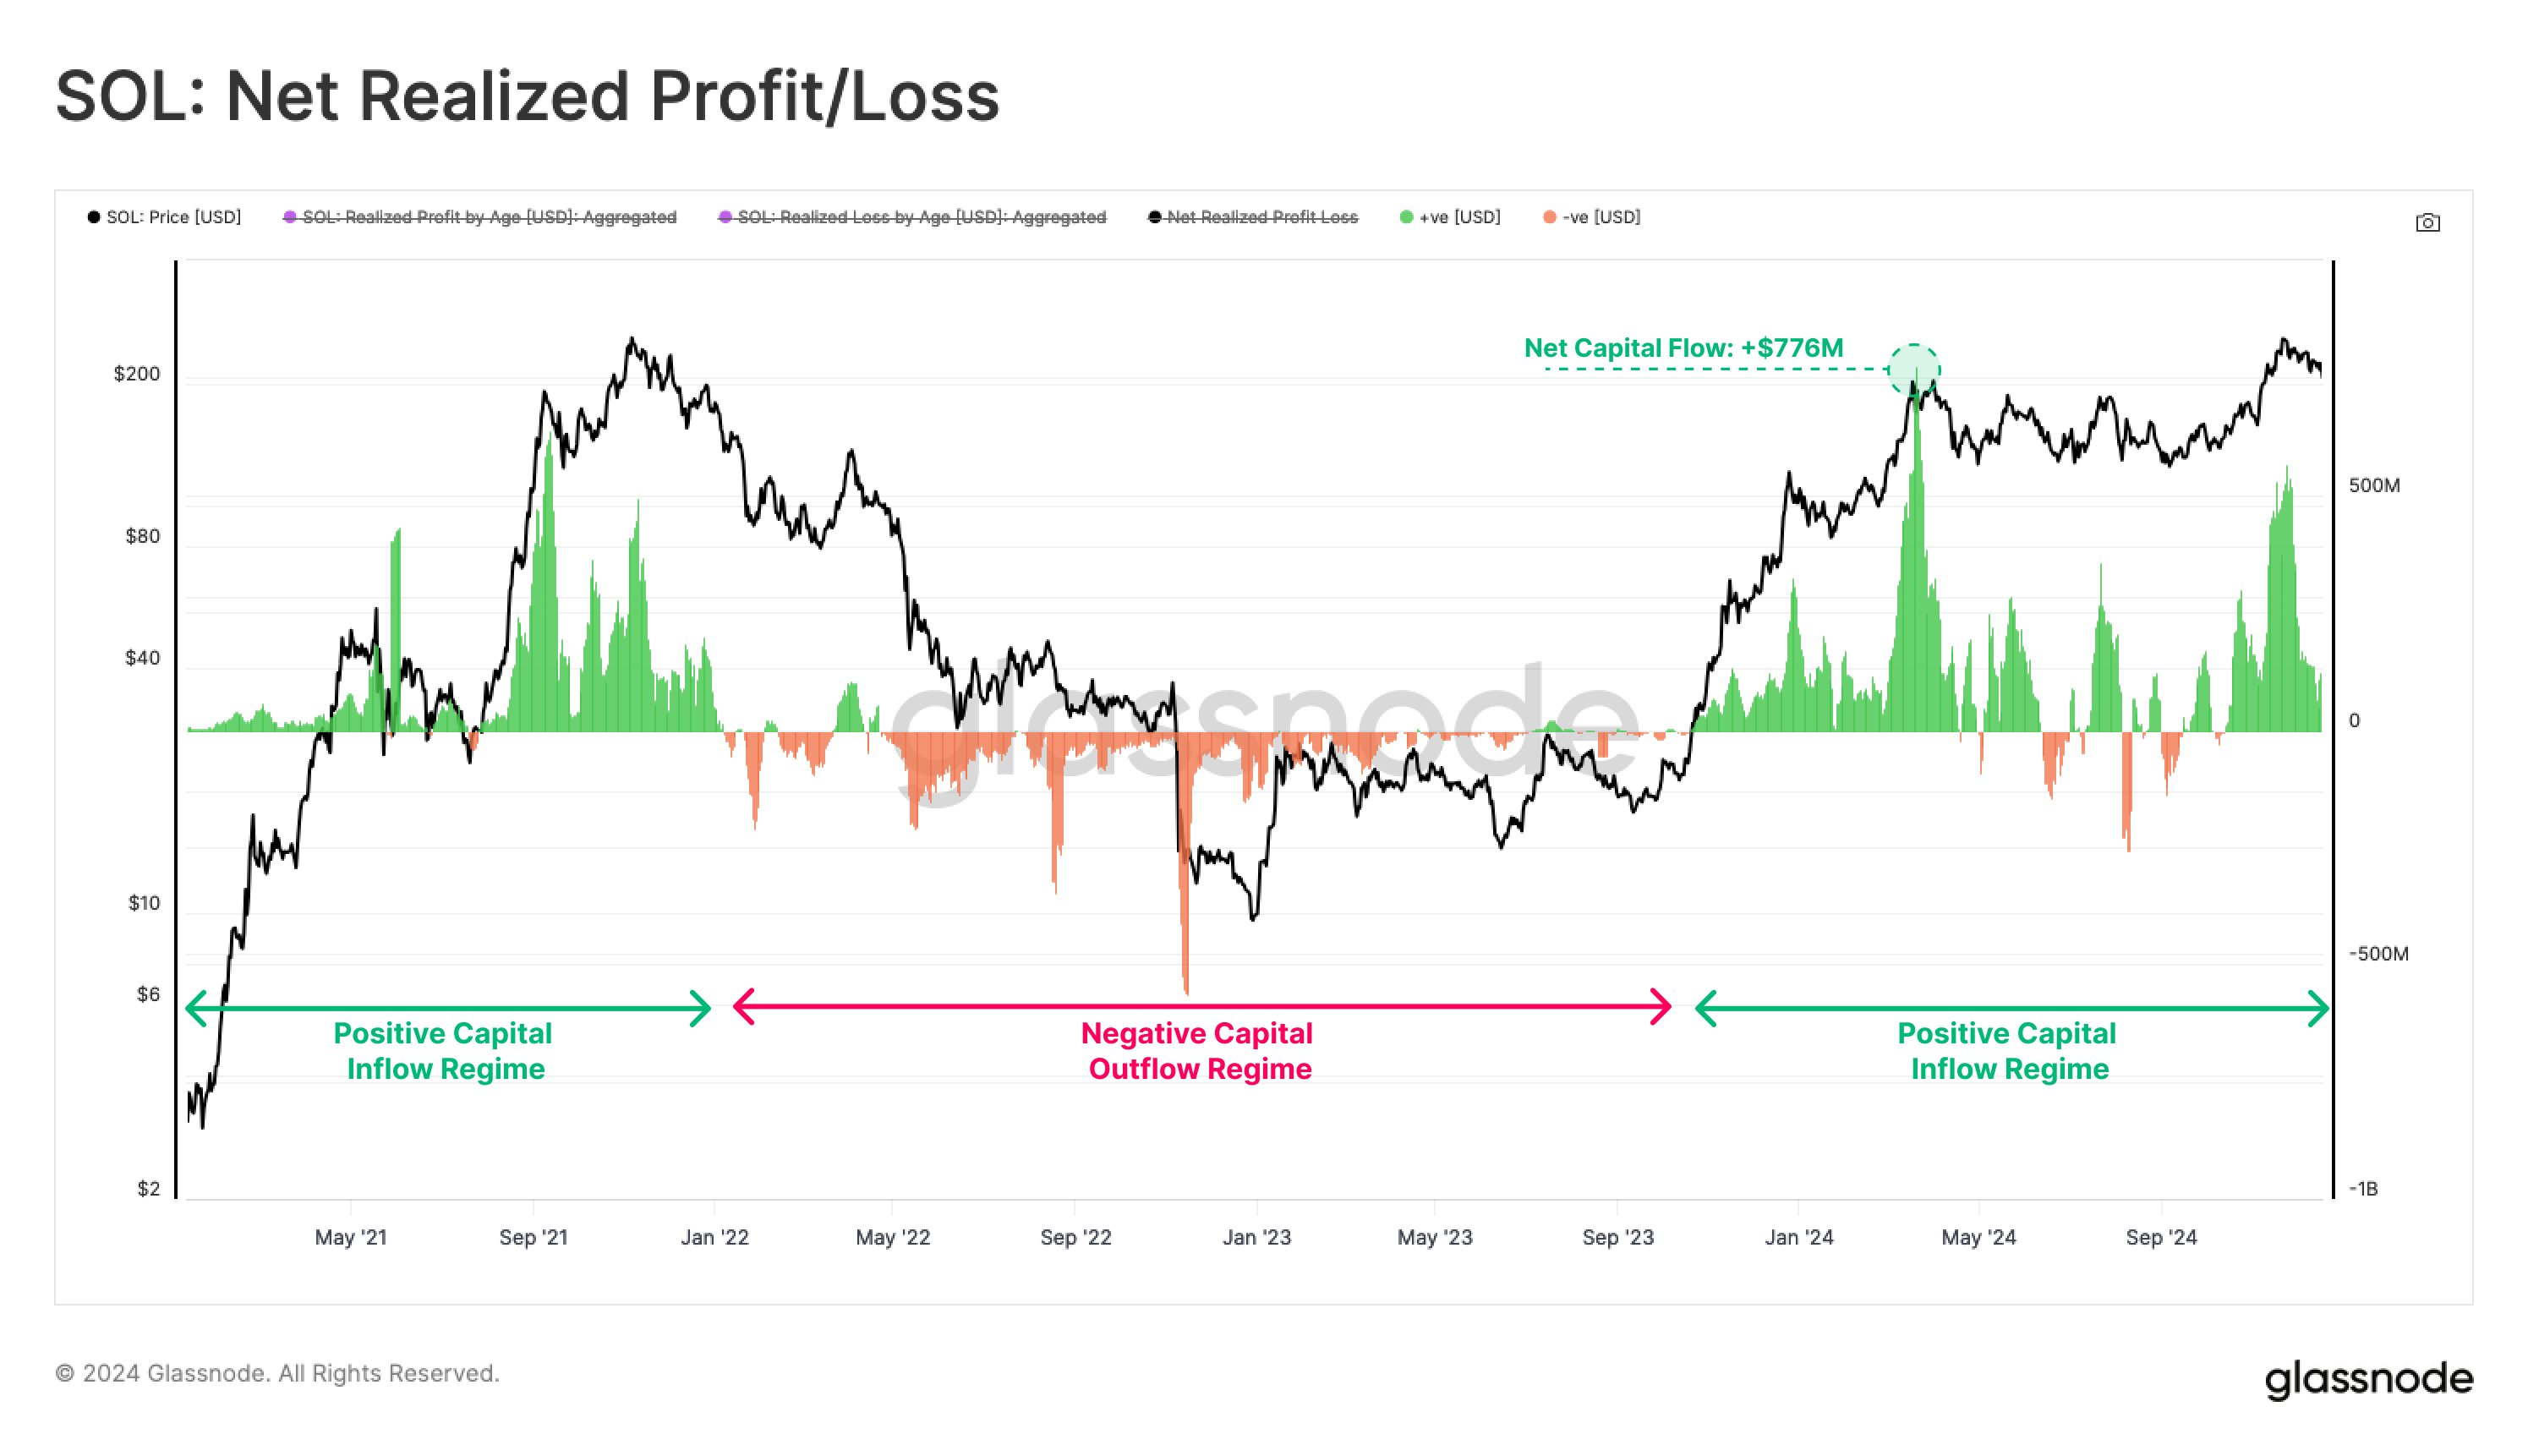
Solana positive capital inflows has resulted in a net liquidity increase of +$55B, providing significant tailwinds for price appreciation
- Solana has outperformed both Bitcoin and Ethereum on 344 out of 727 trading days since the FTX event
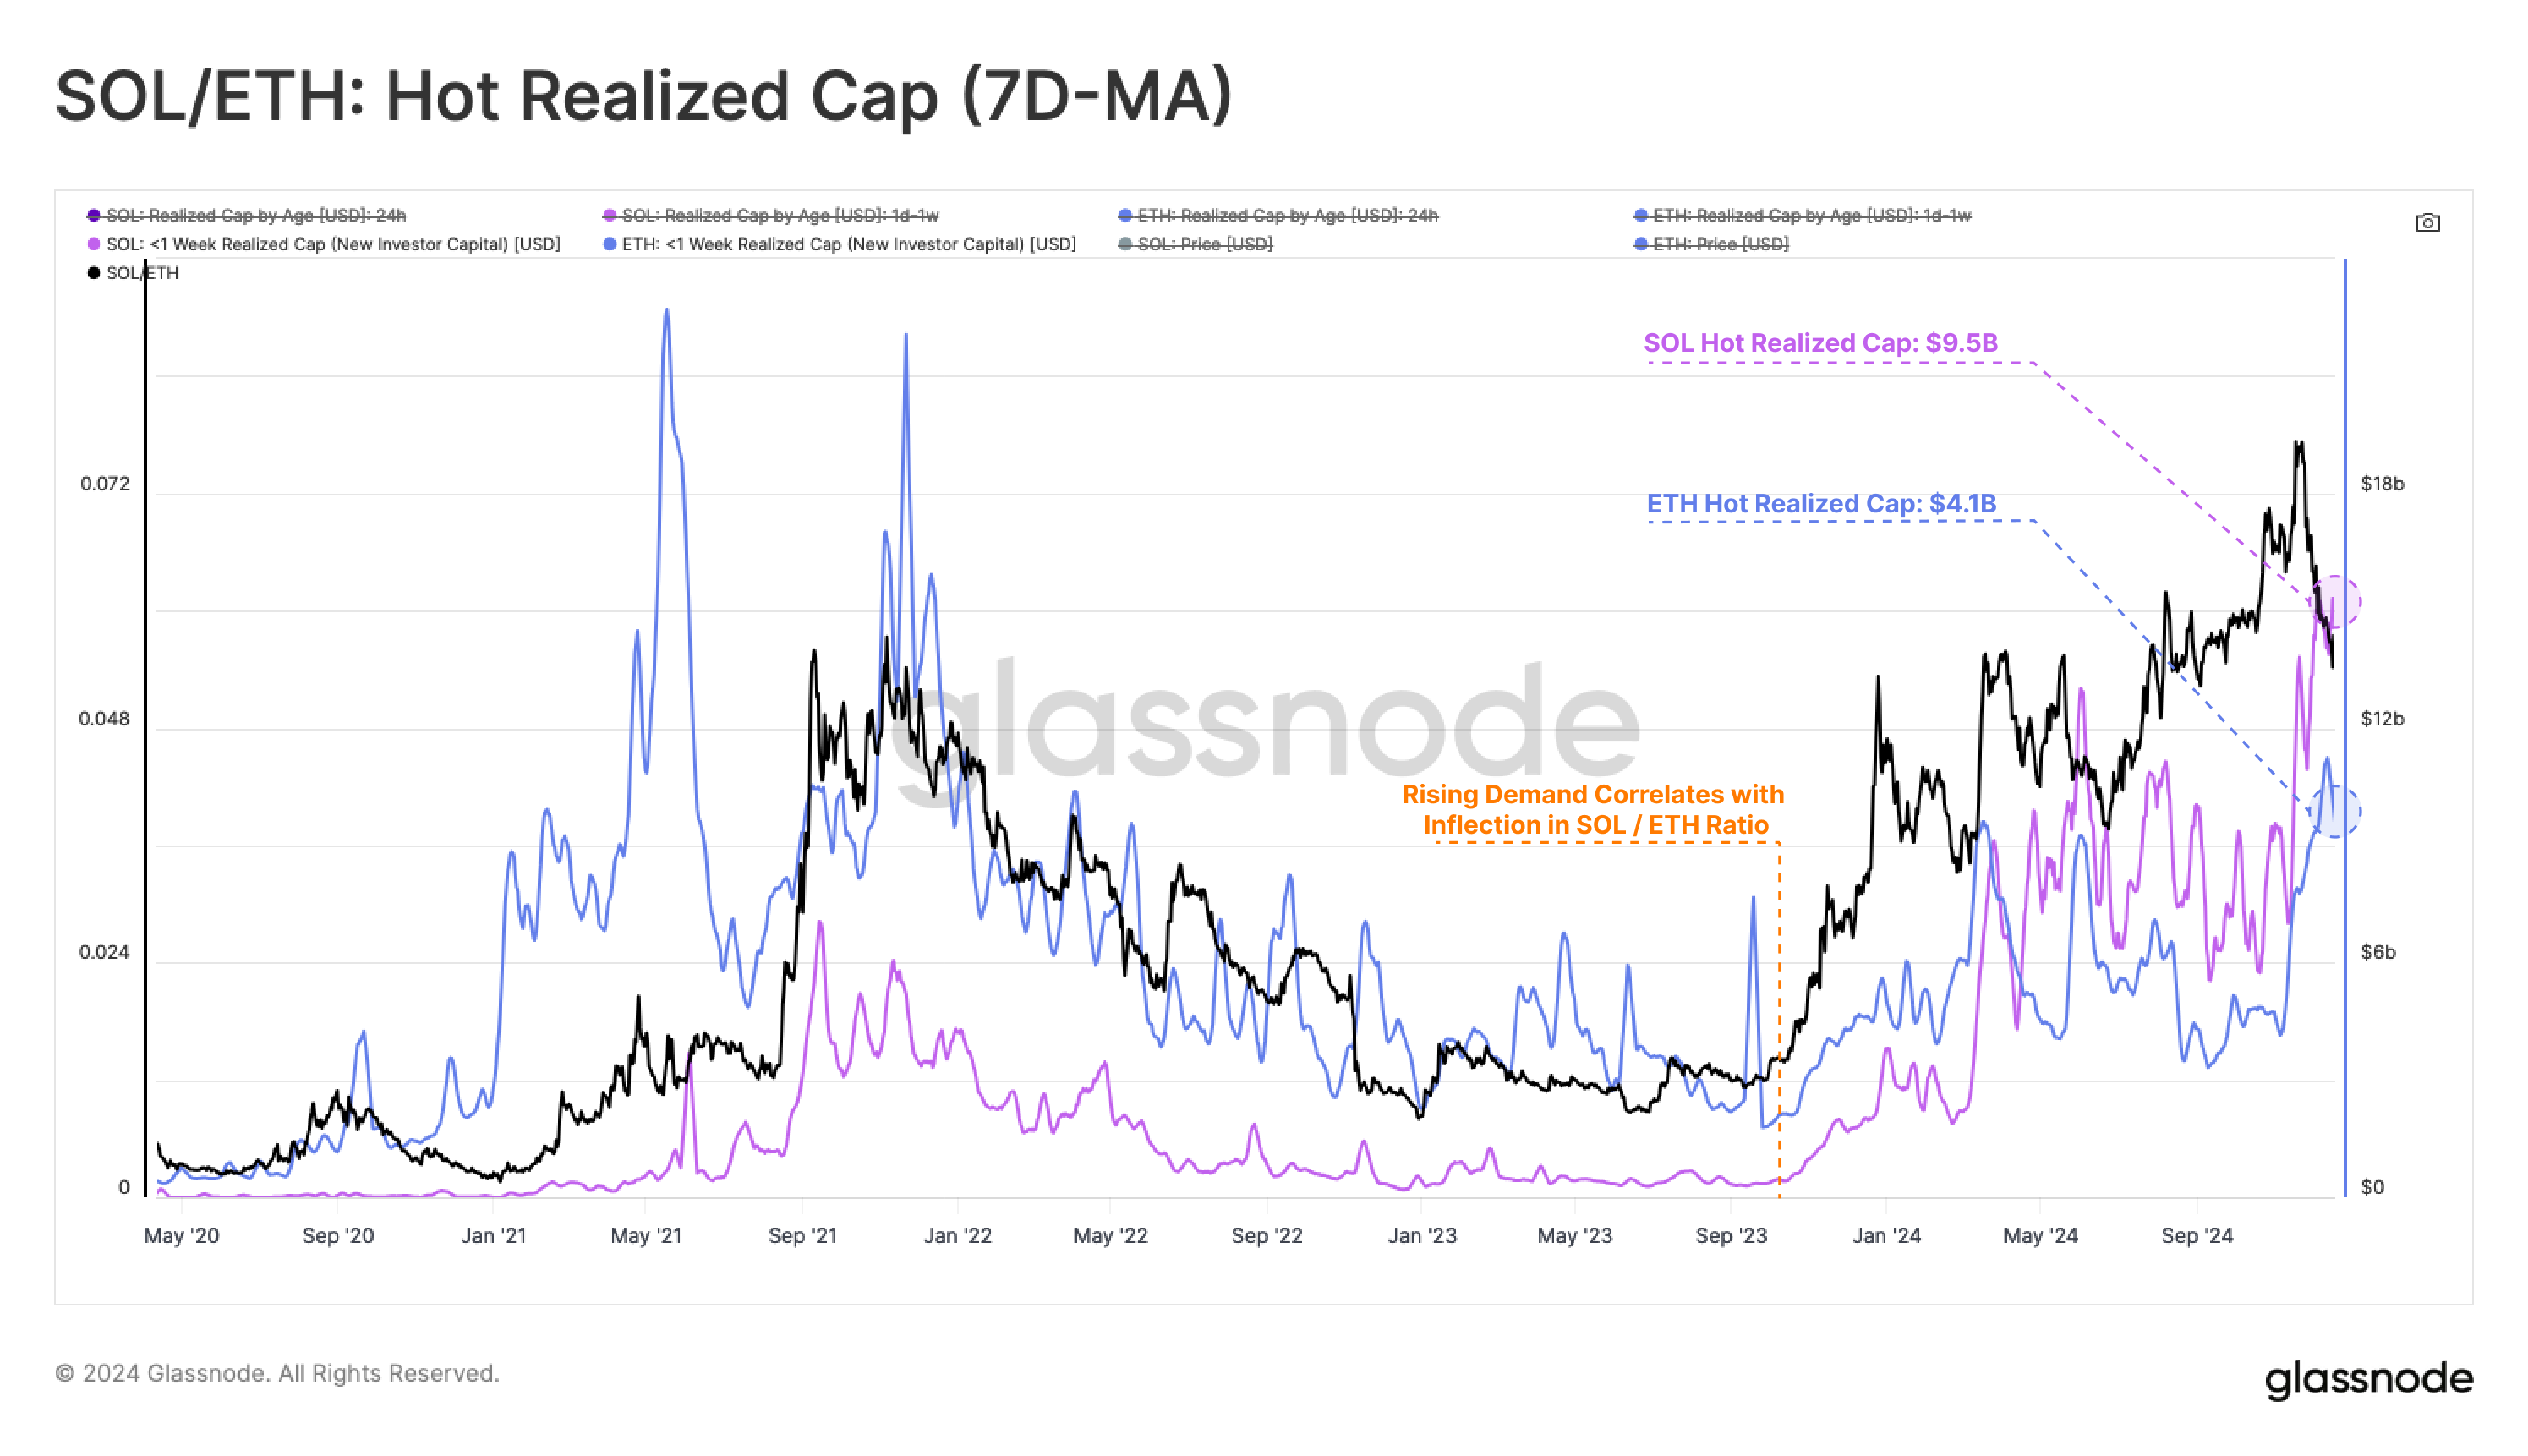
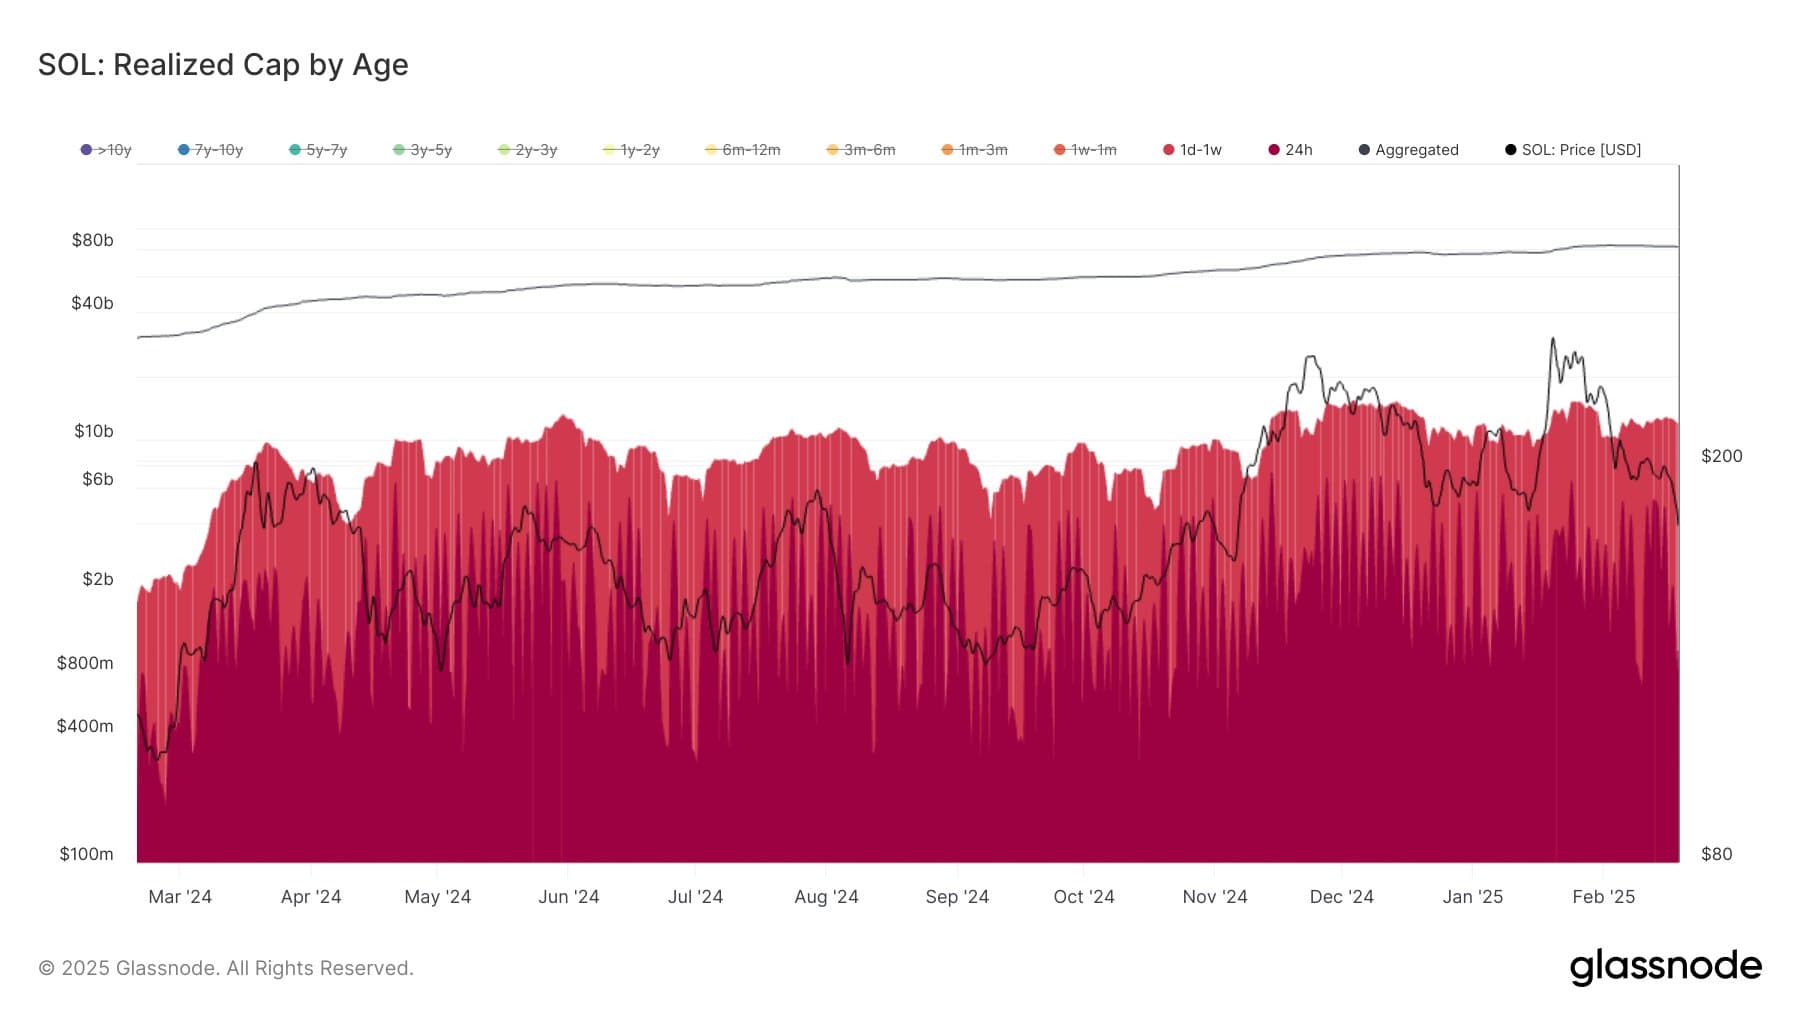
- New investor demand for Solana, for the first time in history, has overtaken Ethereum, highlighting its robust demand profile. (SOL hot realized cap: 9.5B, ETH: 4.1B)
- Solana has consistently maintained a positive net capital inflow since early September 2023
- Coins aged 1d-1w, 1w-1m, and 6m-12m, together, they account for a substantial 51.6% (55B) of all profit realized
- Solana had accrued over +$55B in USD liquidity, increasing the Realized Cap from $22B to an astonishing $77B.
- The MVRV Ratio suggests Solana is in an elevated but not yet extreme overvaluation range.

1 Like
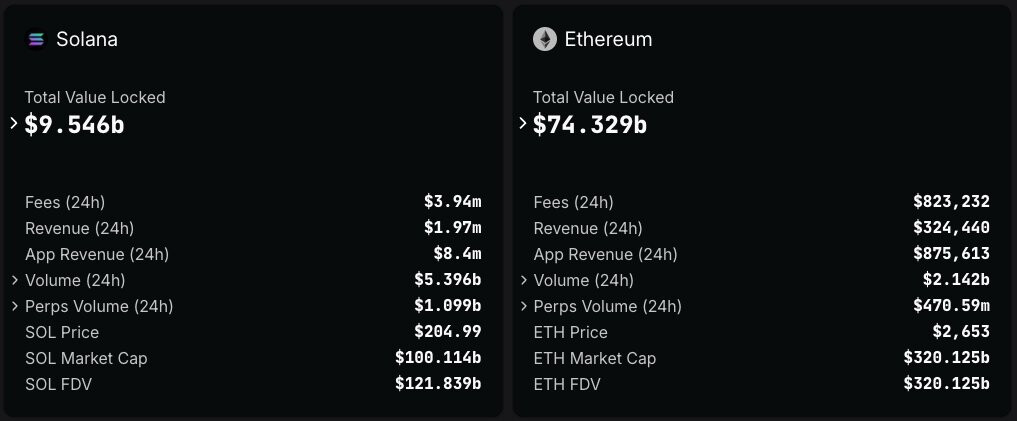
Solana’s network continues to generate higher revenue than Ethereum, even as overall market conditions cool.
- On Feb. 9, 2025, Solana generated $8.4M in revenue, while Ethereum made $875,571.
- Even when factoring in Ethereum’s Layer-2s, Solana’s revenue dominance remains.
- TVL for Solana still lags Ethereum significantly ($9.5B vs. $56.8B)
- Memecoin trading is a major factor in Solana’s revenue surge. The memecoin launchpad Pump.fun made $235M in Q4 2024 (+242% QoQ).
1 Like
Since the beginning of the year, Solana outperformed ETH for 23 out of 49 days. However, SOL has been more sensitive to recent drawdowns, with 30D price change clocking in at -32% as of Feb 17
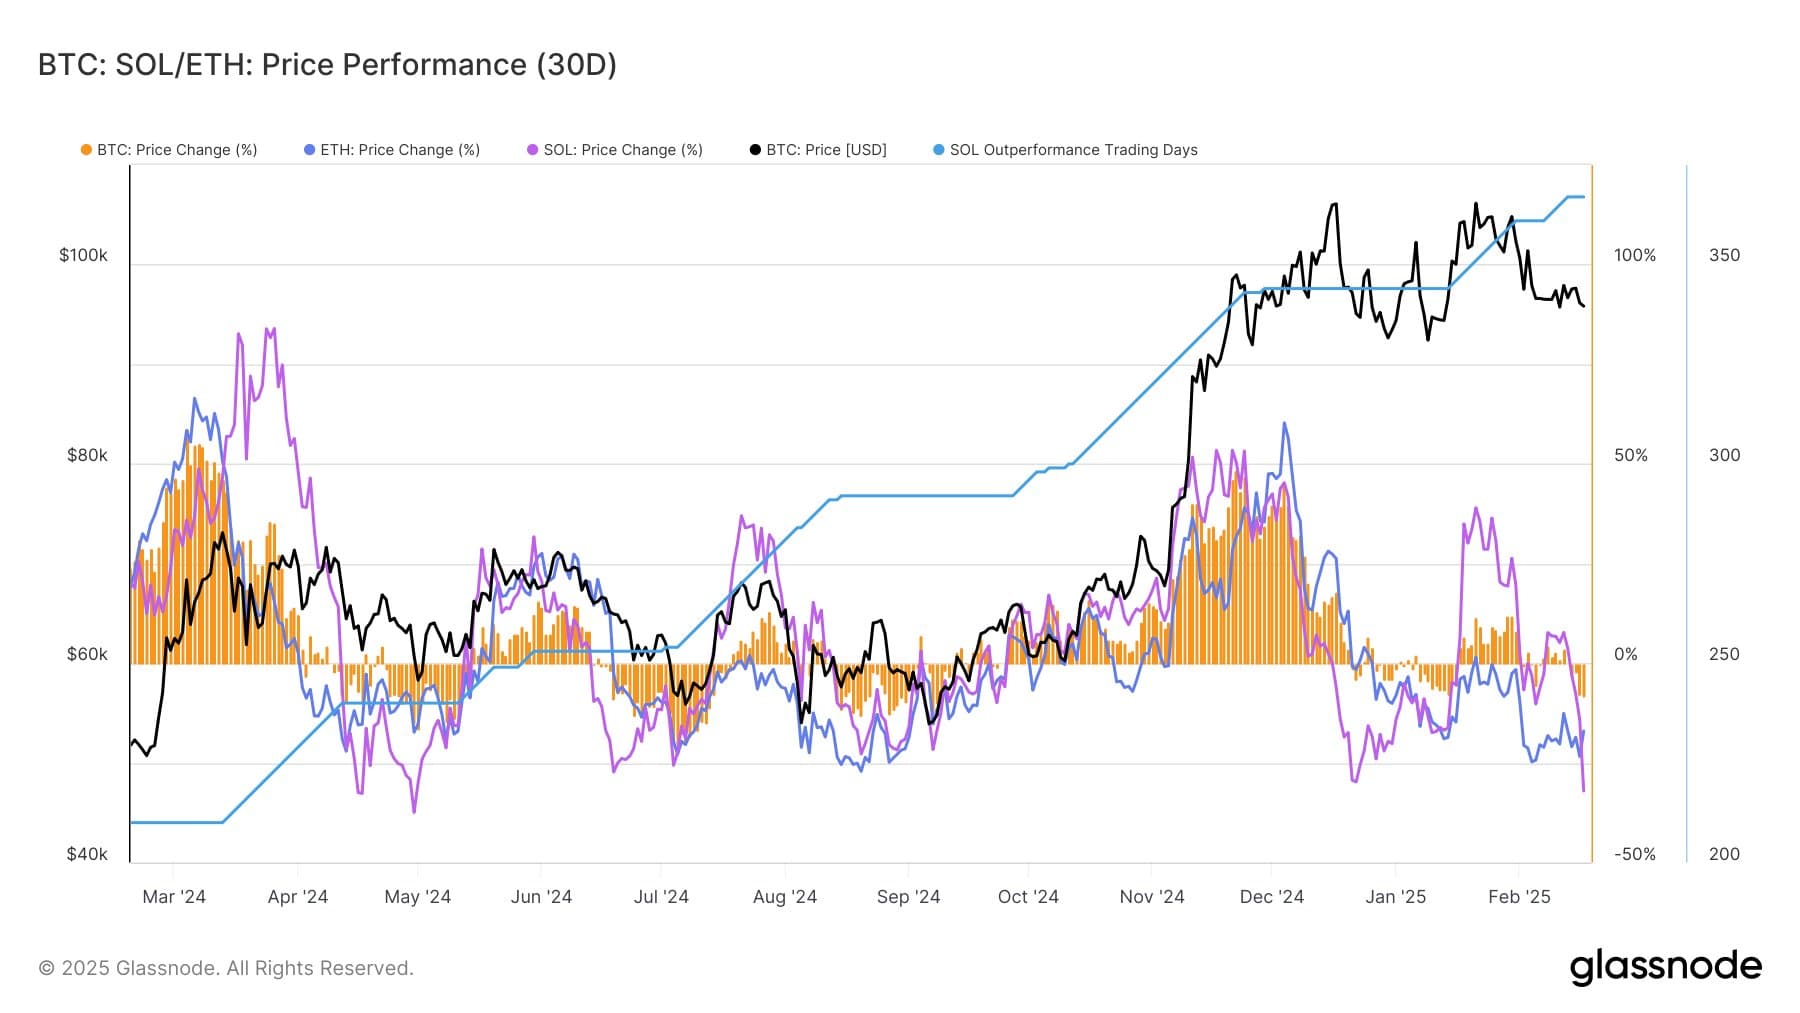
Solana’s Hot Capital ((1d–1w + 24h Realized Cap, tracks recent capital flows) has also declined but remains more resilient than BTC and ETH.
What’s your assessment of those technical Solana developments in a nutshell? Do you think now would be a good time to buy or not, based on the various indicators you are looking at? Which of them are bullish and bearish and do you have an overall assessment? What do you think how meaningful are those indicators vs. other fundamental research or other factors you are currently not looking at?
Hot capital and coins aged below 1 year looks quite bearish to me in general as those new investors often have no conviction and are more prone to panic selling. Once a lot of them sold esp. to larger wallets (smart money) or there are signs that large players accumulate it could be a good time to buy
I made my last assessment here (which is probably already outdated since this moves very fast, but will try to create a new one soon), but this is mostly based on BTC indicators.
But overall it seems selling pressure has diminished, and retail and speculative behavior has come down significantly to the very high levels of December, with very early signs of long term holders reaccumulating. Which could mean a good entry point could be coming soon if the macro does not deteriorate further, because there is still a lot of unrealized profits.
Since Solana has been the beneficiary of meme coins is not surprising its experiencing the highest level of volatility.
The problem with Solana (and ETH) is this type of data is very scarce (and are younger coins to analyze historical patterns), sometimes Glassnode shares some things but their more detailed data is paid, and is for BTC. But I can try and see what I can find.
I currently think sentiment and on-chain flow indicators still play an important role for crypto, especially if we planning to time the market somewhat.
Fundamentals and adoption seem to be improving for crypto, even in terms of regulation in the US. But prices still experience these huge volatile swings.
Long term probably fundaments are way more important, but I think that does not eliminate the short-term swings for now, especially with macro and news shocks affecting sentiment.
I made a post-mortem analysis of the recent meltdown, and I think following closely some of these indicators we could have known better the likelihood of a correction was high.
Good assessment & post-mortem analysis.
I think as well that those insights can be useful for timing the market. Can you try to replicate the same assessment for Solana and then in a seperate post for Ethereum? (With all available data / insights) Those are the two medium sized positions I have.
BTC analysis is the only useful for us if we can identify a high correlation / similarity of the behaviors we see for Solana and Ethereum and BTC and BTC offers more data.
If you did not do it already have a look at this collection here and add new tools to it which you come across.
I think CheckonChain holds a lot of similar data on BTC.
For seeing how leveraged people are I would recommend looking not only at funding rates but also at the utilization of counterparty liquidity pools like JLP. (I did not verify with an additional source if the low utilization via the linked Dune Dashboard is correct, but I think it likely is - indicating a lot less leverage used than at the height of speculation. Maybe there are even charts which show utilizations and size of those counter party liquidity pools over time)
Maybe other perpetual exchanges like GMX, dydx etc. offer similar insights on utilization. (Depends how their counterparty liquidity is designed)
I currently think that Sol and ETH indeed have a high correlation with Bitcoin still. and that’s why Bitcoin data is useful for the overall market timing. At least movements that are related to industry or macro news.
But I can work on this correlation too, and assess if it’s actually true or not.
Will also try to find what is available on SOL and ETH, because until now I have not been that successful on that.
I did not know you had this database. I also worked on crypto sources here. And also B Geometrics and BitcoinMagazine also offer similar on-chain data, but more limited, and again only on BTC.
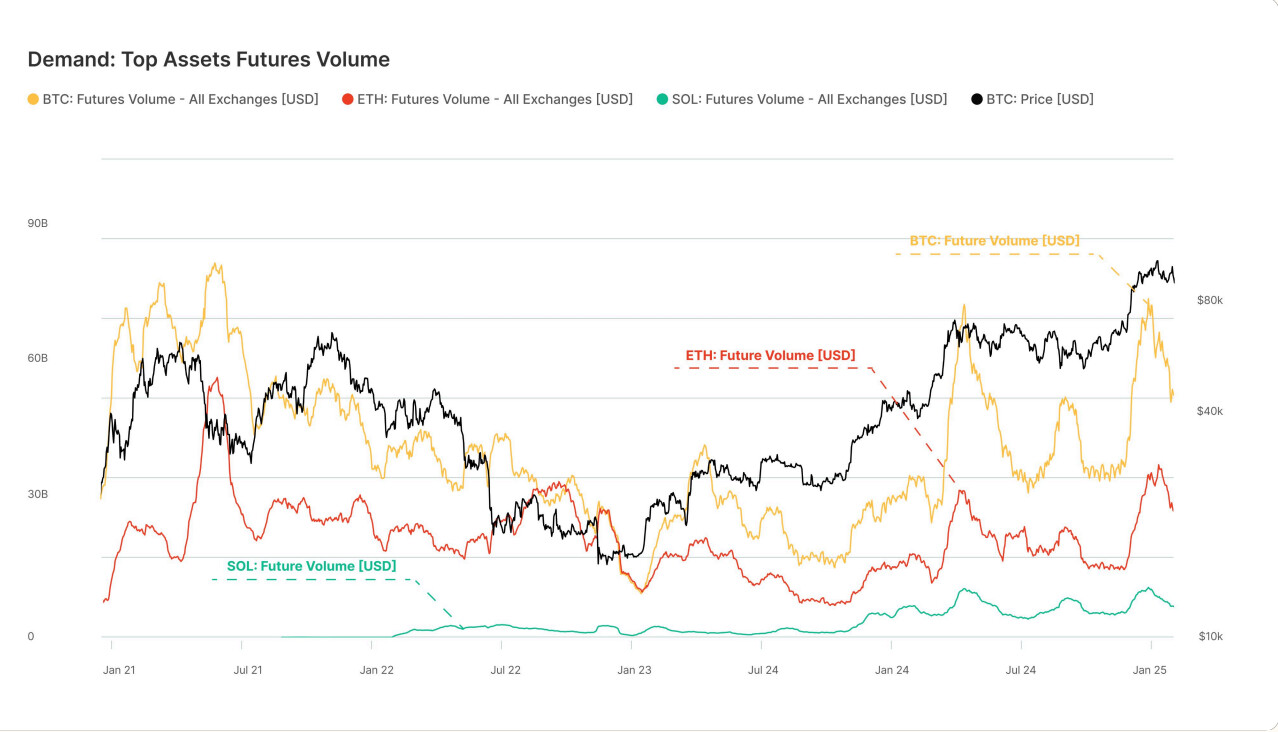
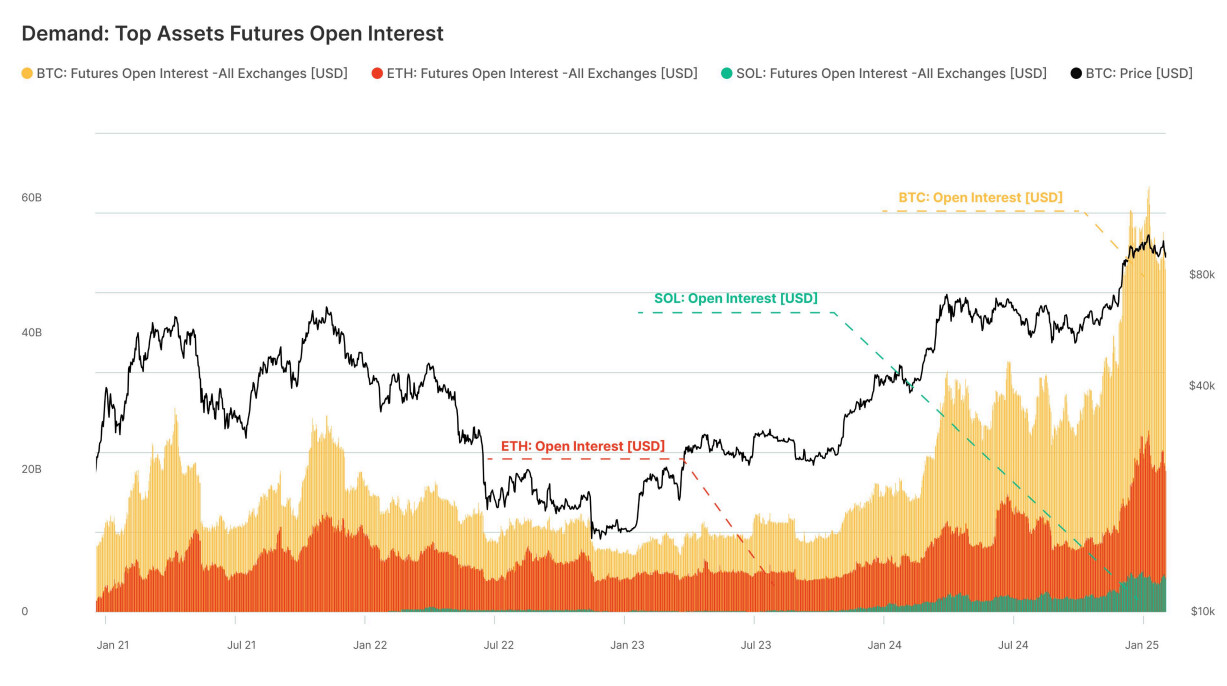
For leverage, do you mean data similar to the two charts below?
If, yes, I was already reporting something on ETH here, and the overall market here.
I would prioritize focusing on what is available on SOL and ETH itself.
Most recently, Solana dropped by almost 50% from its highs, while BTC retracted only around 10%, highlighting the need to focus on those assets themselves, in my opinion.
Yes, open interest, like in the charts, can be pretty interesting, but I am not very sophisticated with it, and I think we should learn which insights we can derive from it. For example, it would be insightful to find more details, e.g., by how much people are leveraged on average using those futures. (If available)
I remain to have a too high workload so i cannot compare those databases on tools and crypto sources but if you see an opportunity to unify and simply them that is always good.
1 Like
Isn’t this common? That other coins have bigger swings than Bitcoin?
However, Glassnode research does pointed out the recent drawdown it’s between largest for altcoins but not for Bitcoin.
So yeah, will prioritize what I can find on SOL and ETH.
I also don’t have a lot of knowledge yet on this leveraged data and what is used for mostly, but can try to learn more about it.
1 Like
Wintermute withdraws $38M SOL from Binance ahead of $2B Solana unlock
The transfers occurred days ahead of Solana’s $2-billion token unlock, which is set to release over 11.2 million SOL tokens into circulation on March
Some crypto analysts worry Solana’s token unlock could trigger selling pressure, as much of the locked supply was bought at FTX auctions at a discount compared to today’s prices.
1 Like
11.2 million SOL tokens will unlock on March 1
- While Solana has a current token inflation rate of 4.715%, over the next three months (Feb-Mar-Apr), over 15 million SOL tokens worth over $2.5 billion will enter the circulating supply.
- Companies like Galaxy, Pantera and Figure are in line to extract $3 billion, $1 billion and $150 million in unrealized gains once SOL unlocks occur.
- Unlock is 2.31% of the total supply and market cap, with Solana registering $3.6 billion in 24-hour spot volumes.
- With current OI rising and funding rates becoming negative, the current short-long ratio is 4:1

1 Like
Solana Whales Increase Engagement in Bearish Options Plays on Deribit Amid SOL Meltdown and Impending Unlock
- SOL block trades accounted for nearly 25% of the total solana options activity on Deribit last week.
- Nearly 80% of the block-trade volume was concentrated in put contracts. Compared to only 40% puts for BTC and 37.5% puts for ETH during the same timeframe
- Most of the block trades featured put options, which offer downside protection.
- Slowdown in the onchain activity and the impending unlock weigh over the token’s price.
1 Like
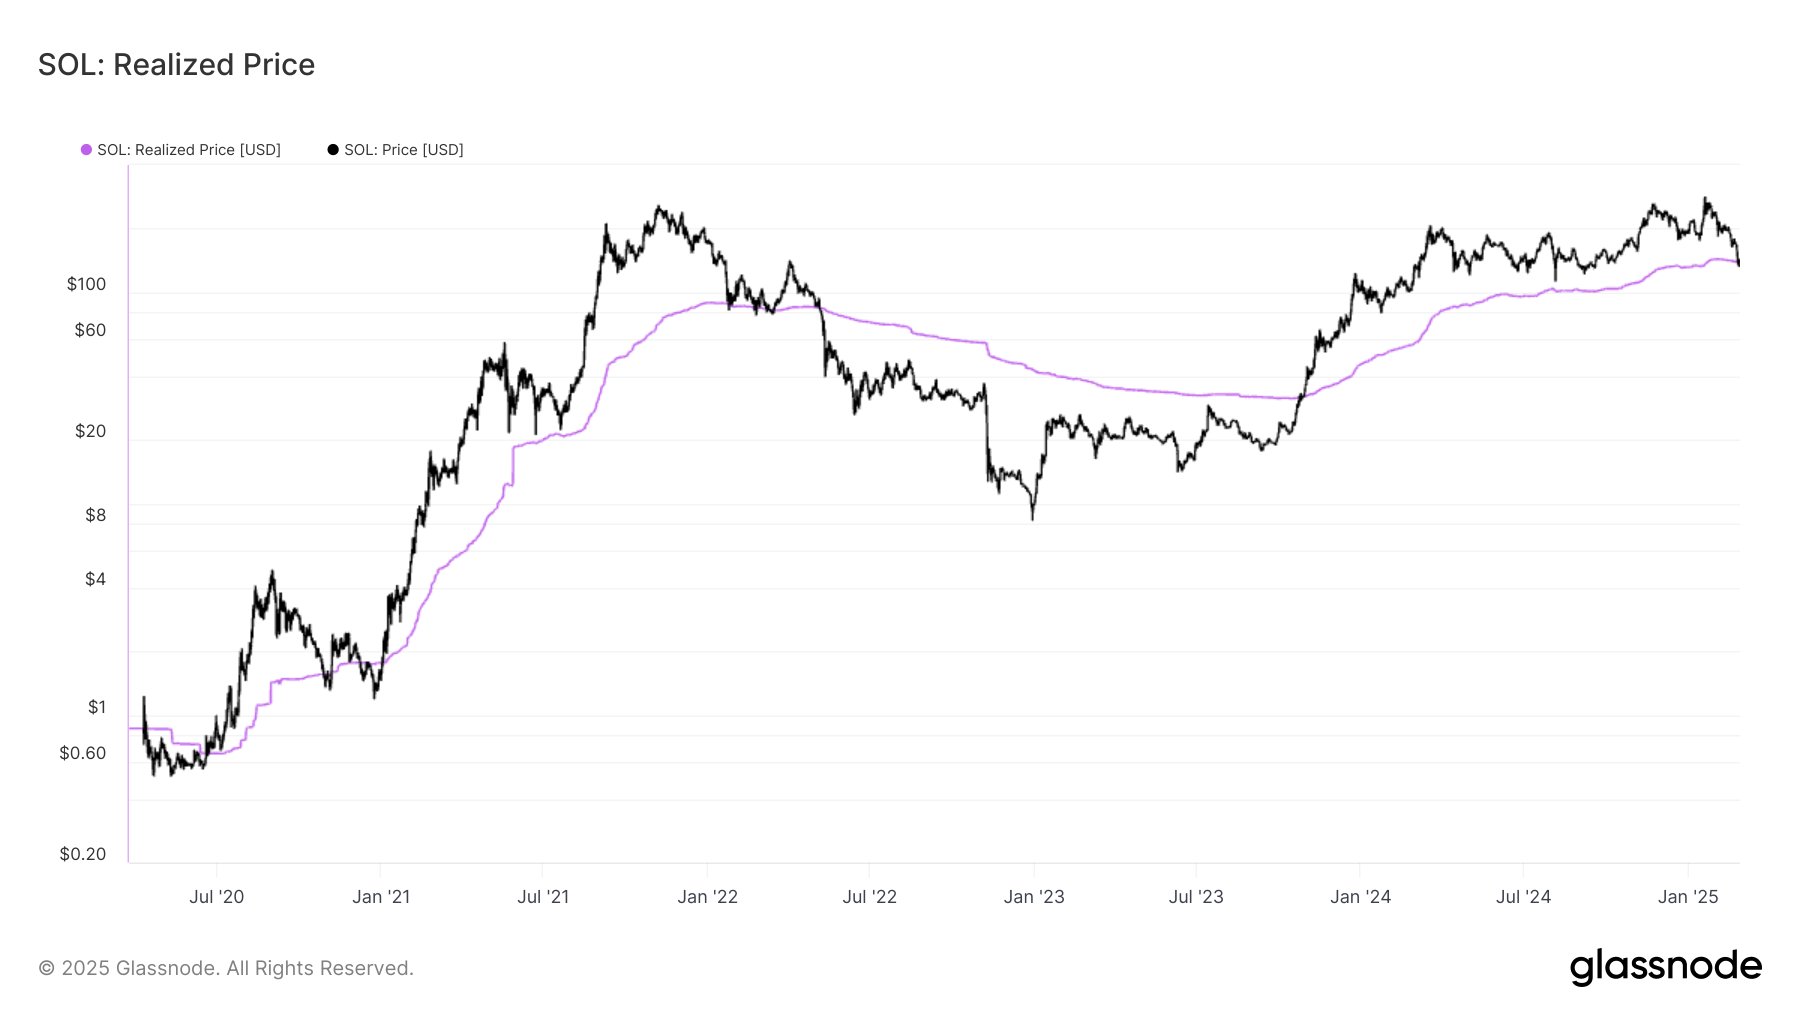
Solana’s price is currently hovering around its aggregated cost basis ($139), a critical level for investors.
![]() History Lesson:
History Lesson:
In 2022, SOL traded around this level for 5 months before breaking below and staying there until Oct 2023.
Failing to hold above this level now could signal a deeper market correction.
CME Group to Launch Solana Futures as Demand for Crypto Derivatives Grows
- Solana (SOL) futures will launch on March 17, pending regulatory approval.
- Contracts will be cash-settled and based on CME CF Solana-Dollar Reference Rate.
- The new contracts will come in two sizes: a micro-sized contract covering 25 SOL and a larger contract covering 500 SOL
- SOL futures join CME’s crypto product suite, which includes bitcoin and ether derivatives
1 Like