Main Article: Earnings Overview: 2023 Q4 - InvestmentWiki
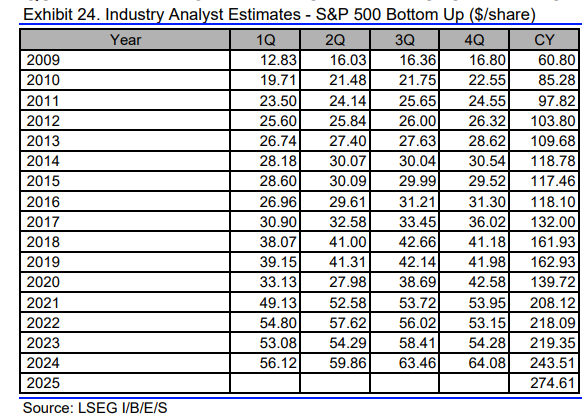
These are the estimates for Q4 2023:
Noticeable was the revision down for this quarter. At the end of last quarter, both Refinitiv and Factset were estimating about $58 EPS for the S&P500, and now it is only ~54.
Maybe it was because of the outperformance last quarter since about ~$55 was estimated, and the actual was more than $58.
2024 EPS is estimated to continue to be very strong at ~11%, even though it has been revised from ~$247 to ~$243. I am still unsure how an economy that it is expected to only grow ~1% in 2024 can produce an 11% earnings growth, even more with inflation and pricing power decreasing.
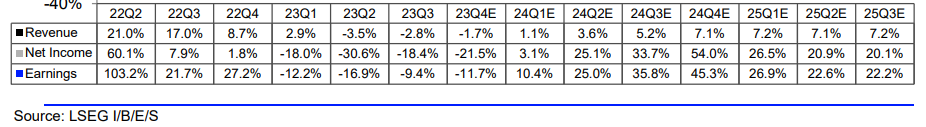
Refinitiv:

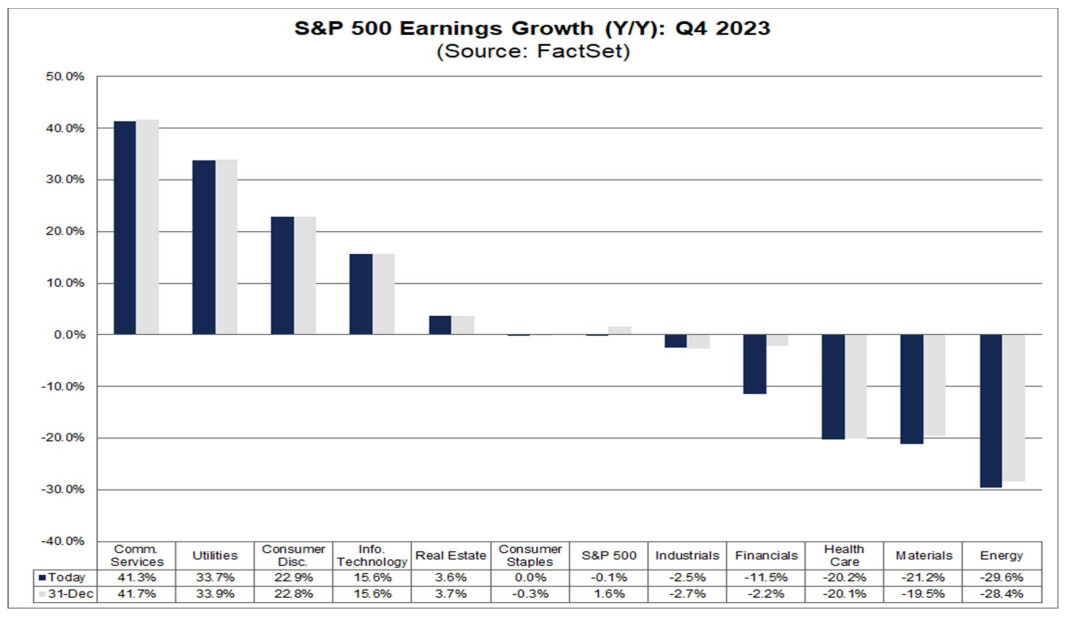
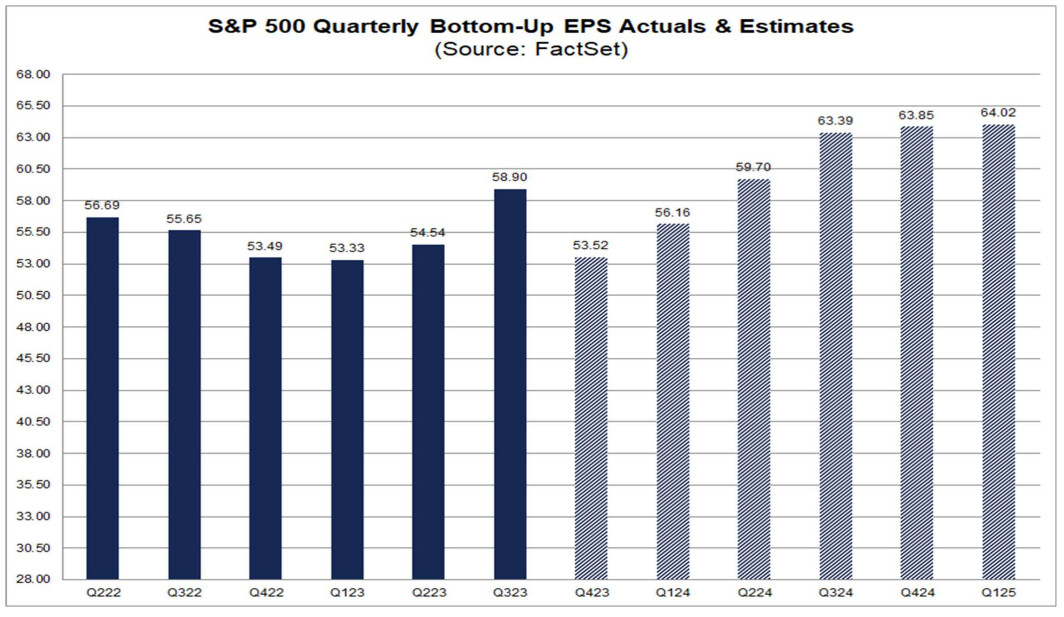
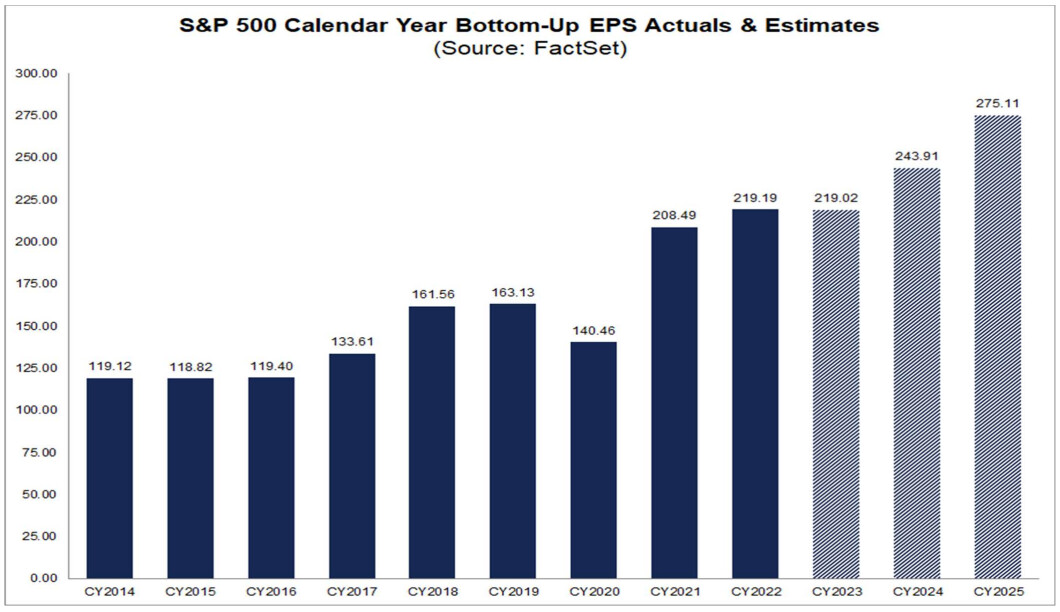
Factset:
1 Like
Possible ways for disproportionately large earnings growth I could see are
- Increased automation and productivity gains
- Higher share of high margin products or industries
- Savings in certain parts of the supply chain
- Pricing power esp. in highest value chain products
That said I am also skeptical about those predictions as we start to see first signs of weakness in labor and banks and there are also negative factors for earnings e.g. funding costs are still expected to grow as companies need to eventually refinance.
@Magaly Do we already have a topic to discuss pricing power? If yes, can you link that topic in your last post under “pricing power decreasing”, so that we can continue discussing there?
1 Like
These are valid points. And Revenue growth is also more modest.
Refinancing cost I think will become an important factor later in 2024/2025 if rates continue high enough.
I do not have a pricing power discussion.
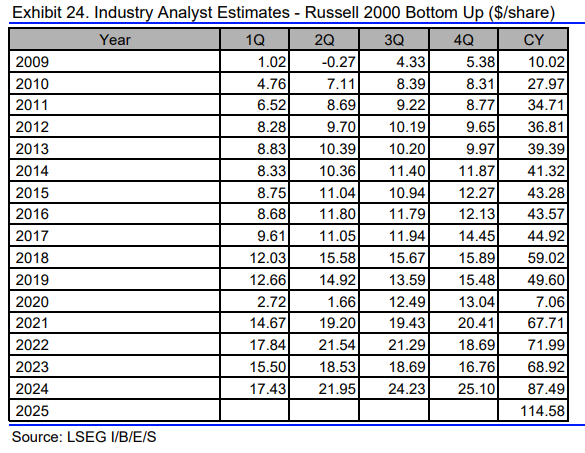
These are Rusell 2000 Estimates:
It’s interesting how weak small caps continue to be, but next year growth is expected to be even stronger than the SP500.
1 Like
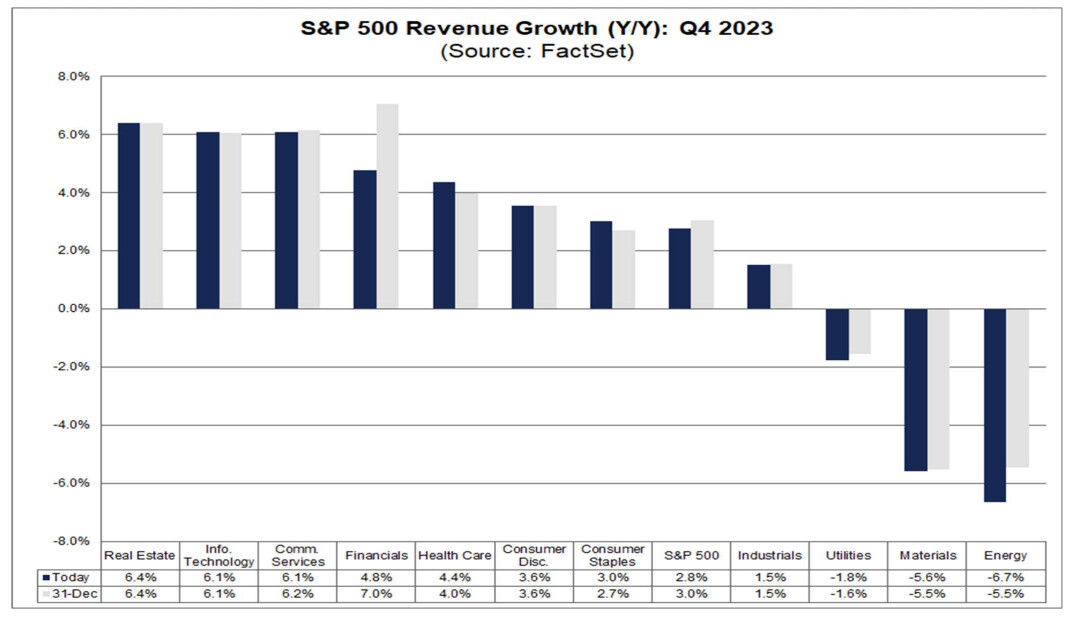
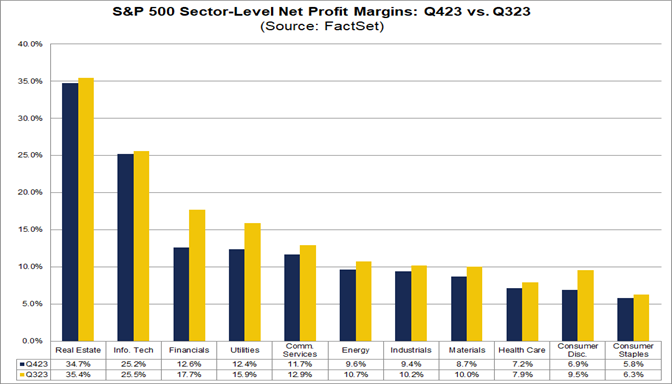
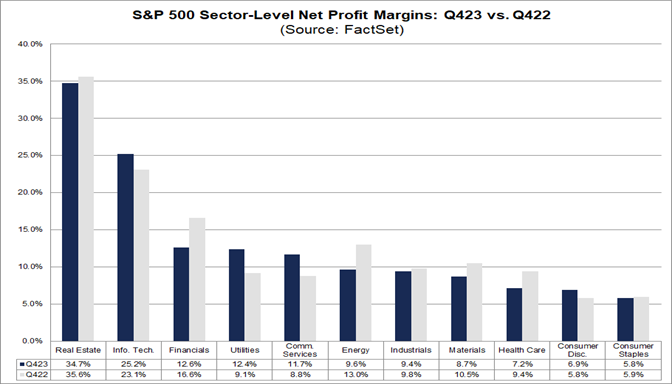
Facset is estimating a noticeable decline in net profit margins for Q4 2023. But is it very different from industry to industry?
However, It is interesting to note that analysts believe net profit margins for the S&P 500 will improve in the first half of 2024. As of today, the estimated net profit margins for Q1 2024 and Q2 2024 are 11.7% and 12.1%, respectively.
If 10.7% is the actual net profit margin for the quarter, it will mark the lowest net profit margin reported by the index since Q2 2020 (8.5%). In addition, it will mark the largest quarter-over-quarter decline in the net profit margin since Q1 2020 compared to Q4 2019 (9.2% vs. 10.8%).
Declining profit margins is an important part of the thesis that companies will start to lose pricing power due to lower demand, and eventually have to restructure to reduce costs if they want to protect their margins.
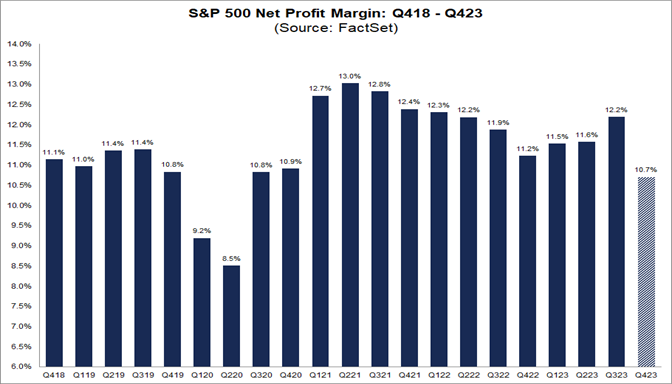
S&P 500 Reporting Lowest Net Profit Margin in More Than 3 Years for Q4.
1 Like
I think that’s interesting and we could have a little closer look. Why exactly are profit margins expected to be that much lower in Q4 2023 and why are they expected to rebound afterwards in Q1/Q2 again?
I don’t find the reasons in their reports. Factset and Refinitiv unfortunately only aggregate the analyst estimates, and don’t go into the whys.
I found some news, but my guess is they are only offering reasonable explanations. Basically, a combination of companies continuing to cut costs and technology increasing productivity.
Have not seen anyone say that it is because they expect a significant renewal of inflation.
And we are seeing in their estimate that while they are expecting ~5% revenue growth, earnings are expected to increase ~11%.
2023 is expected to end flat for earnings and about ~2% for revenue.
After higher costs and shaky consumer demand caught up with corporate America last year, Wall Street now expects corporate profit margins to rebound through the first half of 2024, as more companies resort to layoffs, technology or other cutbacks in an effort to guard the bottom line and stave off investor anxiety.
Cost cutting may see profit margins rising again in 2024 - MarketWatch
What I also found is that as always, there are a lot of revisions, and these estimates could not end up being the final ones, nor even correct.
As recently as October 2023, there were estimating 11.5% for Q4 2023, 12% for Q1 2024, and 12.3% Q2 2024. And now they are at 10.7%, 11.7% and 12.1% respectively.
1 Like
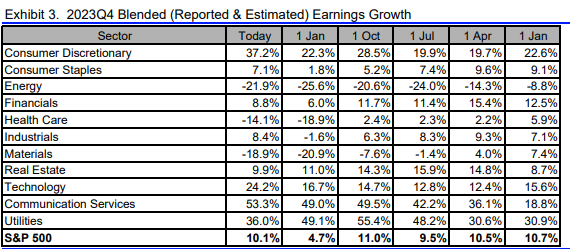
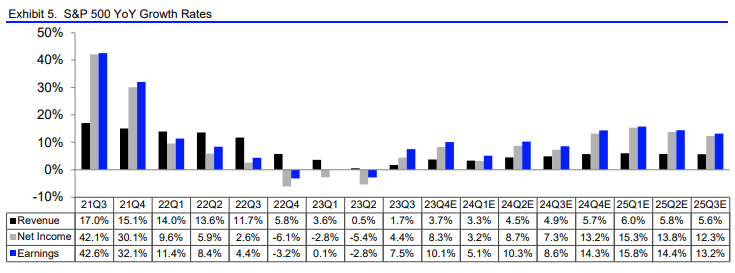
This is how Q4 2023 earnings most likely end:
SP500
- The 23Q4 Y/Y blended earnings growth estimate is 10.1% vs 4.7 estimated as of January 2024.
- EPS 57.11 vs 54.28 projected.
- The 23Q4 Y/Y blended revenue growth estimate is 3.7% vs a 2.6% estimate.
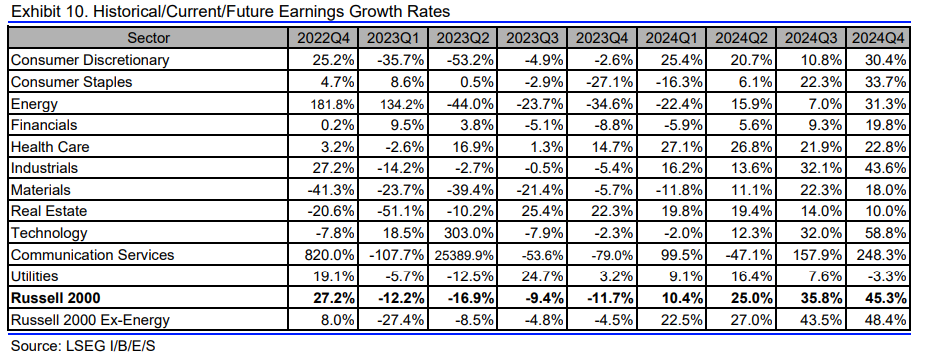
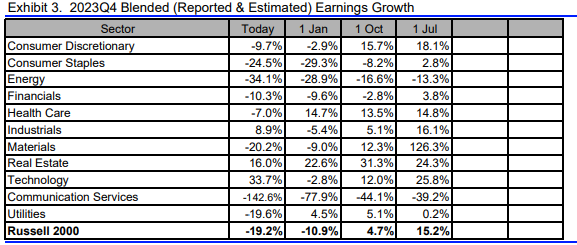
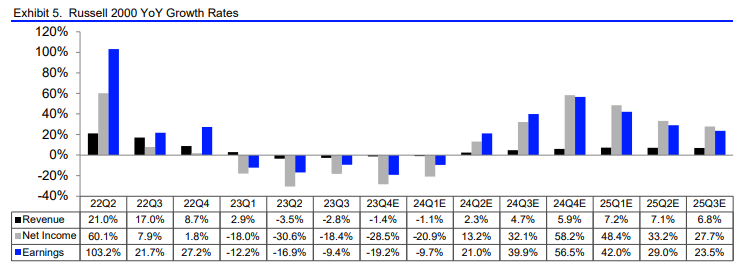
Rusell 2000
Very different story for the smaller companies, but recovery expected after q2 2024
- The 23Q4 Y/Y blended earnings growth estimate is -19.2% vs -10.9% as of January
- EPS of 15.66 vs 16.76 projected.
- The 23Q4 Y/Y blended revenue growth estimate is -1.4% vs -1.8% estimated.
Great Idea to compare expectations and outcomes!
It is very interesting how much they are deviating.
It’s not high prio but how well do you understand refinitivs methodology?
I tried to recreate Y/Y earnings growth rates by comparing earnings from a year ago but arrived at completely different numbers and I also do not understand how sectors are weighted when calculating the average for the S&P 500.
My understanding of analyzing sectors and tracking trends is very limited so I could make very simple or beginner mistakes.
1 Like
No, I have never seen their methodology being disclosed, at least not in the reports that they offer for free.
We would have to search if it’s available, but being mostly a paid service it could be unlikely they disclose how they built it.
Seems the growth rates they are offering are not Share-Weighted as it is not specified in the table, contrary to the absolute levels. So you would not be able to replicate that way.
1 Like
Ok. We are not in a hurry but maybe before the next earnings, we can find out which data points are most reliable and what we should focus on.
Interestingly, earnings growth rates vary between
- LSEG $B Share-Weighted 7.27% (which is used by e.g. Ed Yardeni)
- LSEG relative growth rates 10.1%
- S&P 500 EPS data 6.99% and
- Factset relative data 4.1% (p. 18)
I personally tend to like the $B absolut numbers most as the give the most tangible insights into the size of industries IF they are reliable.
Ed Yardeni uses per share data from Refinitiv not the absolute in B (which was 7.45% y/y pg.8), and from what I have seen per share data is the most used by most analysts.
In this case, I have always prefer the S&P data for actual and fundamental understanding since it is their index, and is the one I have planned to used for my charts. But this data will be limited to only this index, and you won’t have Russell numbers.
Analysts estimates won’t be the same either, or won’t be as easy to see revisions.
So to understands analysts estimates, what they are pricing, surprises, etc I have always prefer Refinitiv since it’s the most complete of them all in this aspect.
But otherwise, how are you planning to know which one is better? For this you would need something to compare with, or to know the real numbers yourself.
True. Good point.
I would look up both S&P and Refinitiv’s methodologies to try to understand why there are discrepancies and which methodology is better. We could also research this question and see what most credible analysts are relying on or if there is a public discussion about the topic.
(Usually, I would say we should go with the original data, but it might be the case that the S&P methodology is a bit outdated or Refinitiv improved upon it and the breath of what we get from Refinitiv is very good)
If you compare the S&P 500 EPS data from Refinitiv on page 8, which you just linked, with the original data from the S&P 500 from my last post (Source: S&P 500 “Index earnings”), you can see that Refintiv’s EPS is consistently higher.
Refinitiv per share data is only given on an index level for free.
If you want EPS for each sector, only S&P provides it.
You could use charts like from Ed Yardeni, but they are only helpful for visual representation.
I am guessing methodologies will not be available for being paid services, but I could be wrong.
Looking at what analysts do could be an option, but from my anecdotal experience, I have seen all of them being used, including and most of all Bloomberg, to which we don’t have access.