Main Article: Bankruptcies: Europe - InvestmentWiki
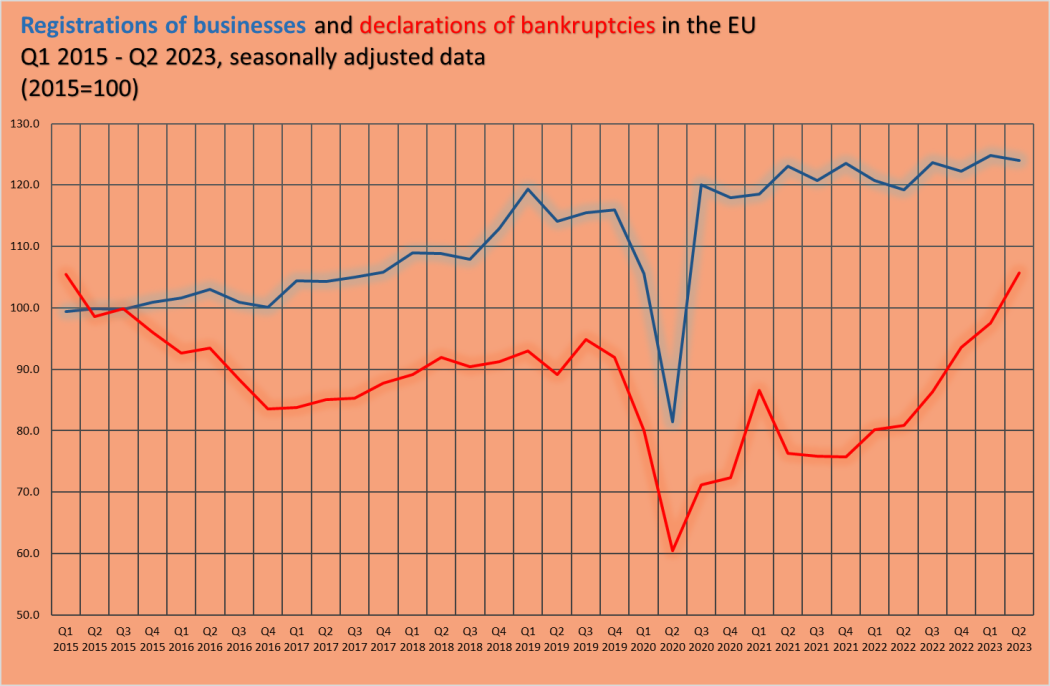
While business registration growth has stagnated, bankrupcies are increasing significantly in the Euro Area.
Since the first quarter of 2022, including the second quarter of 2023, the number of bankruptcies declarations has been on clear upward trend. With the latest increase in the second quarter of 2023, the bankruptcy declarations reached the highest levels since 2015, just surpassing the previous peak from the first quarter of 2015.
- In the second quarter of 2023, the seasonally adjusted number of registrations of businesses was down by 0.6 % in the EU and up by 1.1 % in the euro area, compared with the first quarter of 2023. In the first quarter of 2023, the number of registrations of businesses was up by 2 % in the EU and by 2.1 % in the euro area, compared with the fourth quarter of 2022
- In the second quarter of 2023, the seasonally adjusted number of declarations of bankruptcies increased by 8.4 % in the EU and by 9 % in the euro area, compared with the first quarter of 2023. In the first quarter of 2023, declarations of bankruptcies increased by 4.2 % in the EU and by 3.5 % in the euro area, when compared with the fourth quarter of 2022
Interesting data.
I will use this data as an opportunity to describe some of my thought processes when encountering new data.
When I encounter new data like this I usually try to figure out if the data is “signal or noise”. This means I try to determine what this data measures and how much it is correlating with real economic weakness or strength so that we can use it as a reliable signal in our model.
This first step is very important for all data points because “noisy” data that has no real economic relevance could flaw our thinking and distort the picture we are seeing as we are focusing on the wrong instead of the right indicators.
This could ultimately lead to wrong decisions taken as we are assuming the wrong prerequisites.
In practice, I often take some data points as very weak signals, esp. if there is uncertainty around their methodology, prediction power, etc.
Usually, I try to focus on the following questions:
- Methodology: How was this data collected? Is there room for error in the data collection? What kind of data is collected? Which type of business counts towards the statistic? How coherent is the data? (E.g. are there large differences between how different countries report or are there very large differences in the size of what one bankruptcy could mean)
- Size/Relevance. How is the size of bankruptcies compared to other data points that help us determine their magnitude? (E.g. Which % of businesses go bankrupt each year in a given country? How many businesses are formed? Is the surplus in bankruptcies enough to cause a significant increase in unemployment? Etc.)
- Consistency. Are there any apparent inconsistencies? Are there any elements that stand out? Are there elements that do not make logical sense? Etc.
Relative y/y or m/m changes usually only become more important to me once I got a good picture and reached the conclusion that the data point is relevant and when I can assess what a certain y/y or m/m change means in terms of impact for a company, economy, etc. (If it has an impact)
When I look at the data itself, the most surprising element to me is that the number of bankruptcies in major economies like Germany and France is down significantly in 2022 compared to 2015. (Although I am not sure if this is relevant, given that we do not know the size of bankruptcies)
In fact, when looking at absolute numbers it appears that the majority of the increase in bankruptcies starting from 2021 is coming from the addition of multiple new countries like Sweden, Hungary, Finland, Czechia and Ireland in 2022 to the table, as well as some weakness in France.
It is also surprising to see that the number of bankruptcies varies so much by country. As an example, the population of Italy is only 10% smaller than the population of France but bankruptcies only stand at 7,164 compared to France’s 39,886.
It would be interesting to find out why there is a difference in order to understand the methodology of the data or differences in businesses in different countries better. Some of the causes I can think of are e.g. more individual small businesses existing in France that classify into this bankruptcy statistic or some deficit/different measurements in reporting bankruptcies in Italy.
My overall take on this data is that I see it as slightly positive compared to my expectation. I heard that bankruptcies in Germany are rising but according to our numbers, the amount of bankruptcies is low historically (longer timelines than 2015 would be interesting) and relatively (If I assume that bankruptcies in this statistic only apply to limited companies and partnerships we see 14,453/1200643 = 1.2%)
That said in order to get a more accurate picture we would definitely more research. As an example in Germany, you don’t necessarily need to declare bankruptcy but you could also liquidate companies if they are not over-indebted.
More economically relevant companies in Germany have still a creation surplus but the number of business terminations rose 12.4% in H1 2023 compared to H1 2022 and terminated companies have likely had more substance than newly found ones can gain in the short run.
I am focusing on Germany as one example country to go in-depth as it is the most relevant market for our portfolio companies and I am assuming that the average German company in the bankruptcy statistic is larger than in other countries.
What is your take @Magaly?
I understand what you are saying, and I also think it would be ideal to do that. But in order to do that we would need a system that would allow us to collect and store data very easily in order to draw historical correlations between all the relevant economic data, because basically what you are saying is that you want to model the data to understand their significance and predict power. Right now I have to rely on what other correlations economists have done or found, and most of the time this is not available, and I think most of them rely on something like Bloomberg terminal for most data.
About methodology and founding inconsistencies that is easier to analyze, I would say at the stage we are. But I would also say that the majority of data, even the most used one by the markers, you will find weak points and inconsistencies. So, without a historical correlation analysis, for me is difficult to say that x or y is better or worse, because I could see cases where data with the most pristine methodology maybe don’t actually say much about the economy, and there could data with some weak points that are actually very powerful.
In this case, the methodology between countries is most likely very different, and that’s probably why they create an index, instead of analyzing the absolutes. But only for this I would not actually say the data is a weak data point, we don’t know if the correlation is actually significant, and, we also don’t if its even leading or lagging indicator compare to others.
Yes, I absolutely agree. Which kind of system do you have in mind?
My take on bankruptcy data is that it has to be a weak data point as long as it is non-specific and is not quantifying the size of bankruptcies. It also only shows the worst consequence of business failure and not if a lot of companies are struggling but are not going bankrupt. So overall in direct comparison e.g. jobs, numbers are way stronger data points as it shows the state how many people are employed.
In addition, as you say, for this specific data we might very well have differences in how countries measure and even differences in reporting as it was not mandatory to report to Eurostat before 2021.
I think it would be cool if we create an article that describes which data points or signals we are seeing as strong or weak and give our reasoning for it. (We could create a table with categories like methodology, logic or historic correlation)
We would also want to specify how fast certain data points are reported and if they can therefore be used as leading indicators.
When I think about it, I think in like a data analytics tool. Because you not only can play with the large sets of data as you wish and at once, but you can also get the visuals after your analysis. The way we collect data currently in sheets and wiki is very inefficient for this goal, or not feasible even.
About bankrupcies, I actually have heard Danielle Dimartino pointing out this exact weakness that you just mention, and why the reality can be much different from this small subset. So, I think this is a very valid point. But it could happen that we run a correlation and is actually very strong with unemployment or GDP or any other data, we just don’t know. In this case, I think this will not be able to be determined as much since data is only collected since 2015 for EU, or needs to be done for each individual country like Germany.
The article sounds good, but it probably needs to be made for each country or region since they use different methodologies. And obviously, monthly data is the best, but depending on the lead time there could be some quarterly data that can also be used as leading.
1 Like
3 posts were merged into an existing topic: Correlation Testing