Developments to try to asses the market cycle phase driven by liquidity, investor sentiment, and macroeconomic forces.
Assesment Market Cycle as of February 2025
Observations:
- Long-term holders have started to take profits since November, with 1+ Year HODL Wave from 68% to 62% (however the top is reached way after this started to happen)
- The long-term holder profit/loss ratio is still very high, suggesting motivation to take profit could still be high
- Long Term Holder’s unrealized profit share has steadily declined since November, now at its lowest since September.
- At the same time, LTH inflow volumes to exchanges have declined from $526.9M in December to $92.3M, a -83% decline. Implying less selling pressure. Overall exchange deposit volumes declined from $6.1B to $2.8B (-54%).
- Realized profits peaked at $4.5B in Dec 2024, now down to $316.7M (-93%).
- Long-Term Holders (LTH) show signs of returning to accumulation
- 50.2% is the proportion of wealth held by new BTC investors (24h to 3 months), increasing but still well below the levels seen during previous ATH cycle tops
- However, currently lower retail activity after December meltup, retail investors were spending $20.6M per hour. Currently, that figure has dropped to ~ 10.7M per hour - a ~48% decline.
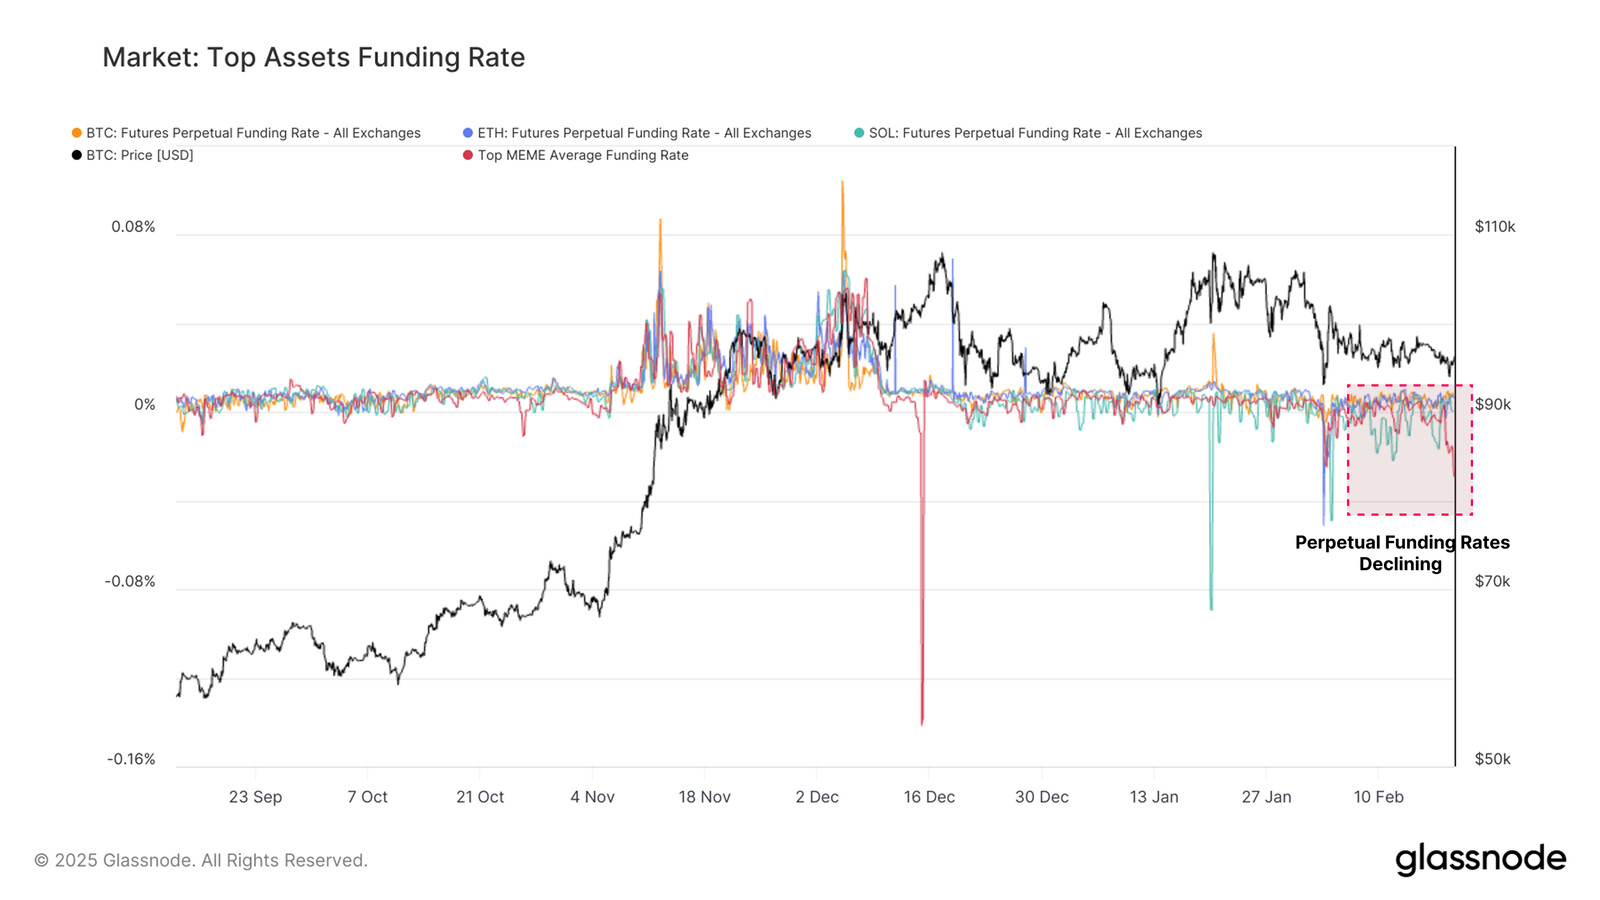
- Funding rates for the top assets in the market show the appetite for long positions has not returned to the levels seen in the November to early December rally. This indicates a lack of aggressive demand currently.
- Short-Term Holder Realized Price currently is ~91k. This could be an important level to hold since this cohort could panic sell when in significant losses. Still losses are not huge.
- Bitcoin MVRV Z - Score, one of the most commonly used to assess overvaluation, is still below the previous tops
Assessment:
Long-term holders still have substantial profits and have been net sellers since the end of last year, but selling pressure has started to ease recently.
Meanwhile, short-term holders remain the dominant source of demand in the market, with long-term holders showing signs of reaccumulation but not at high levels yet.
In my view, this makes the market more vulnerable to industry-related or macroeconomic shocks, unexpected events like those seen since last December. Seasoned investors are currently more inclined to take profits, while short-term demand is more speculative and sensitive to price fluctuations.
Given the current slowdown in speculative retail activity, lower funding rates compared to their December peak, and reduced selling pressure from long-term holders at this level, a temporary equilibrium may have been formed at ~90-100k, if macroeconomic conditions indeed stabilize.
Overall it seems the market is in a mid/late stage, where very overheated levels of past cycles have not been reached. So, in theory, based on past patterns, the bull market still has a way to, especially combined with a better regulatory environment, especially in the US.
Things to watch carefully currently:
- Monitor volatility and macro shocks closely, breakouts in either direction often follow tight consolidation ranges, and macro leads could be the catalyst in the current environment
- Renewed sell-side activity, since a resurgence in LTH selling could signal more distribution ahead
1 Like
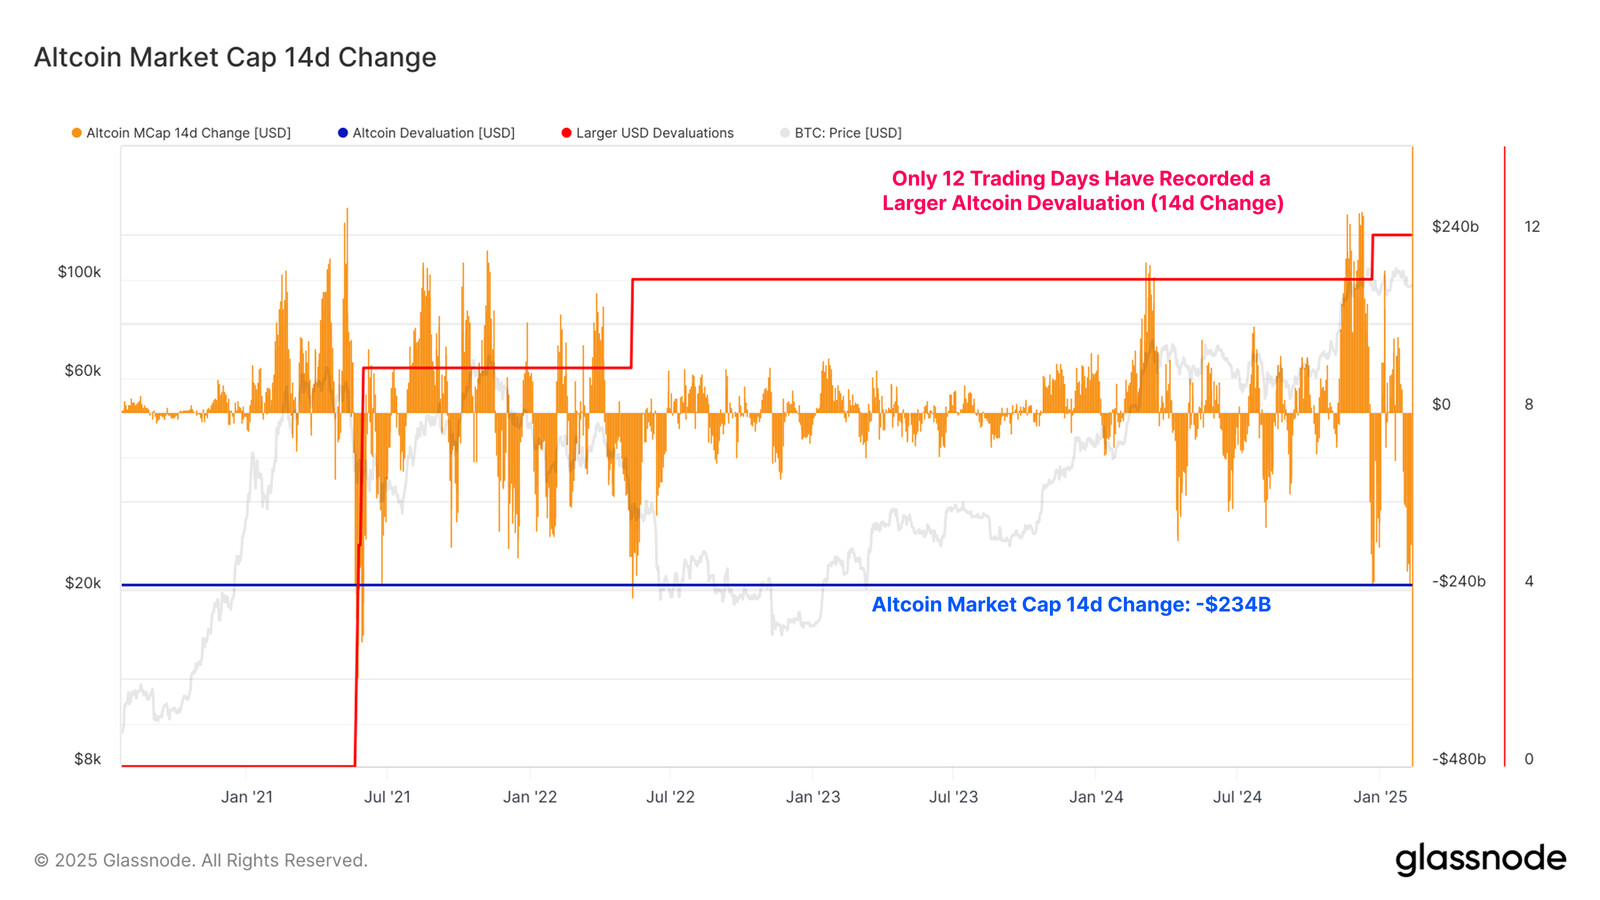
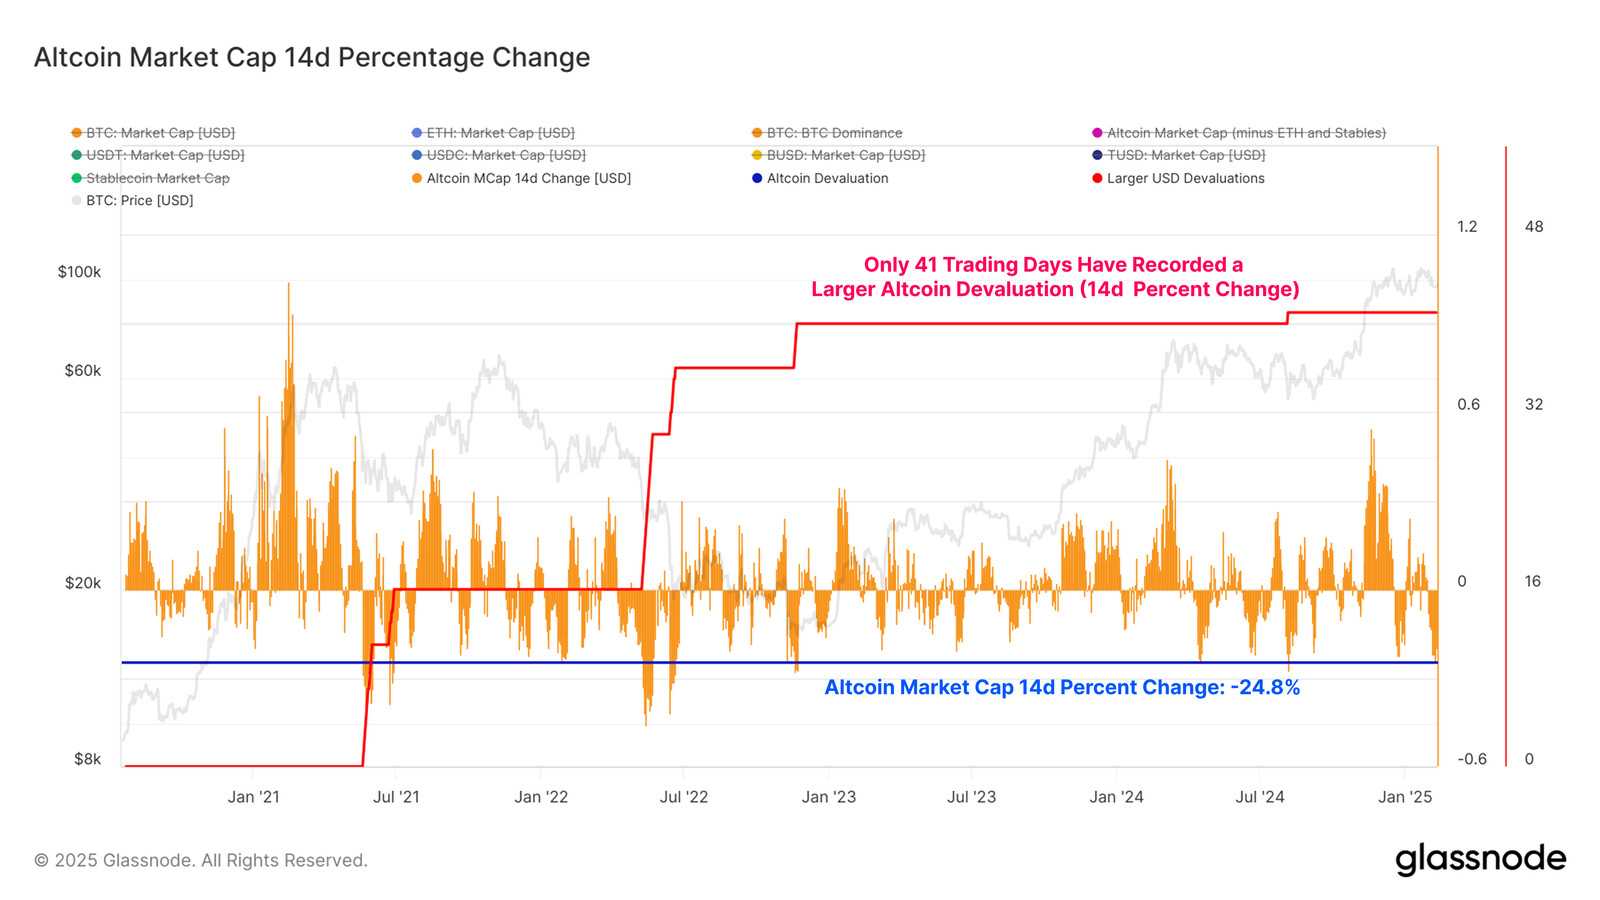
Glassnode research highlights a divergence between the performance of Bitcoin and altcoins during recent downturn
- The altcoin market cap dropped by $234B, one of the largest absolute declines.
- The % drawdown is still significant, with only 41 out of 1,662 days seeing a larger drop. However, it aligns with past 2024 drawdowns.
- Bitcoin does not appear to display the same relative weakness.
- However, Bitcoin investors also faced heavy losses, with BTC falling to $93K. Normalized losses in BTC terms show a less severe impact.
- Short-Term Holders (STHs) drove the most realized losses, totaling $520M last week.
- The STH cost basis at $92.2K is a key support level to prevent further downside.
- A “volume air pocket” below this level suggests a risk of sharp price declines if breached.


1 Like
On-Chain Market Summary February 24, 2025
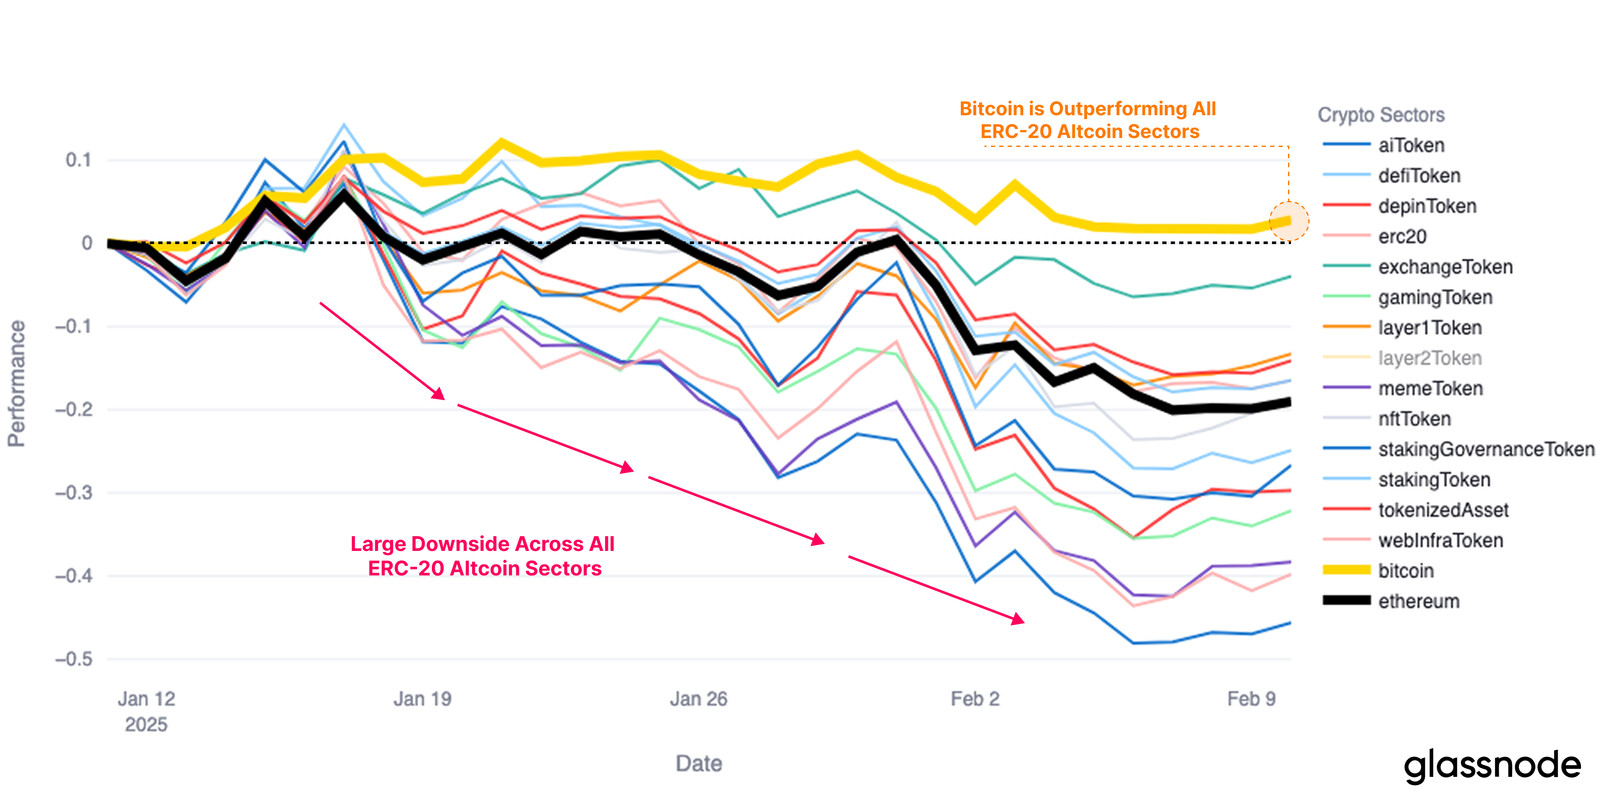
Market Overview: Bitcoin Holds, Altcoins Struggle
- Bitcoin: -5.9% (Feb 2025) after a failed attempt to break $105k in late January.
- Ethereum: -16.9% (Feb 2025), struggling to attract sustained demand.
- Solana: -33.1% (Feb 2025), despite being a leader in capital inflows over the past two years.
- Memecoins Index: -37.4% (Feb 2025), experiencing the sharpest correction.
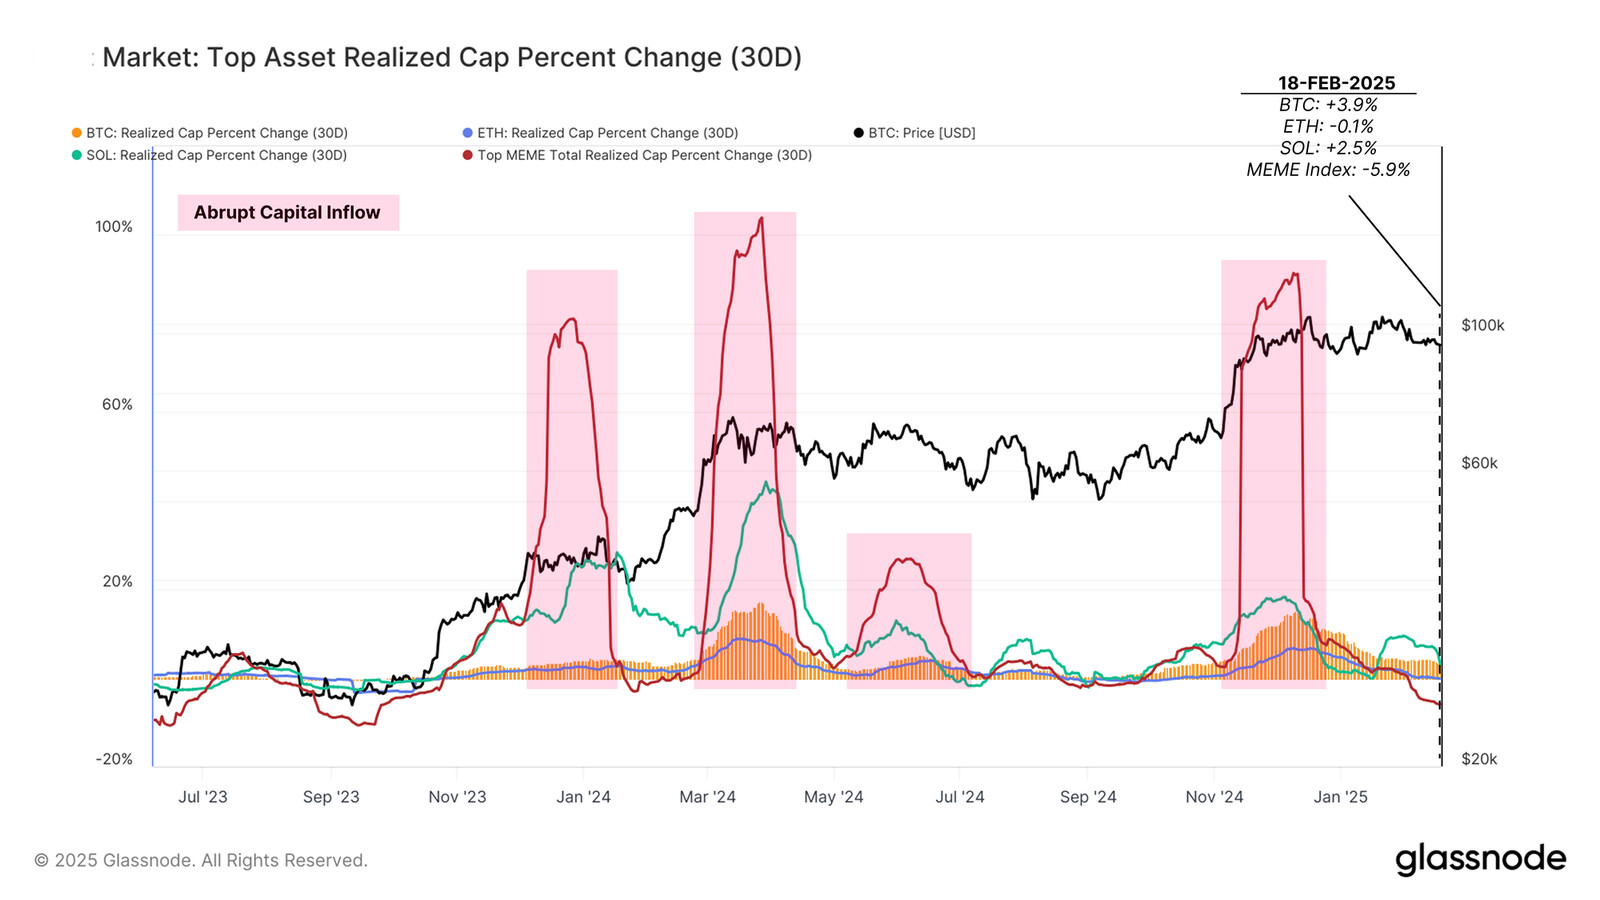
Declining Capital Flows & Market Momentum
The once-strong capital inflows into Solana and Memecoins have reversed sharply, with all major assets except Bitcoin experiencing a slowdown. Notably, Ethereum and the Memecoins Index have flipped negative in realized capital flows, indicating outflows of -0.1% and -5.9%, respectively.
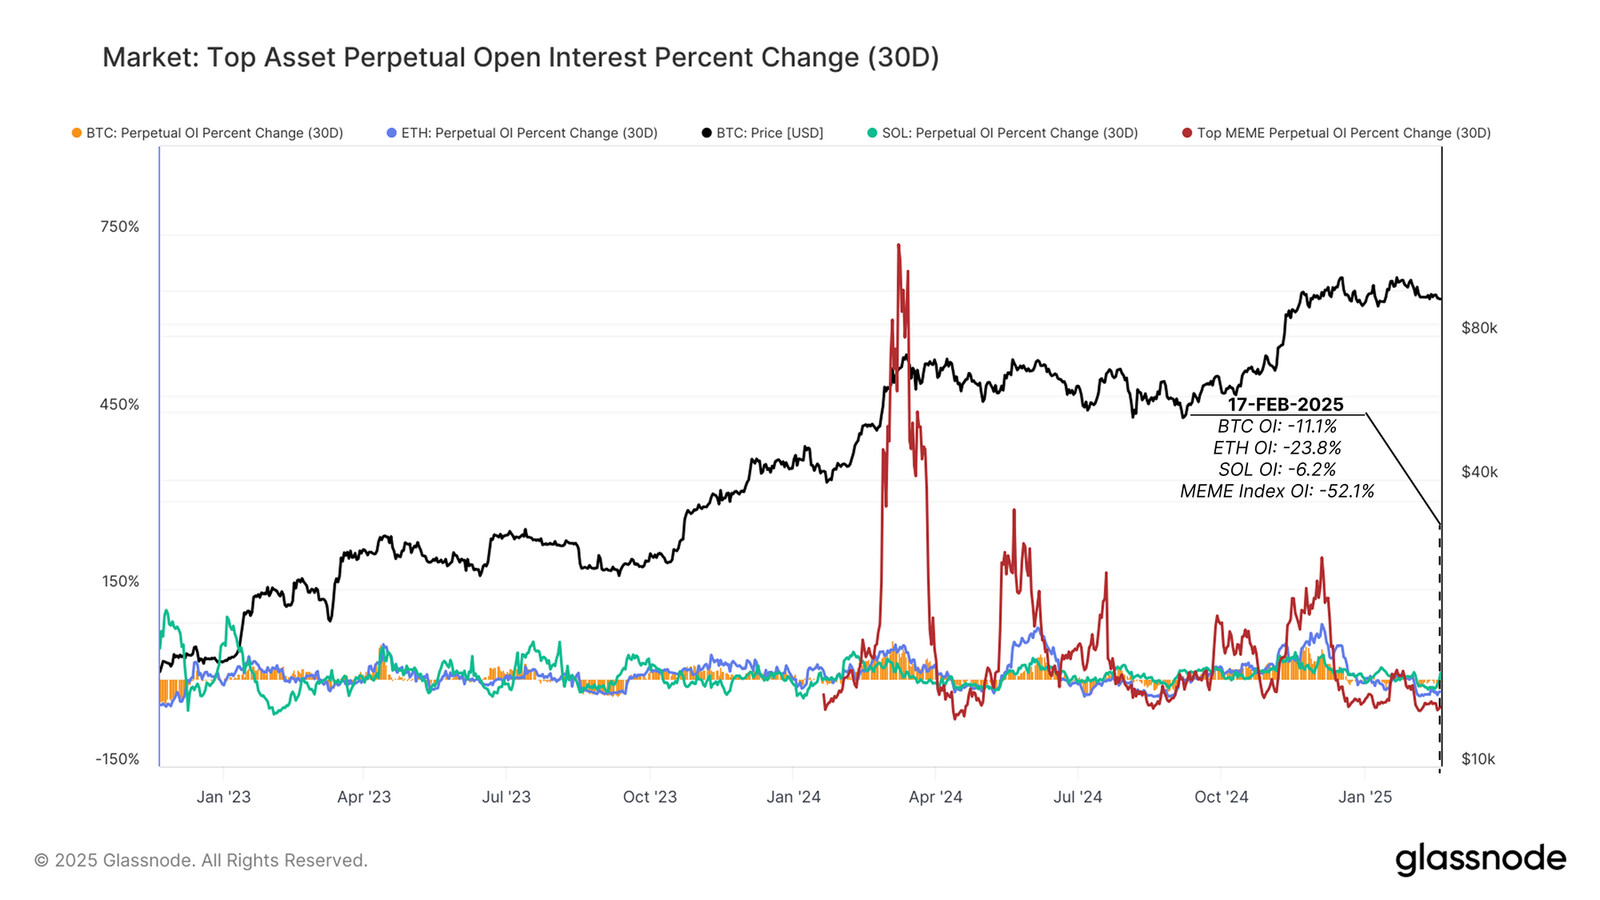
Derivatives Market Shows Weakness
During the last 30 days, the decline in speculative activity is evident in perpetual futures markets, with open interest dropping across all major assets:
- Bitcoin: -11.1%
- Ethereum: -23.8%
- Solana: -6.2%
- Memecoins Index: -52.1%
Funding rates further reinforce a bearish sentiment, particularly in riskier assets like Solana and Memecoins, where shorts are now dominant.
Key Levels & Market Risks
Bitcoin is currently trading just above its Short-Term Holder (STH) cost basis of $92.5k—a historically critical level marking shifts between bull and bear phases. If Bitcoin breaks below this level, history suggests potential downside toward $71.6k, increasing the risk of panic selling among recent buyers.
The % drops in prices and open interest is compared to when?
Sorry I was creating this on Thursday while forum was broken for me, and just realized I did not even add the source.
Price was for Feb 2025, and Open interest the last 30 days. Since the Peak the declined is larger.
Alright no worries. In the case of Feb 2025 I would maybe write in the beginning sentence something like “since 01.02.2025” or “since Feb 1” to make it even clearer that it is referring to the first day of February as comparison. (If I understood that correctly)
1 Like
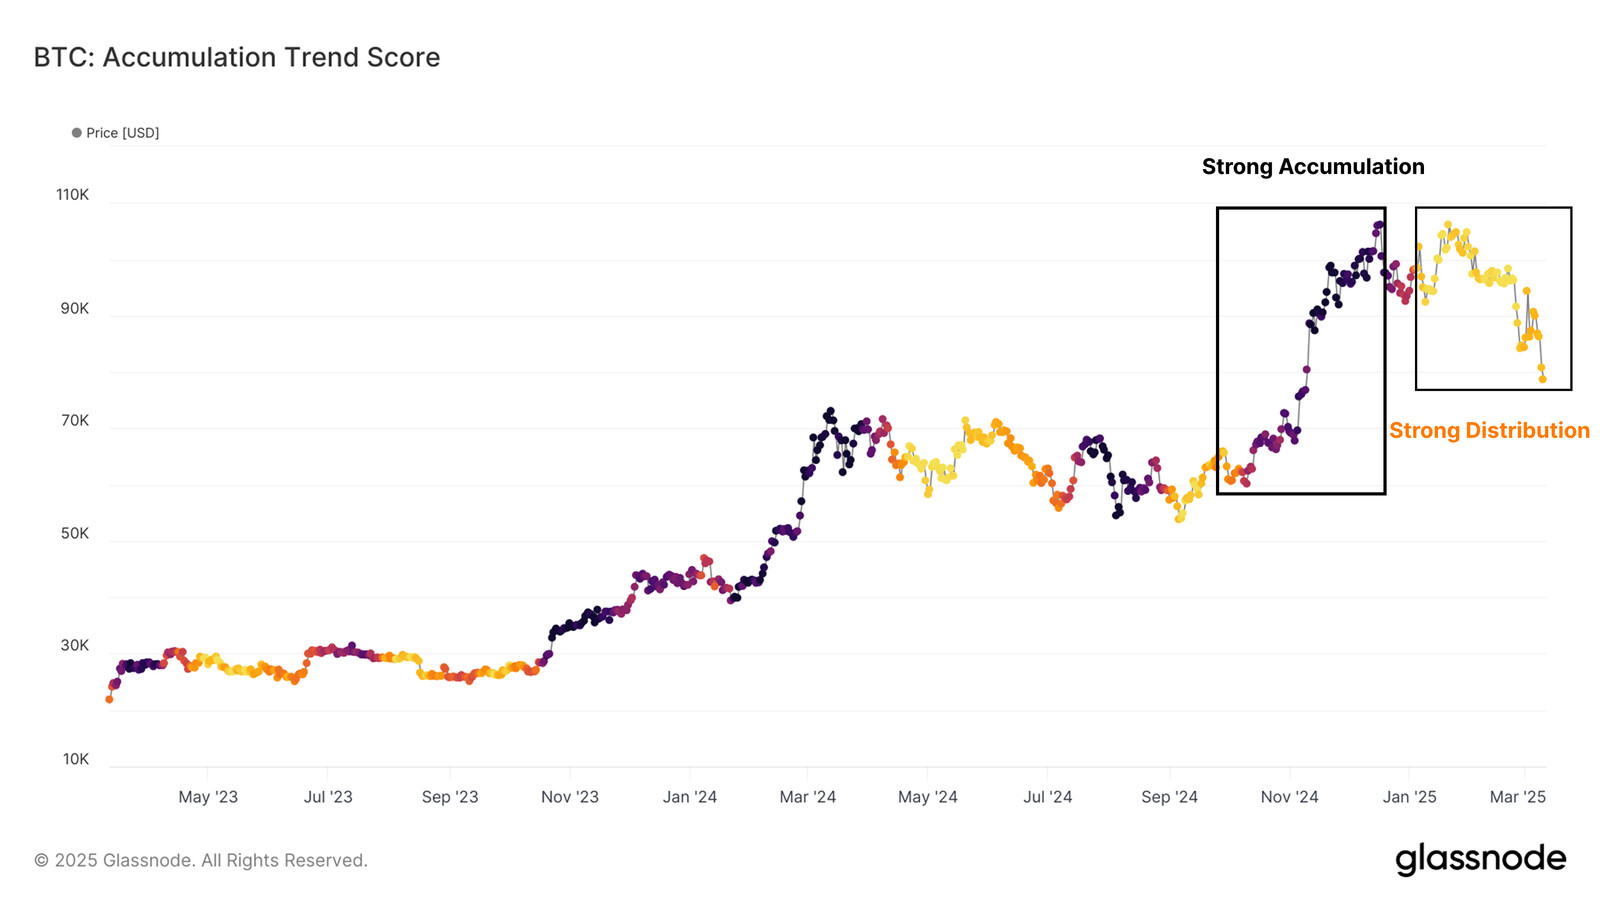
Glassnode: Post-ATH Distribution
Bitcoin appears to be in a post-ATH (All-Time High) distribution phase, characterized by persistent sell-side pressure, fading accumulation, and capitulation among short-term holders (STHs).
Notes:
- Bitcoin entered strong investor distribution in early January, with the Accumulation Trend Score confirming sell-side pressure.
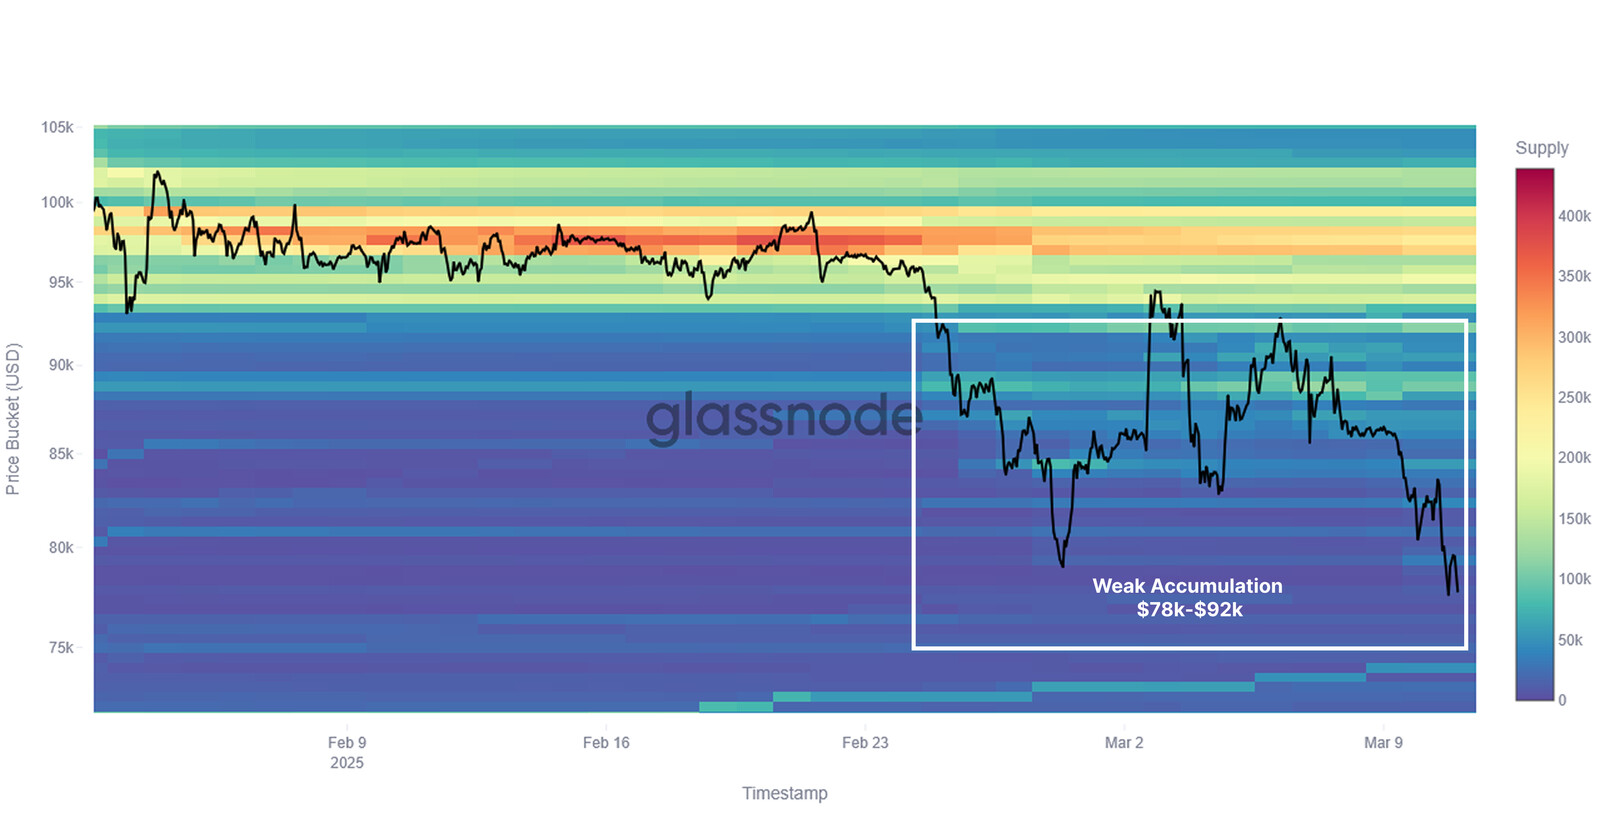
- By late February, tighter liquidity and external risks like the Bybit hack and U.S. tariff tensions weakened accumulation confidence, keeping prices below $92K.
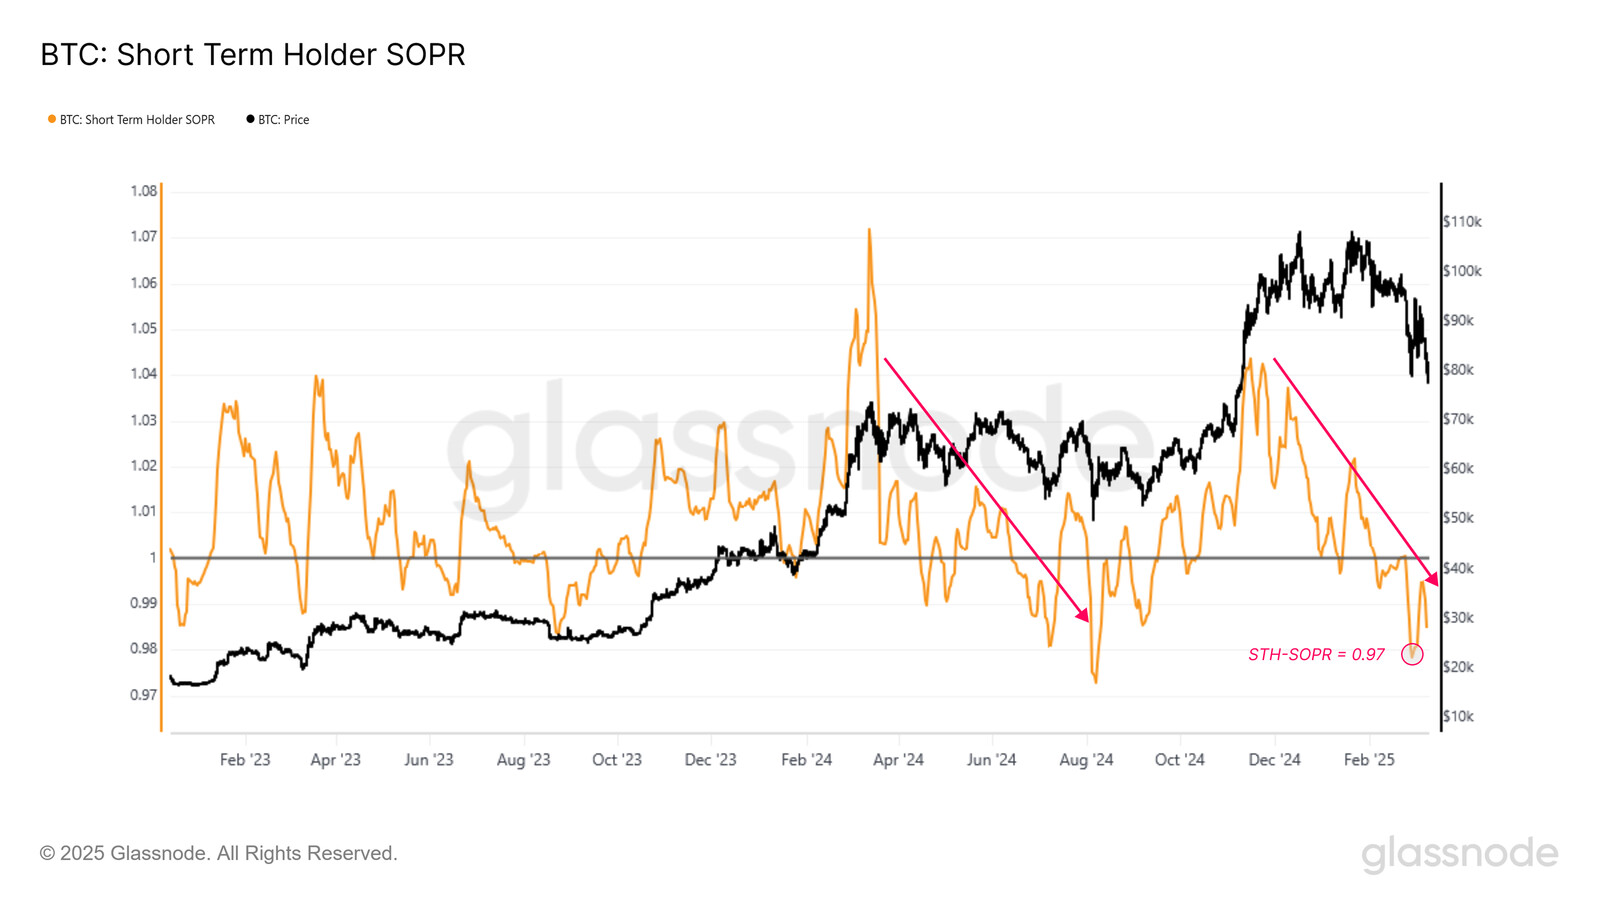
- Panic selling intensified, with STH-SOPR dropping below 1, signaling fear and realized losses.
- As Bitcoin fell below $95K, net capital outflows emerged, with short-term cost bases flipping bearish.
- The lower bound, where STHs face heavy losses, sits between $71.3K and $91.9K, aligning with a key liquidity gap and potential support.
Glassnode: Liquidity continues to contract across on-chain and spot markets, with net capital inflows grinding to a halt, and exchange inflows slowing down.
Bitcoin Focus
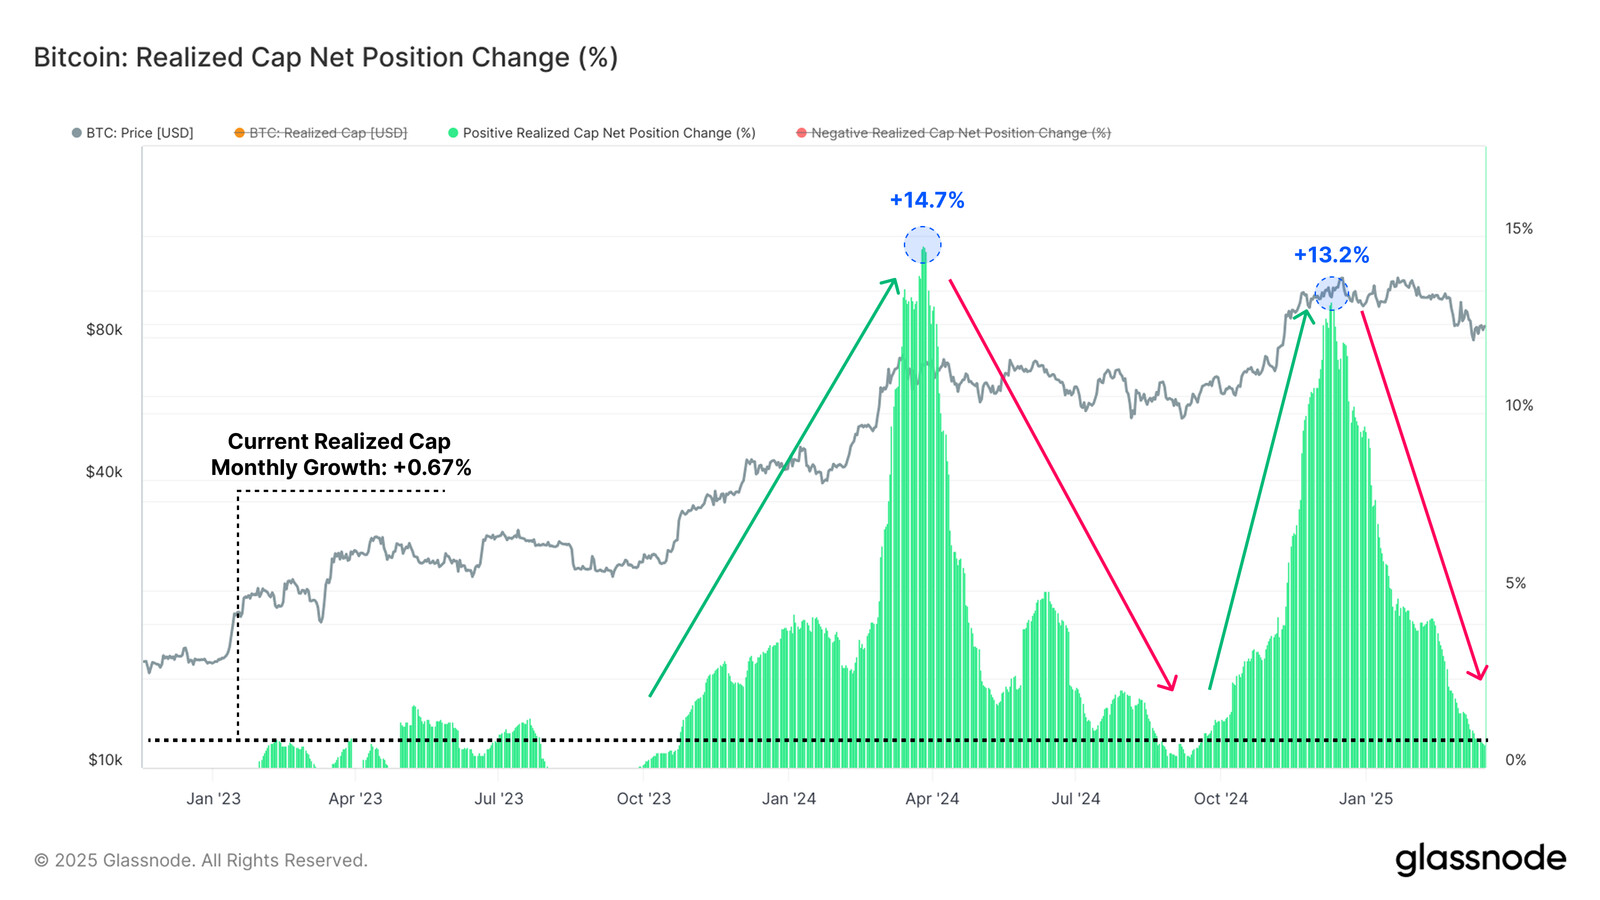
- Net capital inflows slows, the Realized Cap growing at a rate of only +0.67% per month.
- Current wealth held by the Hot Supply cohort has declined from 5.9% of the circulating supply, to a value of just 2.8%
- Inflows across all exchanges have declined from +58.6k BTC/day at the market peak to the current value of +26.9k BTC/day, a decline of over -54%.
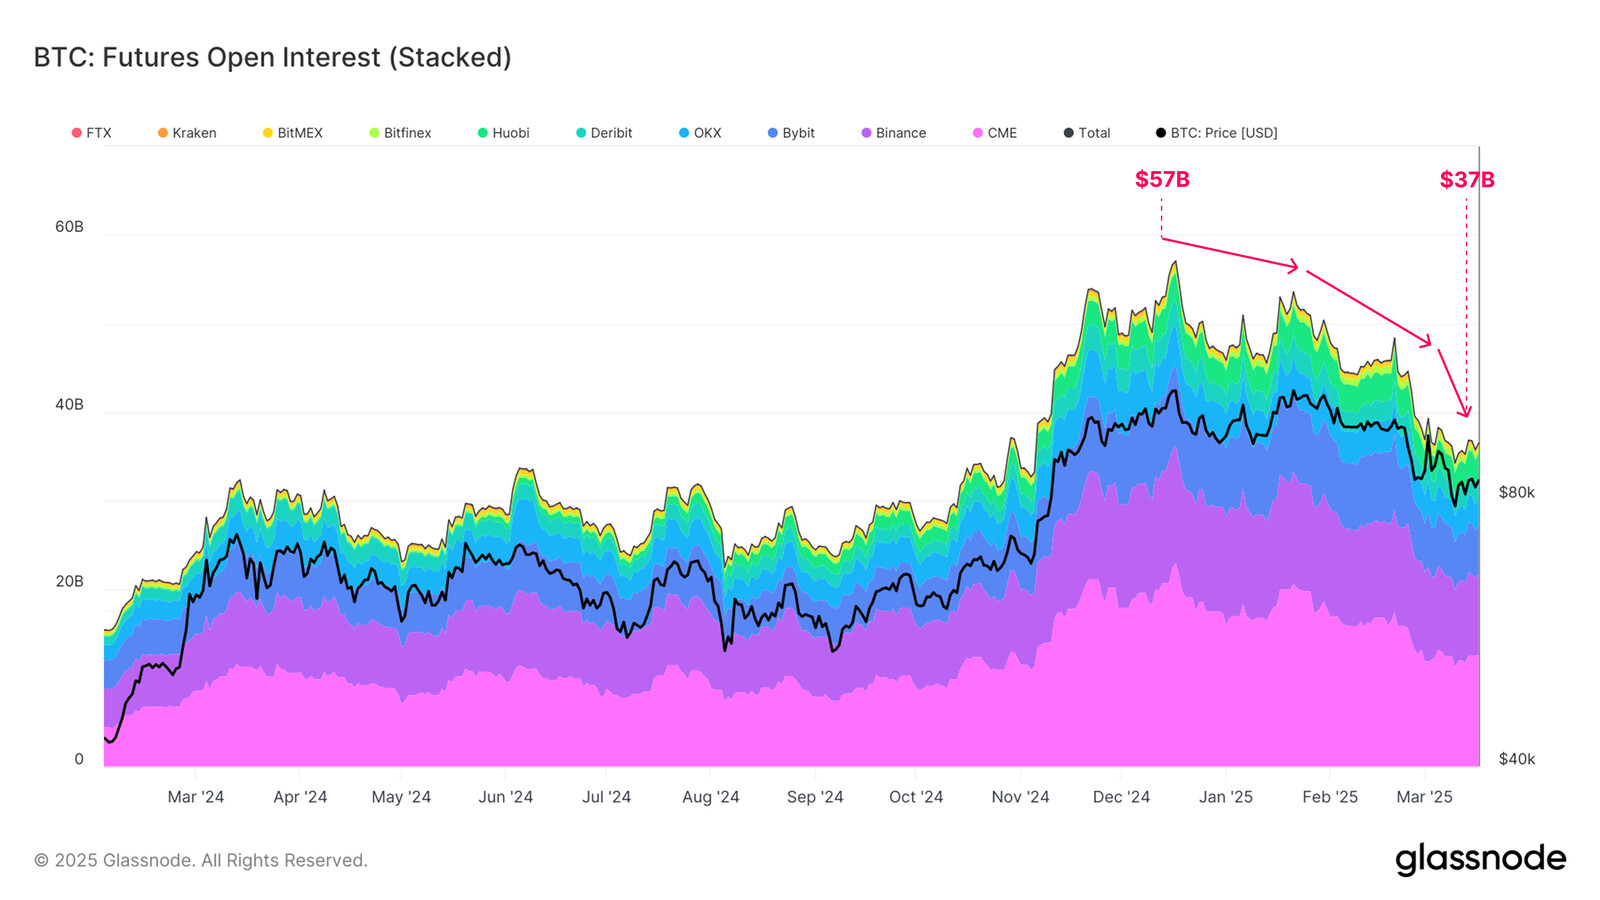
- Open interest has declined from $57B at the market ATH, down to a current value of $37B (-35%).
- Currently, we can observe a higher premium exists for puts, suggesting that downside protection is comparatively more expensive.
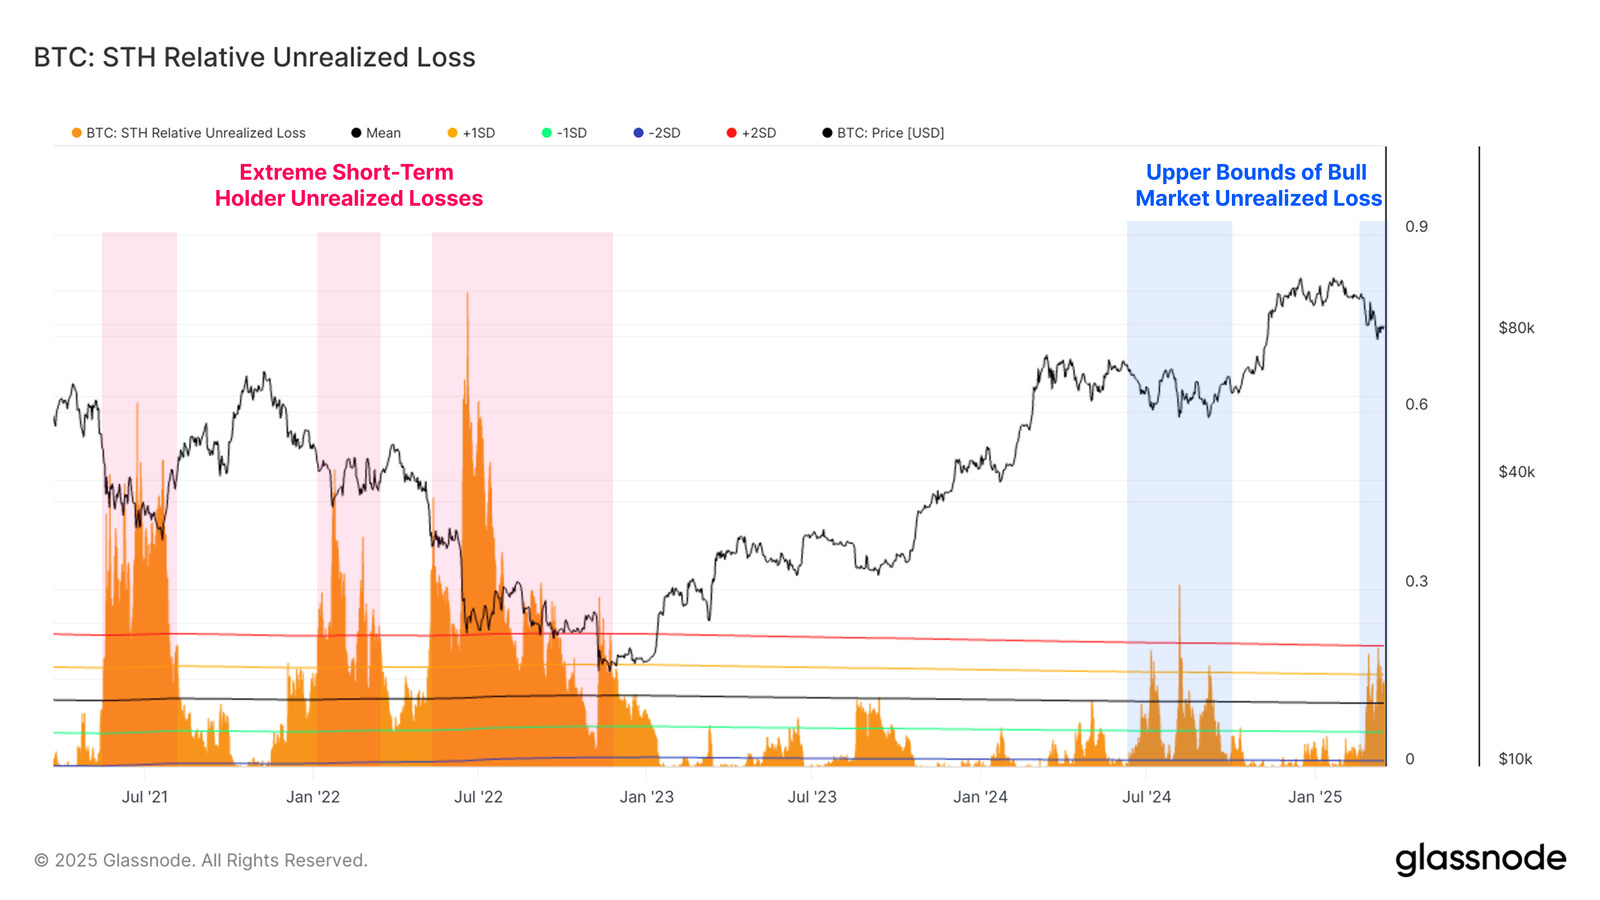
- Current sell-off representing the largest sustained loss-taking event of the cycle for short term holders ($7B).
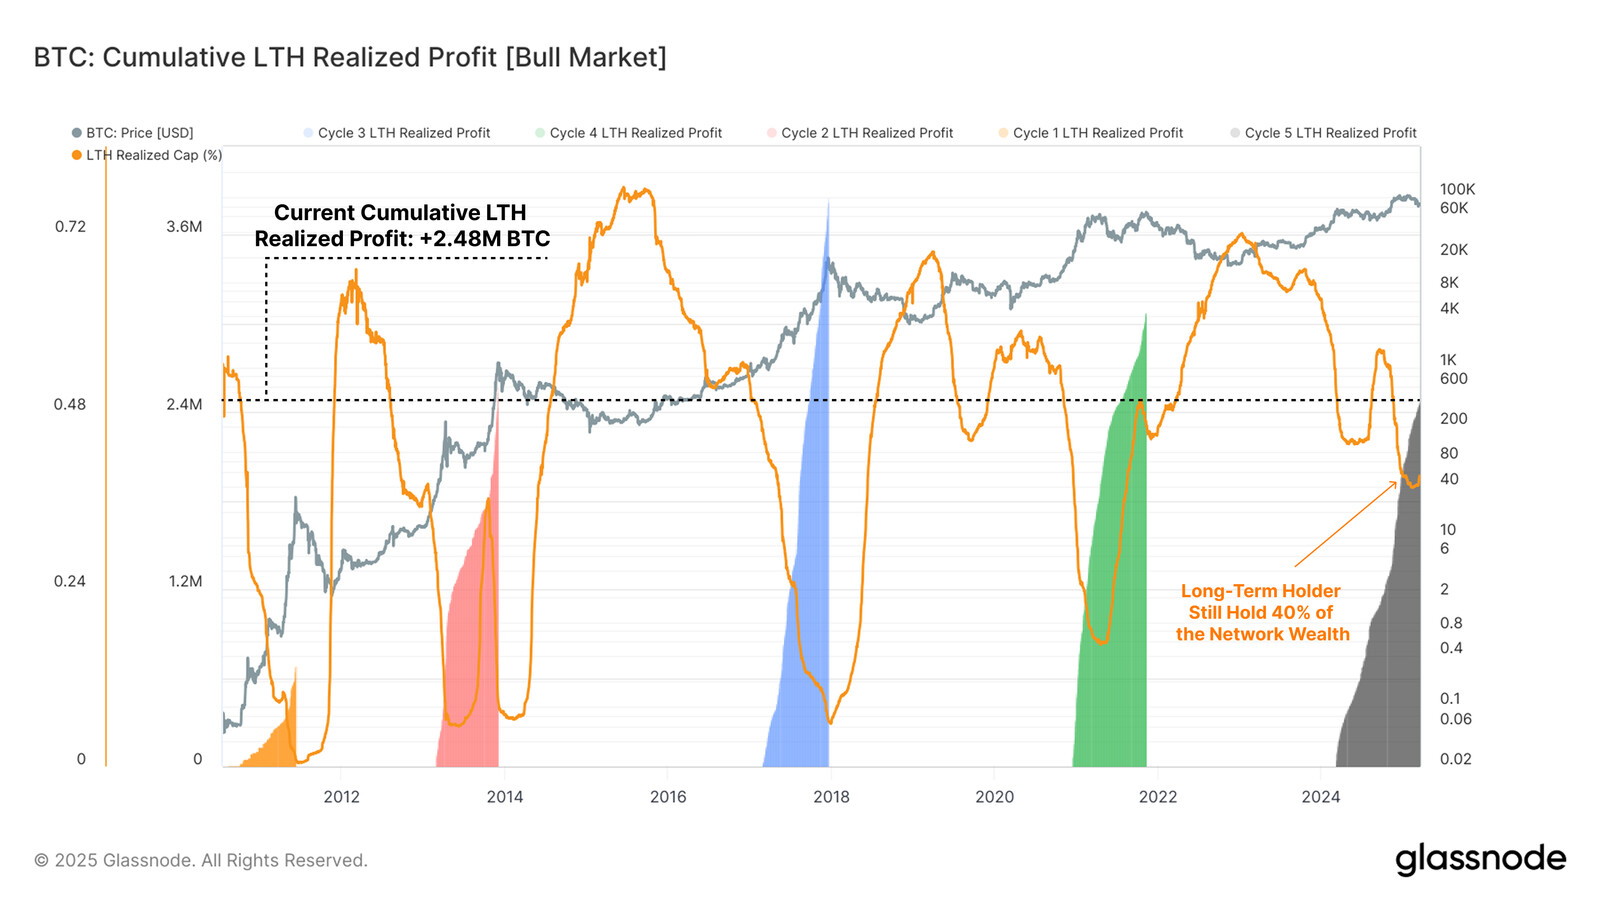
- Long-Term Holders could have completed a majority of their sell-side activity within the current price range.