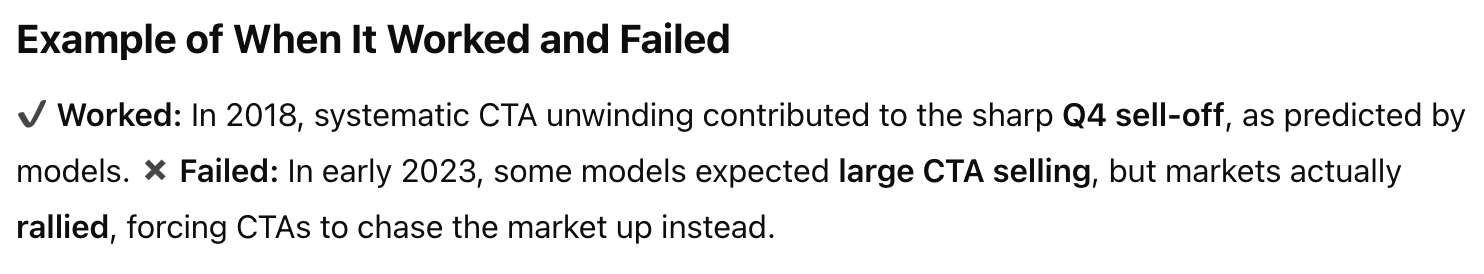
CTAs, or Commodity Trading Advisors, are professional investment managers that use futures contracts, options, and derivatives to trade in financial and commodity markets. They are regulated by the Commodity Futures Trading Commission (CFTC) in the U.S. and are often structured as hedge funds with systematic or discretionary trading strategies.
CTAs manage a relatively small fraction of the global financial market’s assets. However, despite their smaller size, CTAs can still have a significant impact on specific markets, especially those involving futures and commodities, due to their specialized trading strategies and active participation.
Importance of CTAs
CTAs play a critical role in liquidity provision, risk management, and market trends. Their importance can be seen in several areas:
Diversification for Investors
CTAs typically follow trend-following strategies, which means they can perform well in volatile or declining markets.
Institutional investors use CTAs for portfolio hedging and to gain exposure to commodities, currencies, and bond futures.
Market Liquidity and Efficiency
Since CTAs actively trade across multiple markets, they enhance liquidity, reducing spreads and improving price discovery.
Systematic Risk Management
Many CTAs use quantitative models that react to economic data, interest rates, and global events, helping smooth out market inefficiencies.
CTA Moves as a Market Signal
CTA liquidations (forced unwinding of positions) can cause sharp price movements in both directions.
Crowded CTA positioning can lead to vulnerability to trend reversals.
Their trend-following nature means they exacerbate existing trends—if markets are rallying, they keep buying; if markets are selling off, they keep selling.
CTAs Selling Matters?
CTA selling often fails to signal broader market sell-offs for several key reasons:
1. Systematic vs. Discretionary Selling
CTAs primarily use trend-following algorithms, meaning they react to price movements rather than forecast them.
When markets experience a small decline, CTAs may start selling, but this doesn’t necessarily mean that fundamental investors (e.g., pension funds, mutual funds) will follow.
If discretionary investors see value in buying, they can counteract CTA selling, preventing a broader downturn.
2. CTAs Have Limited Market Share
While CTAs can influence futures and derivative markets, their total assets under management (AUM) are relatively small compared to broader equity or bond markets.
Even if CTAs reduce exposure, larger institutions such as sovereign wealth funds, pensions, and mutual funds may step in as buyers, absorbing the selling pressure.
3. Selling is Often Gradual, Not Sudden
Unlike hedge funds or retail traders, CTAs often adjust positions incrementally based on moving averages and volatility.
This slow, systematic selling can lead to drawdowns in specific assets but doesn’t necessarily cause panic selling across the broader market.
4. Impact is Stronger in Futures, Less in Spot Markets
CTAs are heavily involved in futures trading, which means their selling influences futures contracts more than the underlying stocks.
If futures markets decline, but spot buyers remain active, the broader market can stabilize despite CTA selling.
5. Risk-Reduction Adjustments Rather than Conviction-Based Selling
CTA selling is often driven by risk models, rather than a belief that the market is fundamentally weak.
If volatility increases, CTAs may reduce their exposure as part of risk management, but this does not mean that discretionary investors share the same bearish outlook.
6. Trend-Following Nature Can Reverse Quickly
CTAs tend to exacerbate existing trends but also flip back to buying once momentum shifts.
If a sell-off loses steam, CTAs may reverse course, adding back long positions, reducing the chance of a prolonged market decline.
When Does CTA Selling Matter?
CTA-driven declines are more impactful when:
Liquidity is low (e.g., holiday periods, pre-Fed meetings).
Other market participants join the selling (e.g., hedge funds de-risking at the same time).
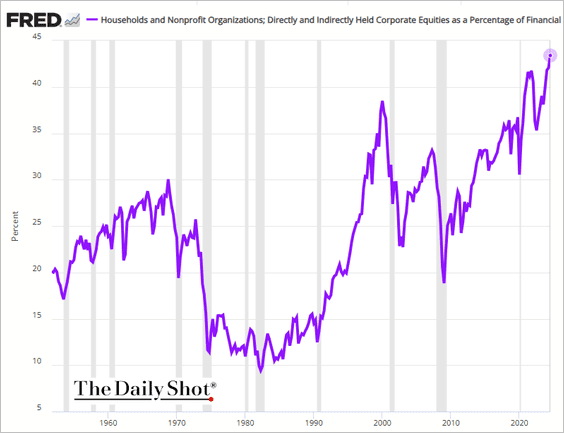
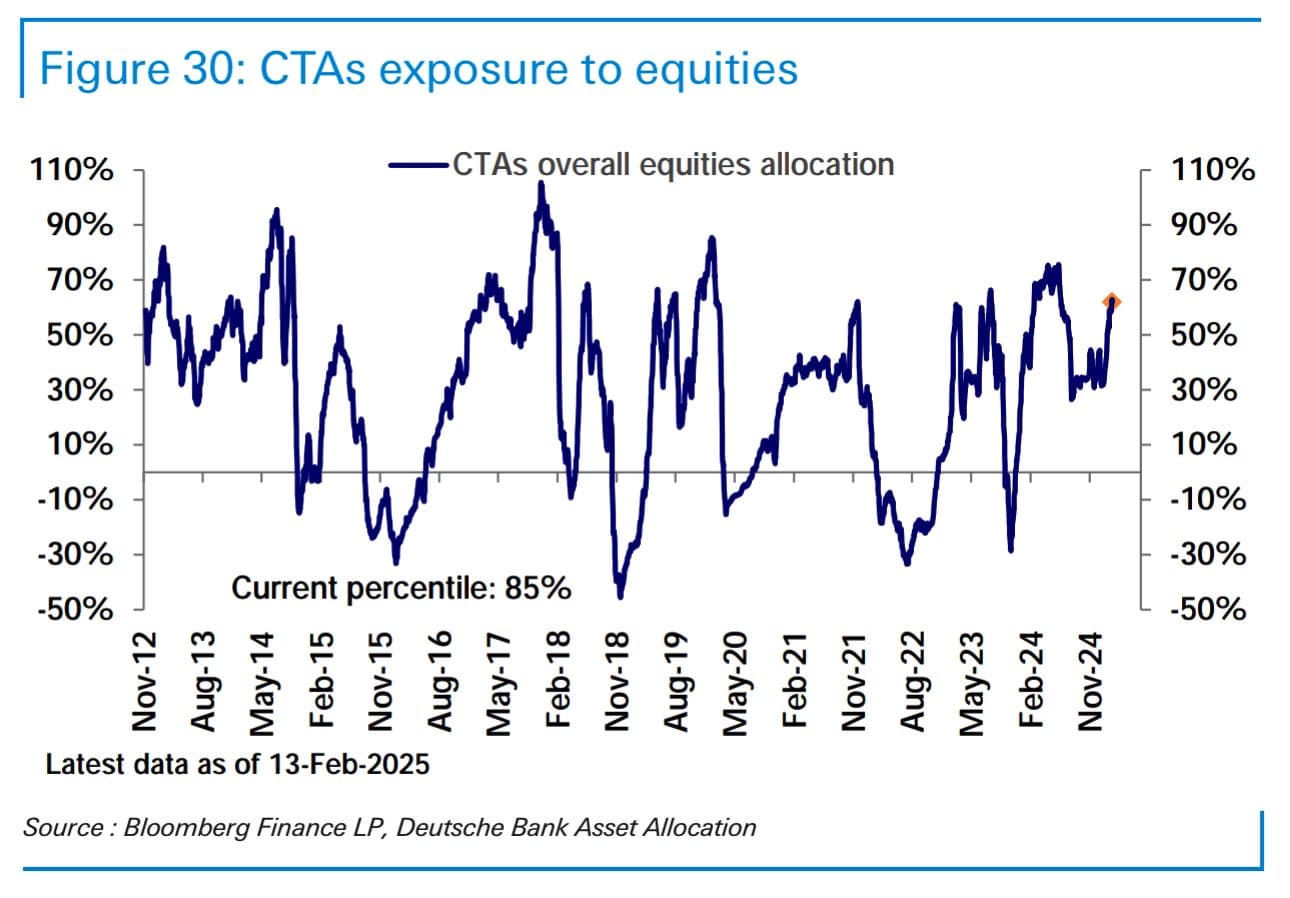
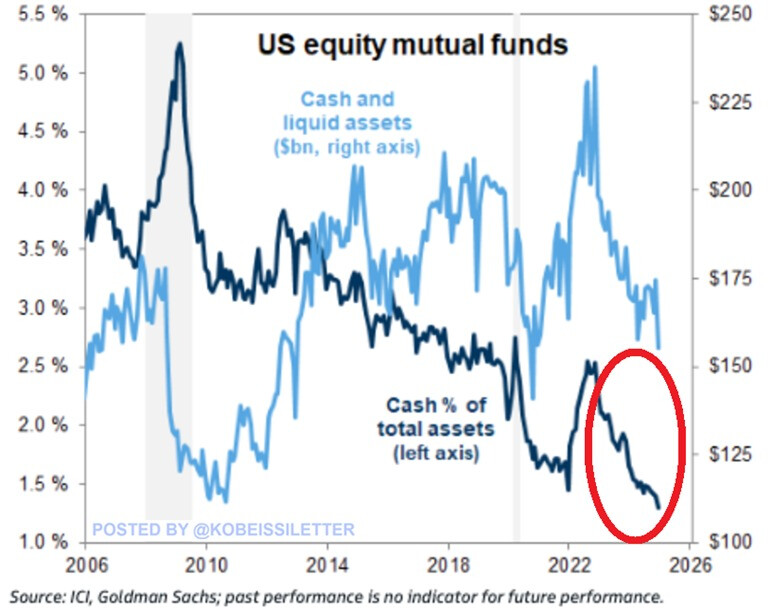
Equity Positioning was extreme in CTAs, Equity Mutual Funds and Households
Due to this I think if bad sentiment continues with upcoming data we could see a singificant market correction.
Overall I feel we need to be more up to date on positioning of different actors, and implied market pricing for growth and inflation. Because extreme sentiment accompanied with some unexpected news could create a significant headwind/tailwind,despite the economic conditions still seemingly relativily ok (with some risk on the hirizong like Trump policies).
The downside if that this type of data is not free, and only shared once in a while in news or X.
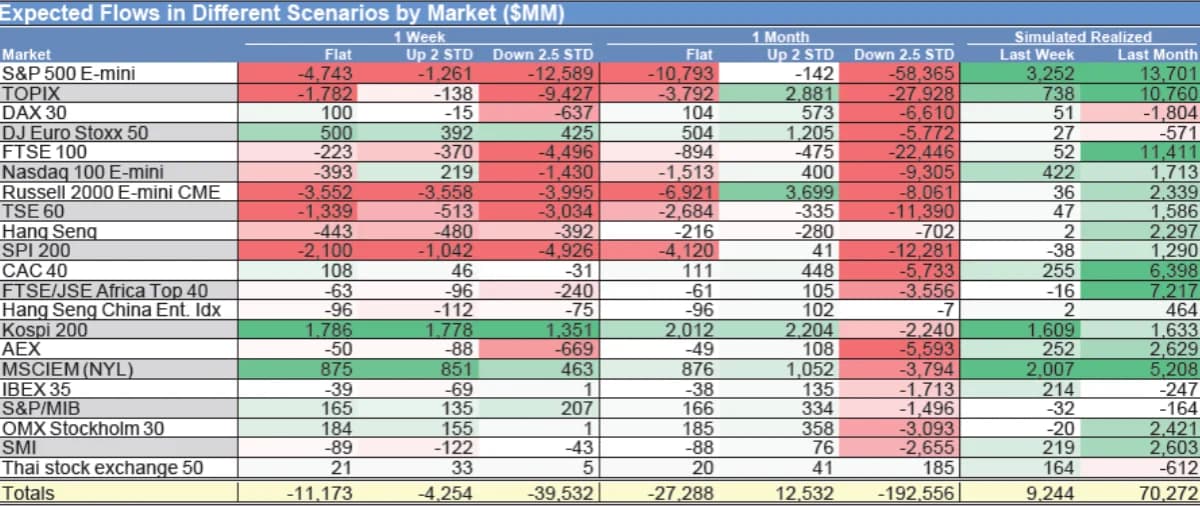
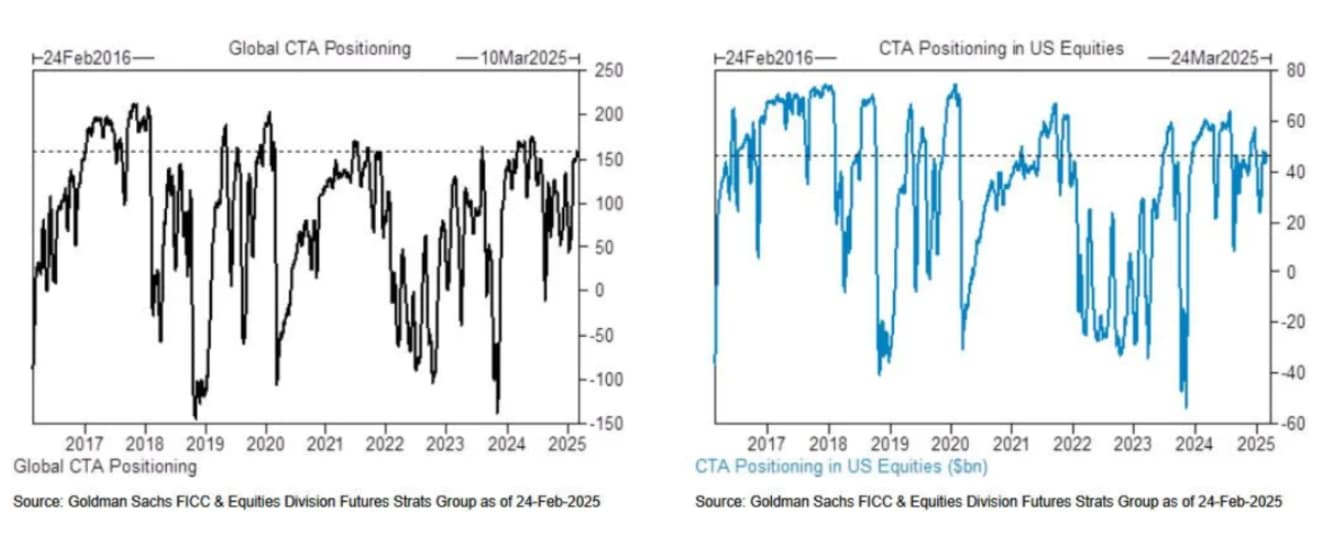
According to Cullen Morgan of Goldman Sachs Group, after a global buy of 9 billion dollars’ worth of stocks last week, the size of CTA’s Global Equity long positions reached 158 billion dollars (90th percentile). Now they have started to sell. They will be sellers in most scenarios next month.
In the next month:
Flat: Sold 27 billion dollars (including Sell 11 billion dollars of S&P 500 Index)
Yes I 100% agree. Understanding the positioning of all actors is extremely important. Unfortunately, I am not experienced with future & option markets and insights we can derive from them, but this is a capability I wanted us to build for a long time. I know that you are very busy at the moment but here are a few thoughts for a project how we could tackle this long-term.
I think as a first step we would need to study which kind of insights we can get and how definitive conclusions are. Let’s take the predictions in the linked model of Cullun Morgan of Goldman Sachs for example. I have no idea how reliable they are but what we could do is looking if Futubull or he himself published his models in the past as well and see how well they matched with actual outcomes. Just by searching his name on Linkedin he appears a bit junior to me but i assume that he is using models of Goldman Sachs which have been refined over decades.
What we could also do is researching more deeply how well those CTA models work in general to get a better understanding if and how can use them.
The below is what GPT told me in a quick search but i did not investigate further how reliable this is either.
It also stands out to me that CTA positions have been very volatile in the past seemingly without influencing the market a lot. This leads me to believe that we first need to establish very strong foundations, how large future and spot volumes are, and get an understanding how easily these markets could absorb let’s say 100 billion under normal circumstances.
The fact that CTA positions often have been high in the past and then dropping without causing a large sell off in the market gives me some ease.
Getting retail sentiment in an accurate way would always be very valuable as well. What exactly is your first chart referring to? (there is no link and the description is cut off)
From my perspective no any single indicator will be always 100% accurate, so I see it in terms of if certain indicator increase o decrease the probably of something happening. And that the confluence of several indicators is what we are looking for.
I have noticed that especially in bull markets, extremes can always get more extremes as long as there isn’t any negative catalyst. So that’s probably why in some cases CTAs selling pressure does not lead to a significant selloff?
For me, overvaluation metrics, high equity exposure, extreme retail optimism, and CTA selling pressure don’t necessarily can predict an imminent correction. Instead, they only indicate that the probability of a correction increases if a negative news surprise occurs, since expectations are already elevated and pricing in near perfect conditions or viceversa.
The severity of any correction will then depend on the intensity of the negative news or the accumulation of multiple news developments.
So, when I see these metrics signaling strong selling pressure, my view is that only if macroeconomic and geopolitical developments continue to generate negative sentiment and heightened uncertainty, leading markets to keep adjusting their expectations, there is still room for further correction, as exposure remains was very high for most participants.
Please let me know if this makes sense, and inline with what you think? Or what I am missing from your perspective?
I am trying to understand and learn this dynamics myselft because before I did not put too much emphasis on understanding market movements.
But for sure I have noticed that sometimes economic conditions don’t have anything to do with it, and is sometimes mostly expectations markets create.
When I have to time I could start to map the details of the project.
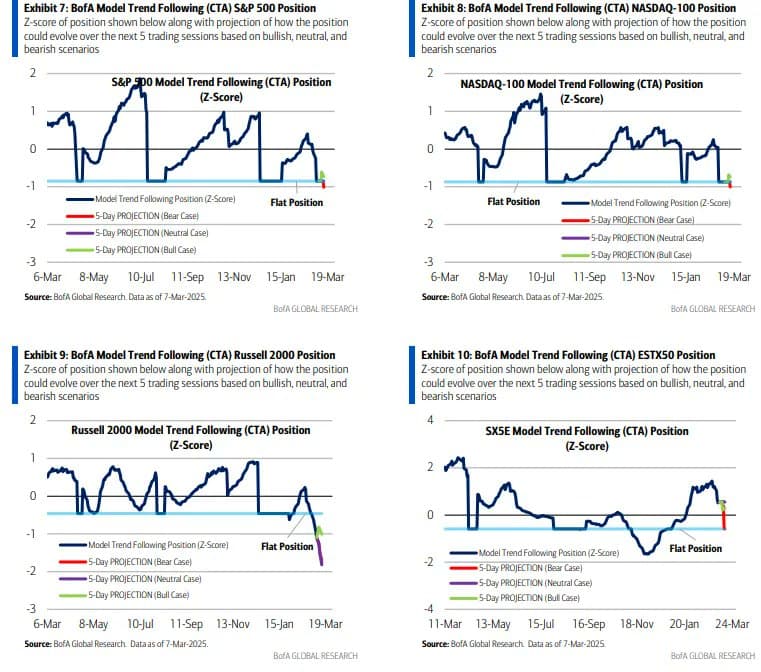
CTA Sellling Preassure could be over if market stabilize this week
Looking at CTA (trend follower) US equity positioning, BoA says that according to their models “[t]hree straight weekly declines have left the NASDAQ-100 and S&P 500 near correction territory and by now we’d expect trend followers to have significantly reduced long positions in each. However, we don’t expect shorts at this point in either [ $SPX or $NDX] as CTAs tend to use moving average crosses (and not spot) to determine price trend. If so, then the one-month moving average would need to come in a bit more to cross below medium and longer-term moving averages. Should both indices decline further or stay at current levels, then we could see trend followers start building shorts in about a week’s time.”
So, it looks like we might get some relief from CTA selling in the upcoming week, but an inability to bounce this week could lead to more selling next week it seems. Of course, there’s now much more room for buying if we can get a sufficient rally with positioning. It looks like they’re already short the RUT though, so the “base case” is that continues meaning likely more relative pain for small caps. Price trend while weak across the board ex-Europe is now the strongest for the $NDX at 26% down from 48% last week while $SPX is down to 26% (from 49%), while the $RUT has fallen to -40% from -6%. #Japan’s #Nikkei225 also dropped to -19% from -4% while the Euro #Stoxx50 eased off last week’s 95% (and 99% the week before that) to 82%.
Goldman on Friday had a similar take as BoA on the potential for CTA selling to dry up this week if losses remained contained
“CTAs have sold 47bn global in the last week. Our calculations show 1w flat tape = 40bn to sell // 1m flat tape = 43bn to sell. The fact that the “flat tape” sell expectations over a month and over a week are almost the same, means that with spot here - this technical supply will be largely finished by next week.”
In my opinion the key skill and principle is to figure out what is signal and what is noise. (I think I have a relatively good understanding for that on companies and that’s the main reason that made me successful)
There can be a lot of indicators which don’t matter a lot and one that really matters. So it is your job to determine what is important and what is not and then draw my attention to things that are really important while being able to explain well why.
Obvs. this is way harder but I think this is really needed so that you cannot only present me with indicators but with strong conclusions and assessments that have a good level of confidence. (And this is what I need to be time efficient)
In general I obvs agree that a lot of factors form a picture together but if we cannot weight those factors correctly it’s hard for us to predict what is going to happen
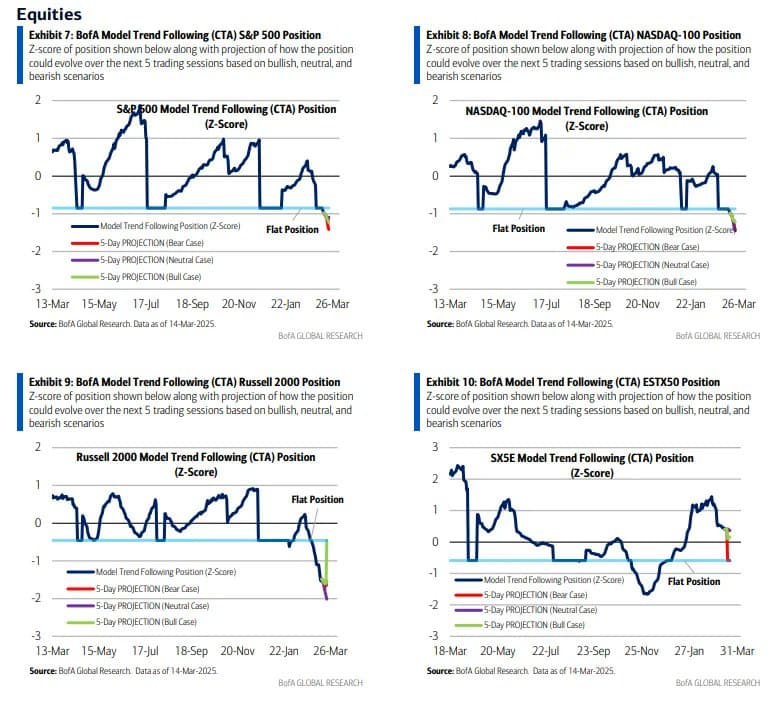
CTAs starting to add shorts positions as of March 14, 2025
BoA says while “its been just 17 trading days since the S&P 500 and NASDAQ-100 reached their last new all-time highs,” after “four consecutive weeks of declines, our model (which is based on both short-term and longer-term price trend) indicates that trend followers are now adding short positions in these markets. Friday’s gains did little to slow the growth in shorts as a single day’s returns carry little weight in a CTA’s moving average crosses which determine allocations. In our view, trend followers are likely to add to shorts regardless of price action next week as price trend continues more negative. In other markets, our model projects that Russell 2000 and Nikkei 225 shorts are likely to grow next week.” So, it looks like we’re not going to get any relief from CTA selling in the upcoming week consistent with last week’s note that “an inability to bounce this week could lead to more selling.” The positive side is that as I mentioned “[o]f course, there’s now much more room for buying if we can get a sufficient rally with positioning.” But that’s going to take more than one or two days of rallying at this point. Price trend has fallen sharply to negative across the board for US indices with the $NDX at -10% from +26% last week (and +48% two weeks ago) while $SPX is down to -12% (from 26% and 48%), and the $RUT has fallen to -72% from -40% and +2%). #Japan’s #Nikkei225 also dropped to -41% from -19% and -4% while the Euro #Stoxx50 continues to ease off last the 99% three weeks ago to 73%.