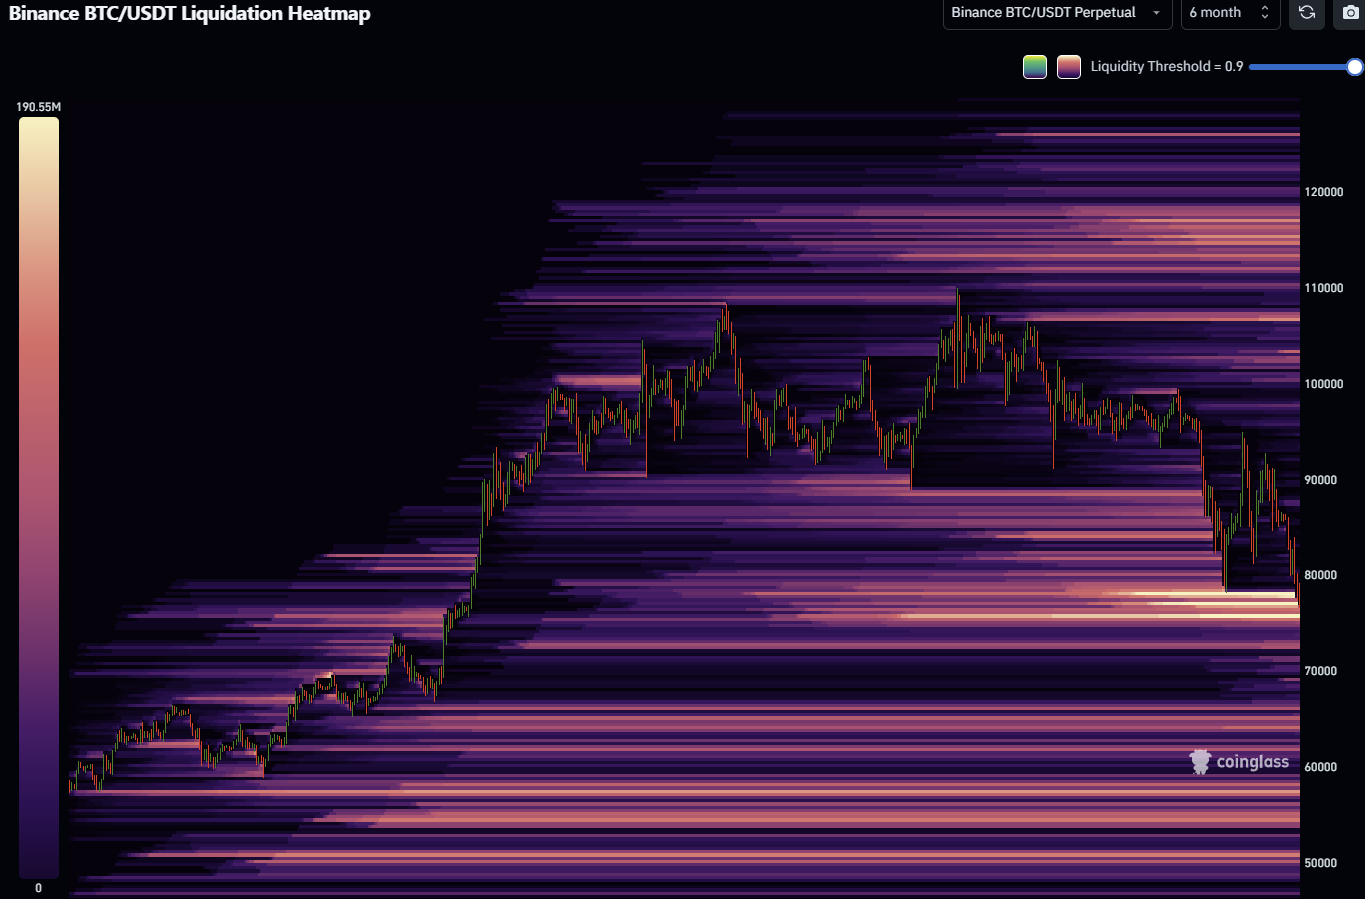
A Bitcoin liquidation heatmap is a visual tool that displays the levels where large amounts of leveraged Bitcoin positions (longs or shorts) are likely to be liquidated. It helps traders understand potential price zones where significant buying or selling pressure might occur due to the forced closure of these positions.
 How It Works:
When traders use leverage (borrowed funds) to increase their position size, they face liquidation if the price moves against them. The heatmap highlights areas with a high concentration of potential liquidations based on open interest and margin data.
 What It Shows:
- Hot Zones (High Liquidation Areas): Bright or warm-colored areas indicate price levels where a significant volume of liquidations is likely.
- Cold Zones (Low Liquidation Areas): Dark or cool-colored areas show where fewer liquidations are expected.
- Long vs. Short Liquidations: Some maps distinguish between long and short liquidations using different colors.
 Why Traders Use It:
- Identify Key Support and Resistance Levels: Large liquidation zones often act as magnets for price movement.
- Predict Volatility: Sharp moves often occur when price reaches major liquidation clusters.
- Improve Trade Timing: Helps traders anticipate where stop-hunts or liquidation cascades may happen.
- Risk Management: Avoid entering positions near large liquidation areas to minimize exposure to sudden price spikes.