I have focused for now on mostly analyzing the Auto industry mostly during the 2008 recession. These are some of the conclusions I have been able to reach for now:
Summary
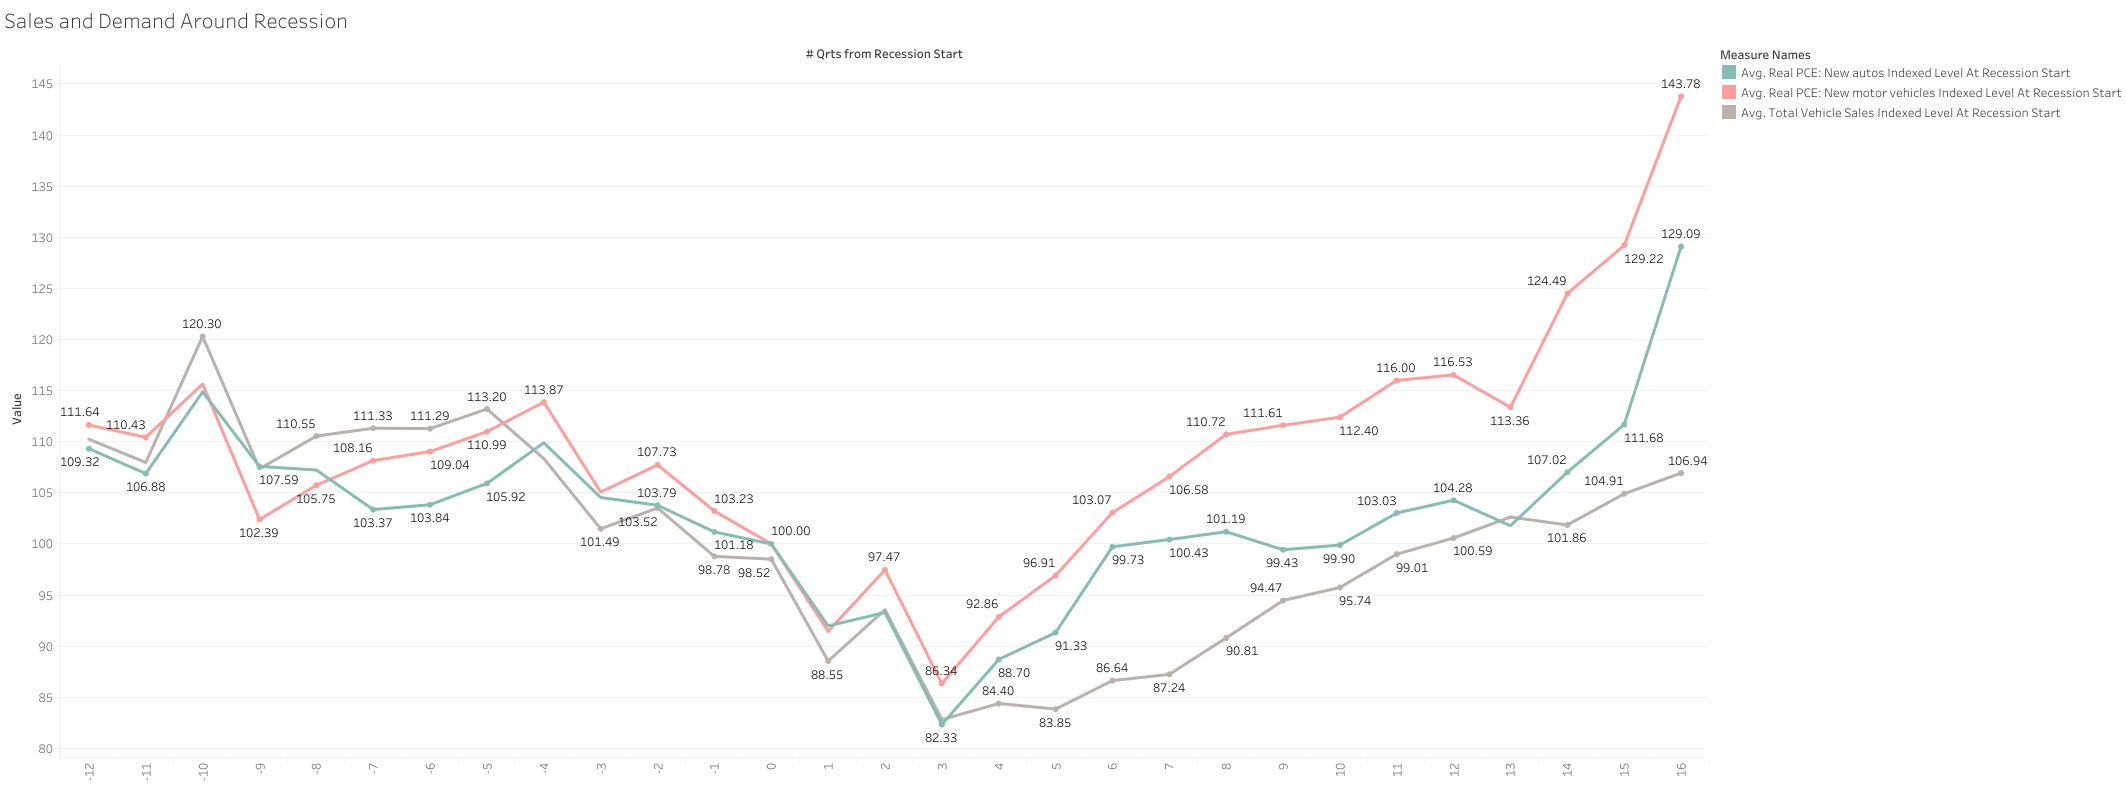
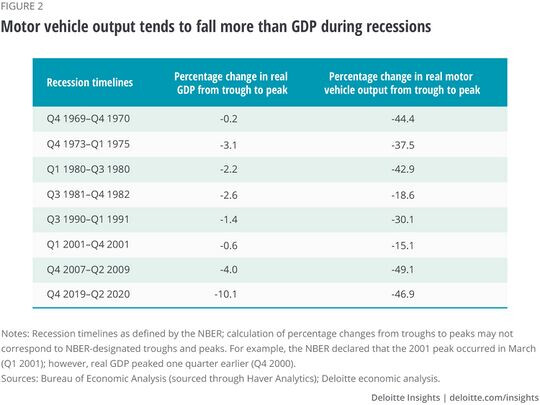
- The magnitude of the decline in the auto sector was much greater than the overall economy, and also more volatile.
- Sales weakness started before the recession, but it as expected intensified after it.
- Inventories and production are only adjusted after the sales weakness is evident and sustained, and there has been an initial build-out of inventory
- Prices of new vehicles did not experience huge declines or even any at all in some cycles, the weakness was mostly in volume.
- Employment was reduced but not at a similar pace to sales declines, which could lead to reduced margins.
- As expected, delinquencies and defaults increased, and auto loans declined or did not experience growth during this period as banks tightened credit standards.
In the 2008 Recession particularly
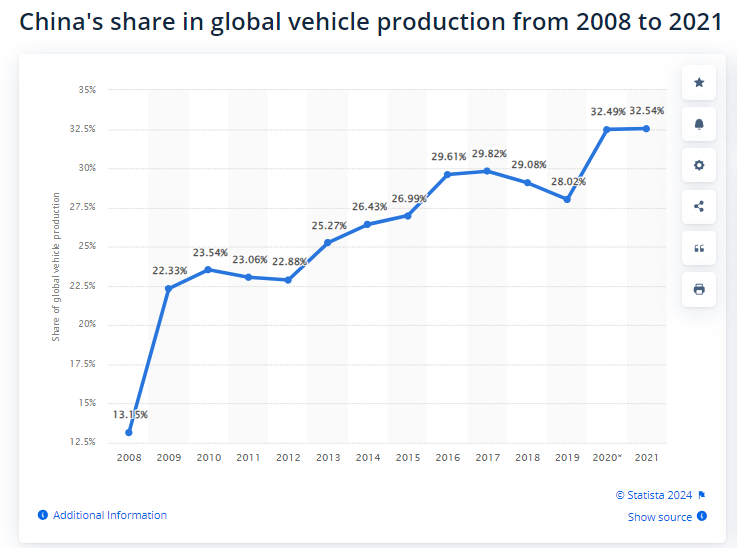
- China was the big winner, while other regions struggled, especially the US. Their market share increased very significantly.
- There were a series of stimulus measures from all regions that helped with the recovery.
- Those government programs mostly benefited smaller/cheaper cars. Sales for 2009 show these types of car segments did better.
- VW could have benefited from the fact they had greater exposure to China, and Germany (Both increased auto sales in 2009), and also due to their greater reliance on smaller/cheaper cars than competitors.
- VW acted as it seems common in the industry: primary action was to adjust inventories, also reduced CAPEX and development costs, and employment was almost unchanged. Weakness was mostly on volume, segment mix, and no prices.
Patterns on important metrics:
Mostly based on US data. Have not been able to find same quality and quantity of data for Europe or other regions, but would like to extend it at some point if possible
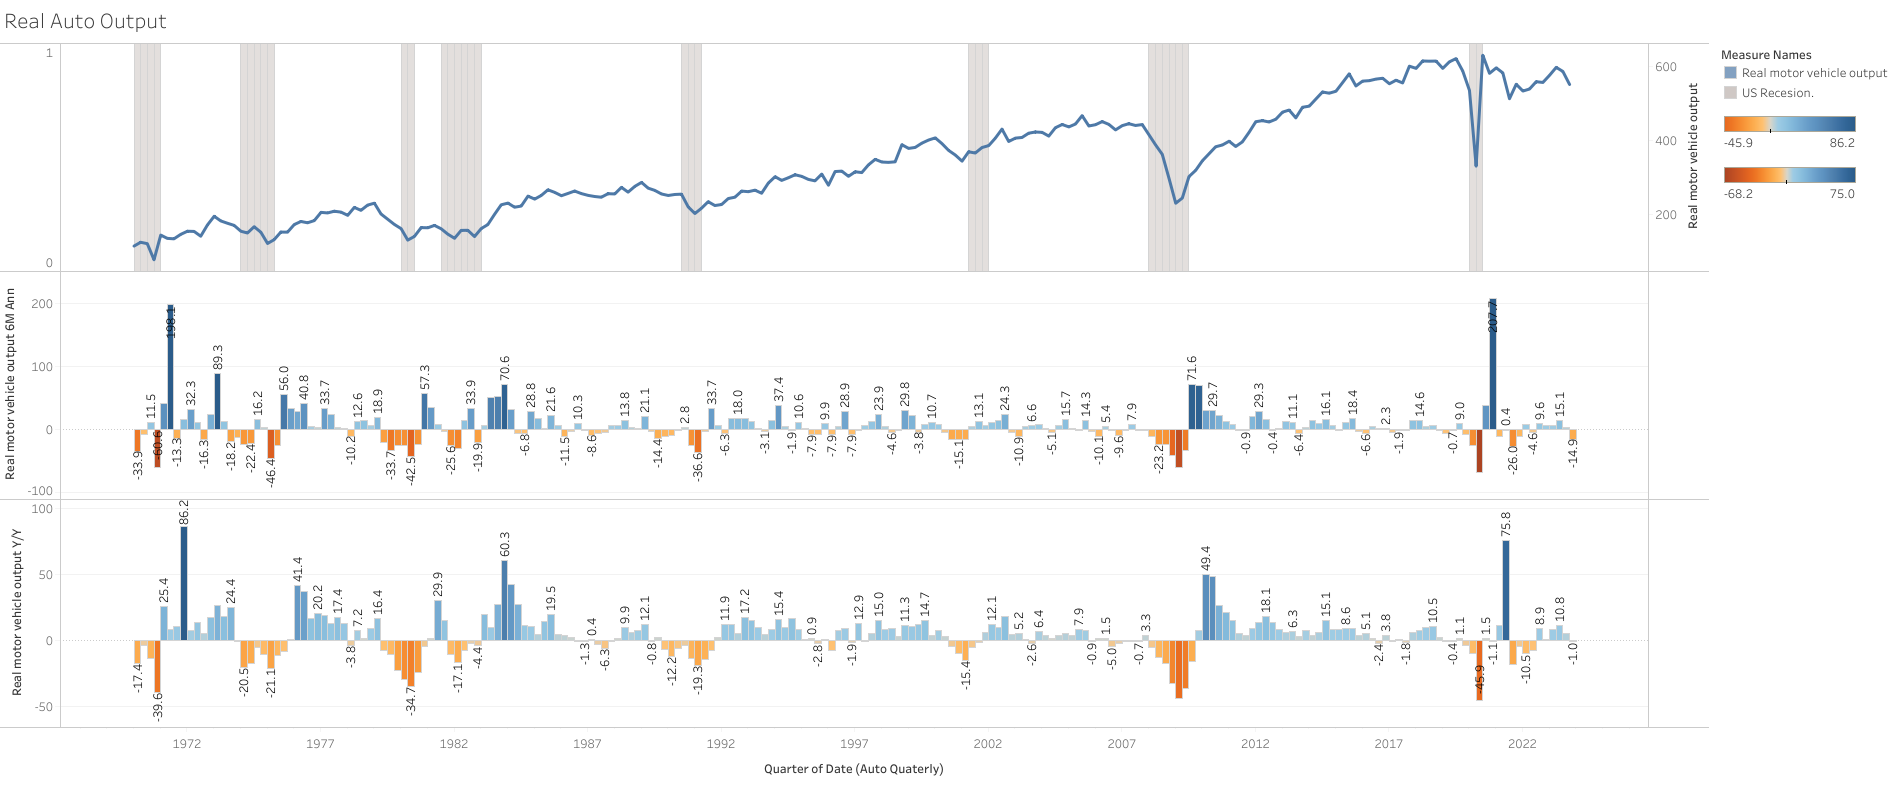
Output
- Seems as GDP or motor vehicle output is more volatile than overall real GDP. While GDP only sees mild declines always, the real motor vehicle output can have a much greater decline (same for sales, inventories, production).
- It also seems that some mild weakness starts to be evident before the overall economy.
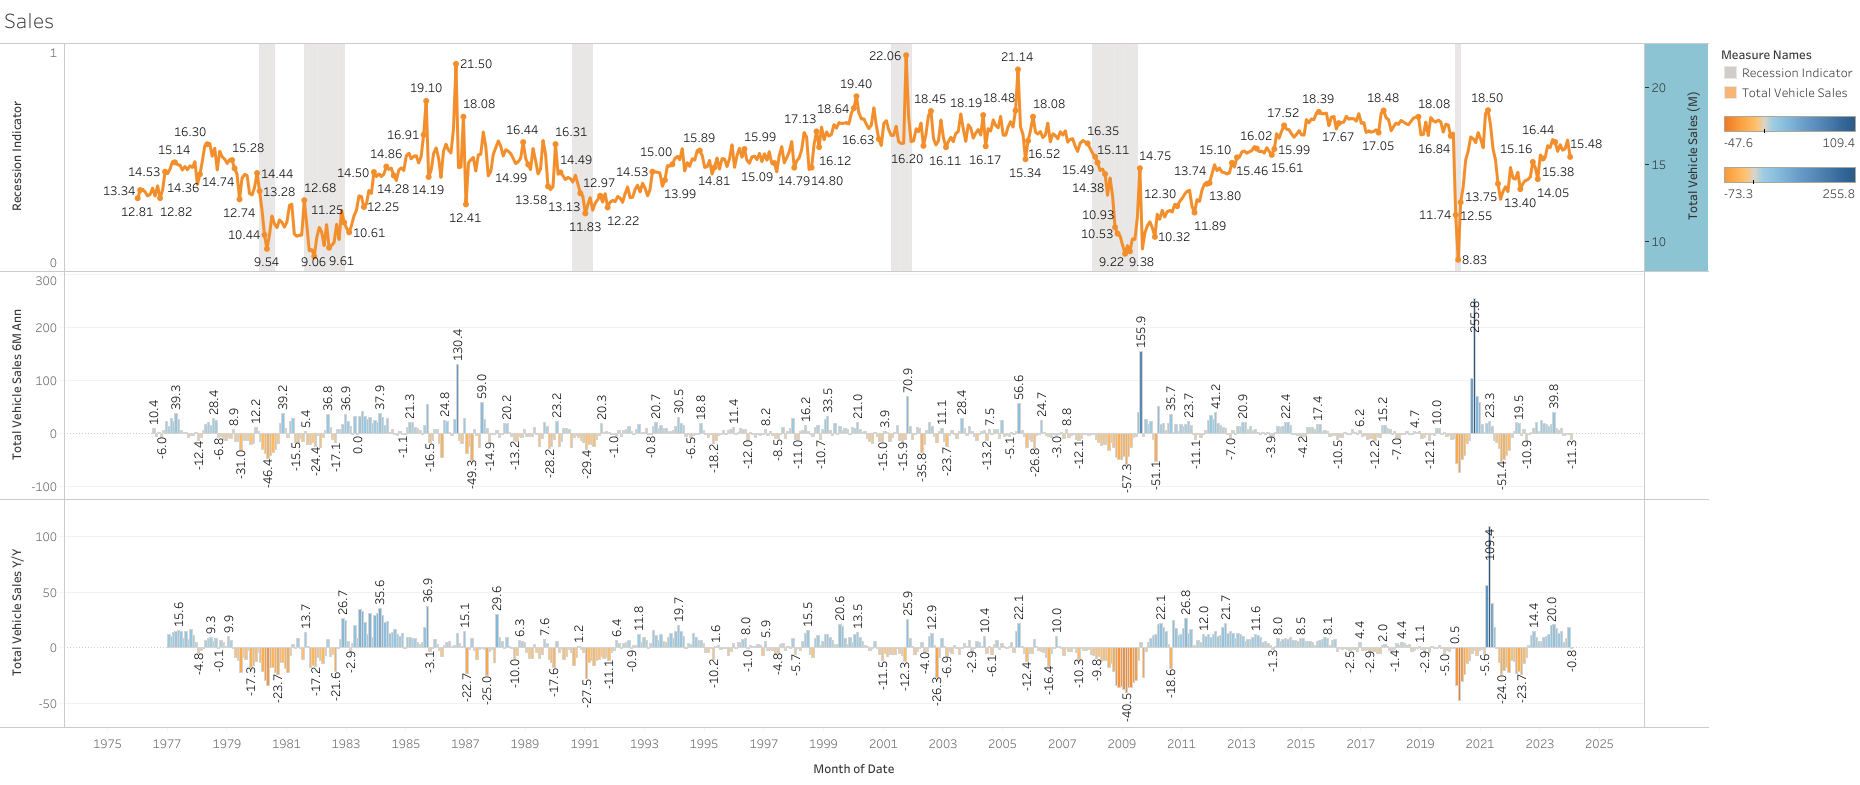
Sales
- Sales are also highly volatile even outside the recessionary periods
- While some weaknesses are evident before a recession, the decline only intensifies after this one has started.
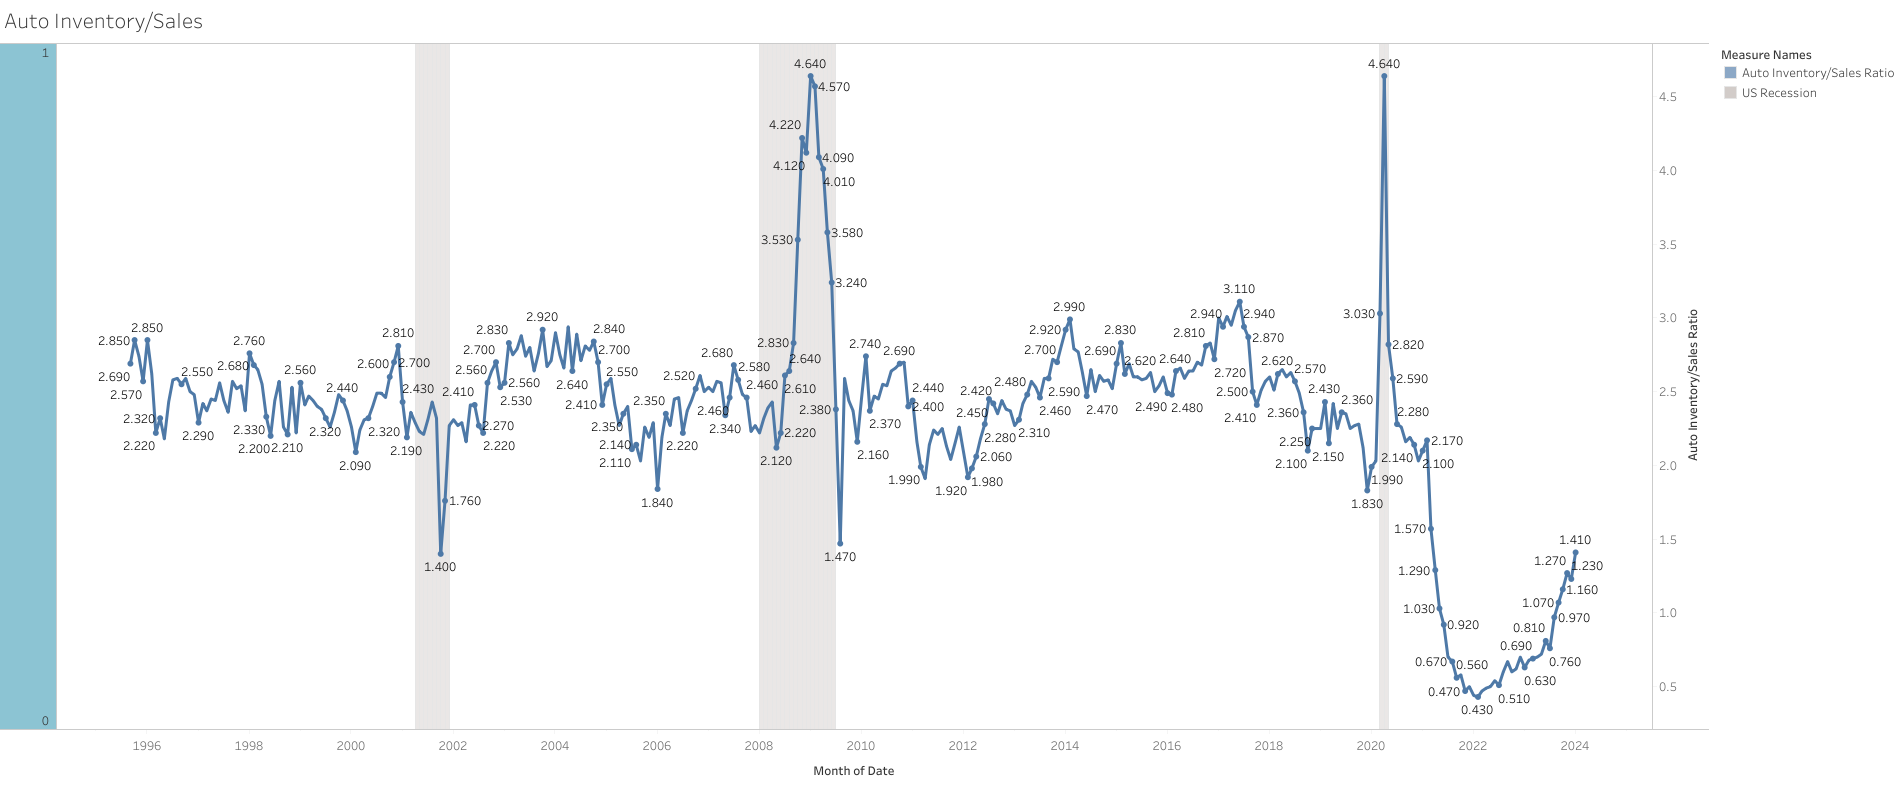
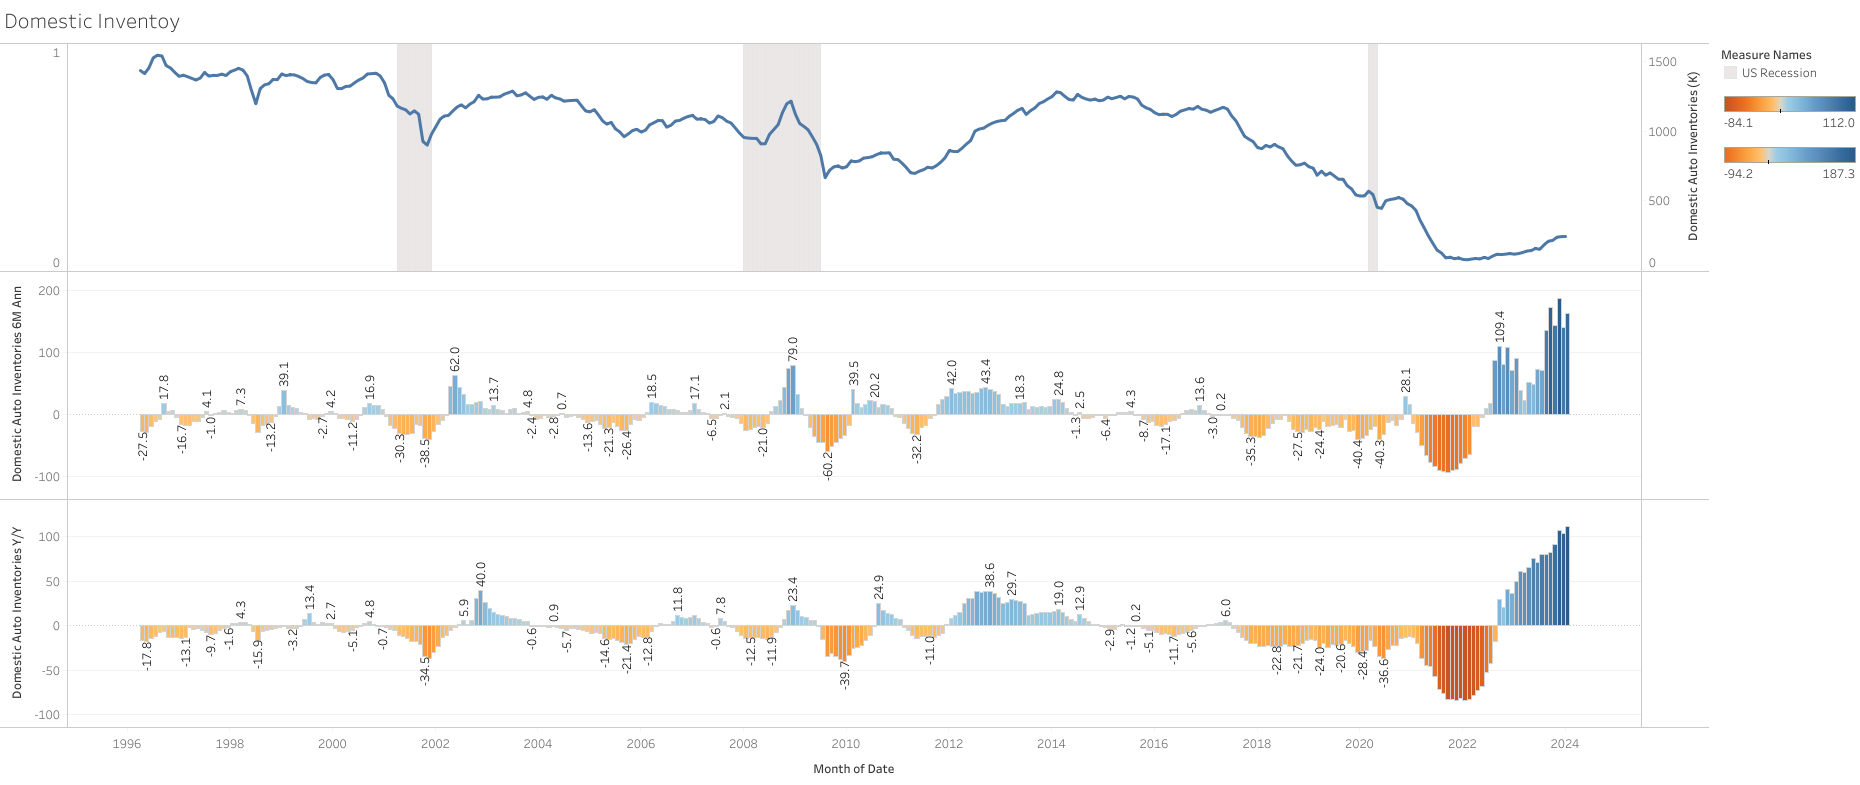
Inventory
Seems as if inventory is only reduced and managed after the decline in sales, and not before. Suggesting there is no proactivity in inventory management until the weakness is very evident, and already months into the recession.
- As sales decline, there is an initial build-out of inventory, and the inventory-to-sales ratio spiked
- Domestic Inventories are only reduced after this initial spike.
- Inventories are adjusted in a similar magnitude to sales declines.
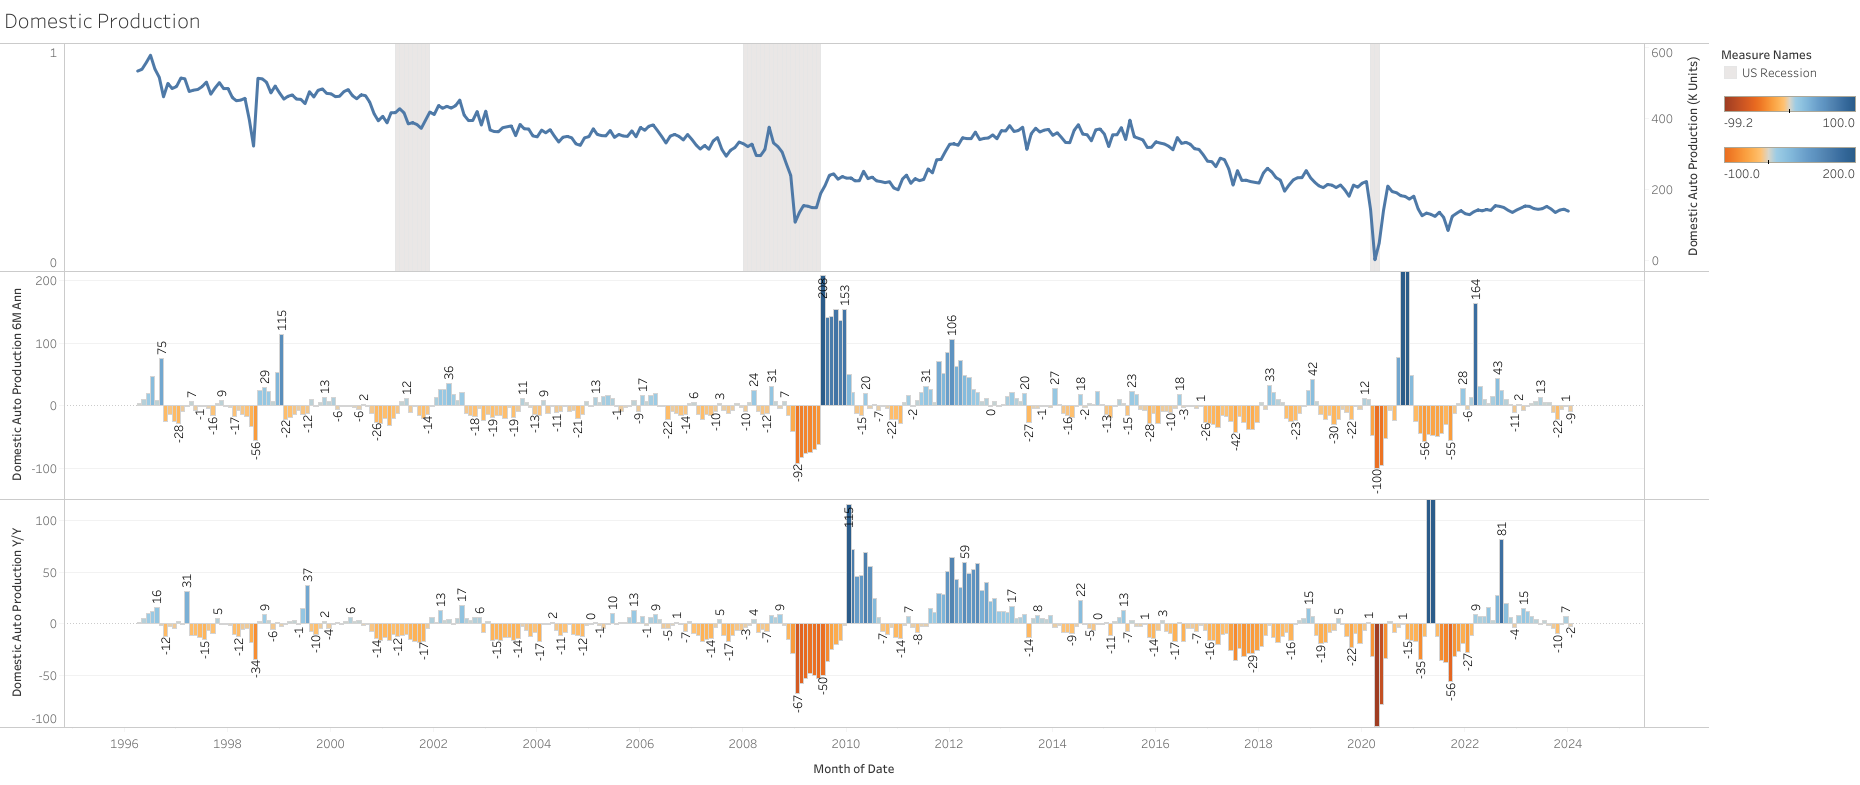
Production
- Production follows a similar pattern to inventories, they are adjusted only after sales start to decline, and it is also highly volatile.
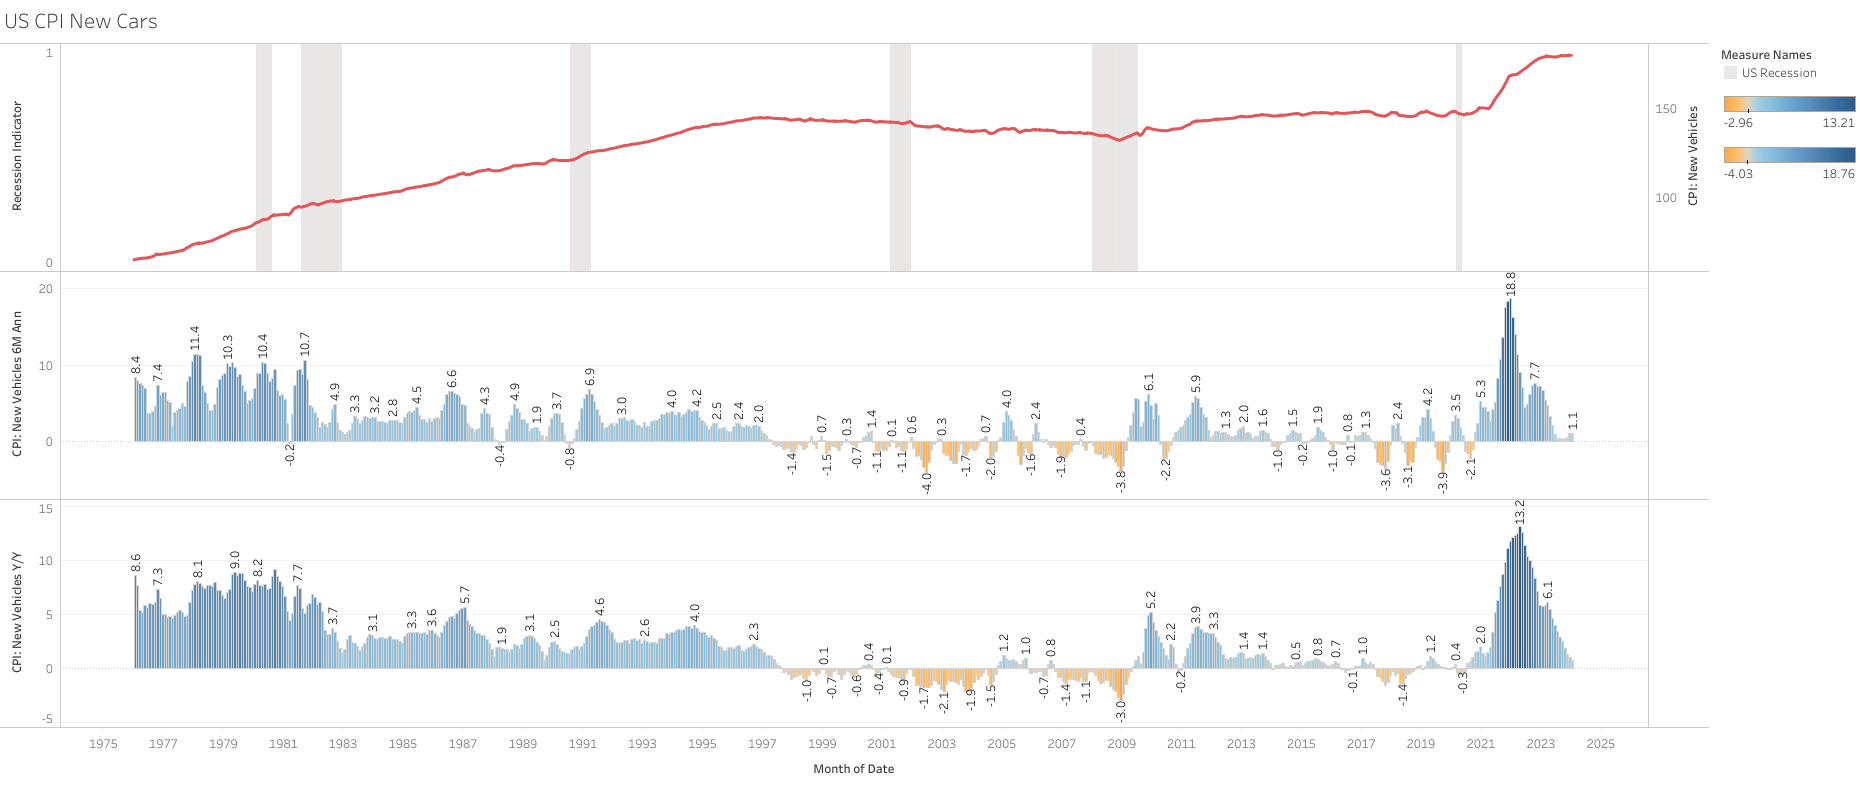
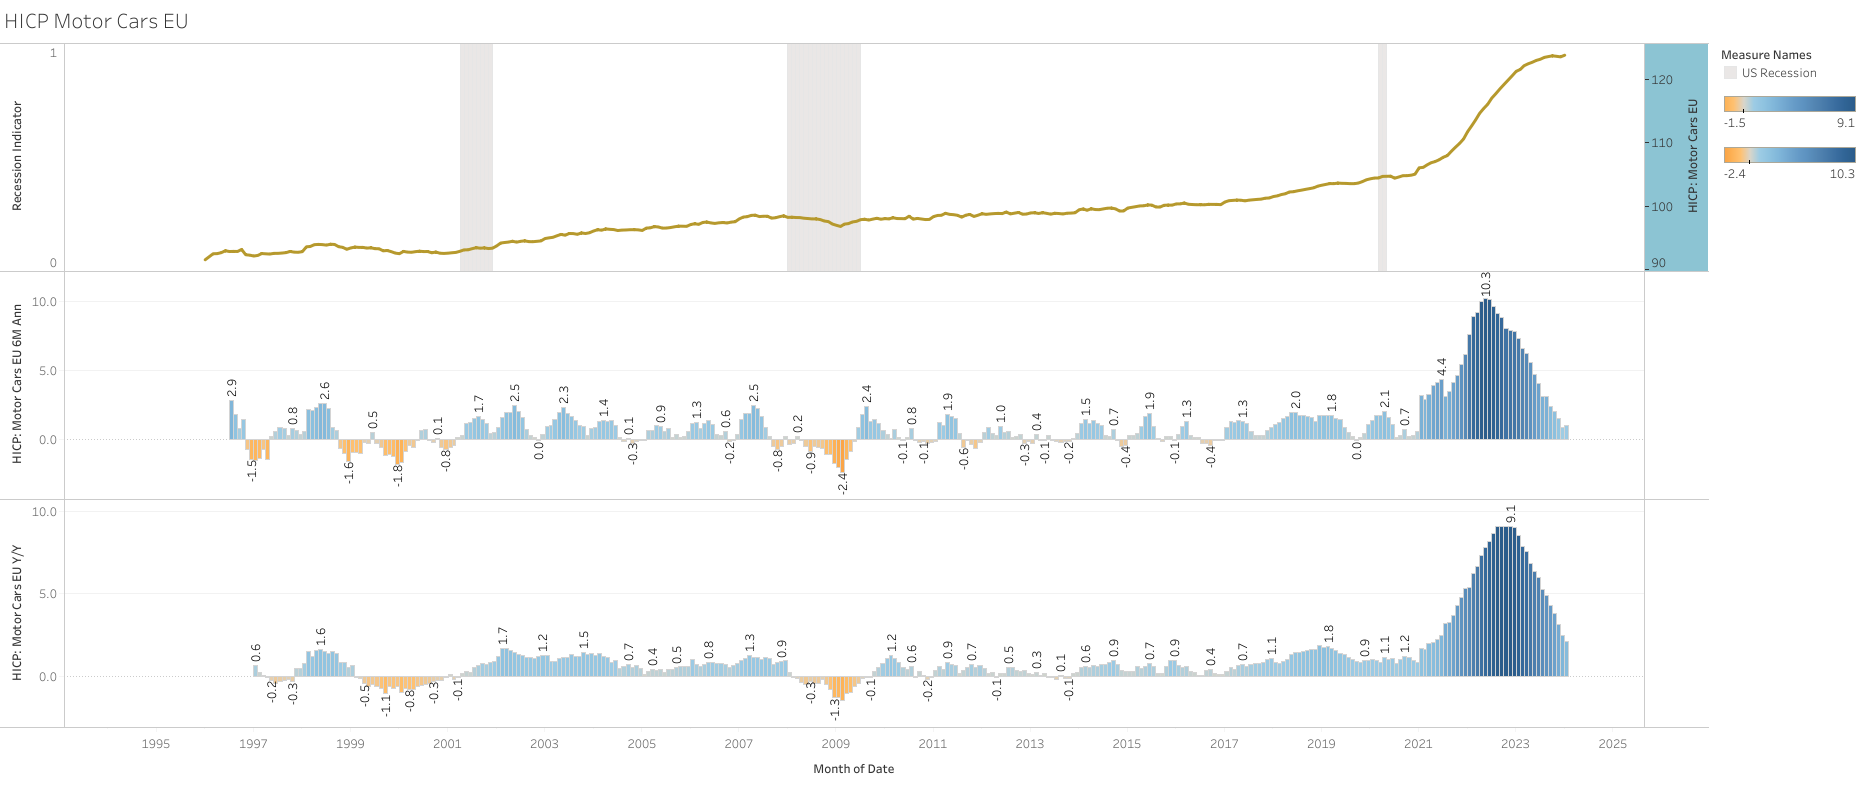
Prices
- Prices (US and EU) have had mild declines or no declines at all in past economic contractions. Suggesting the majority of the decline is in volume, and not so much in prices.
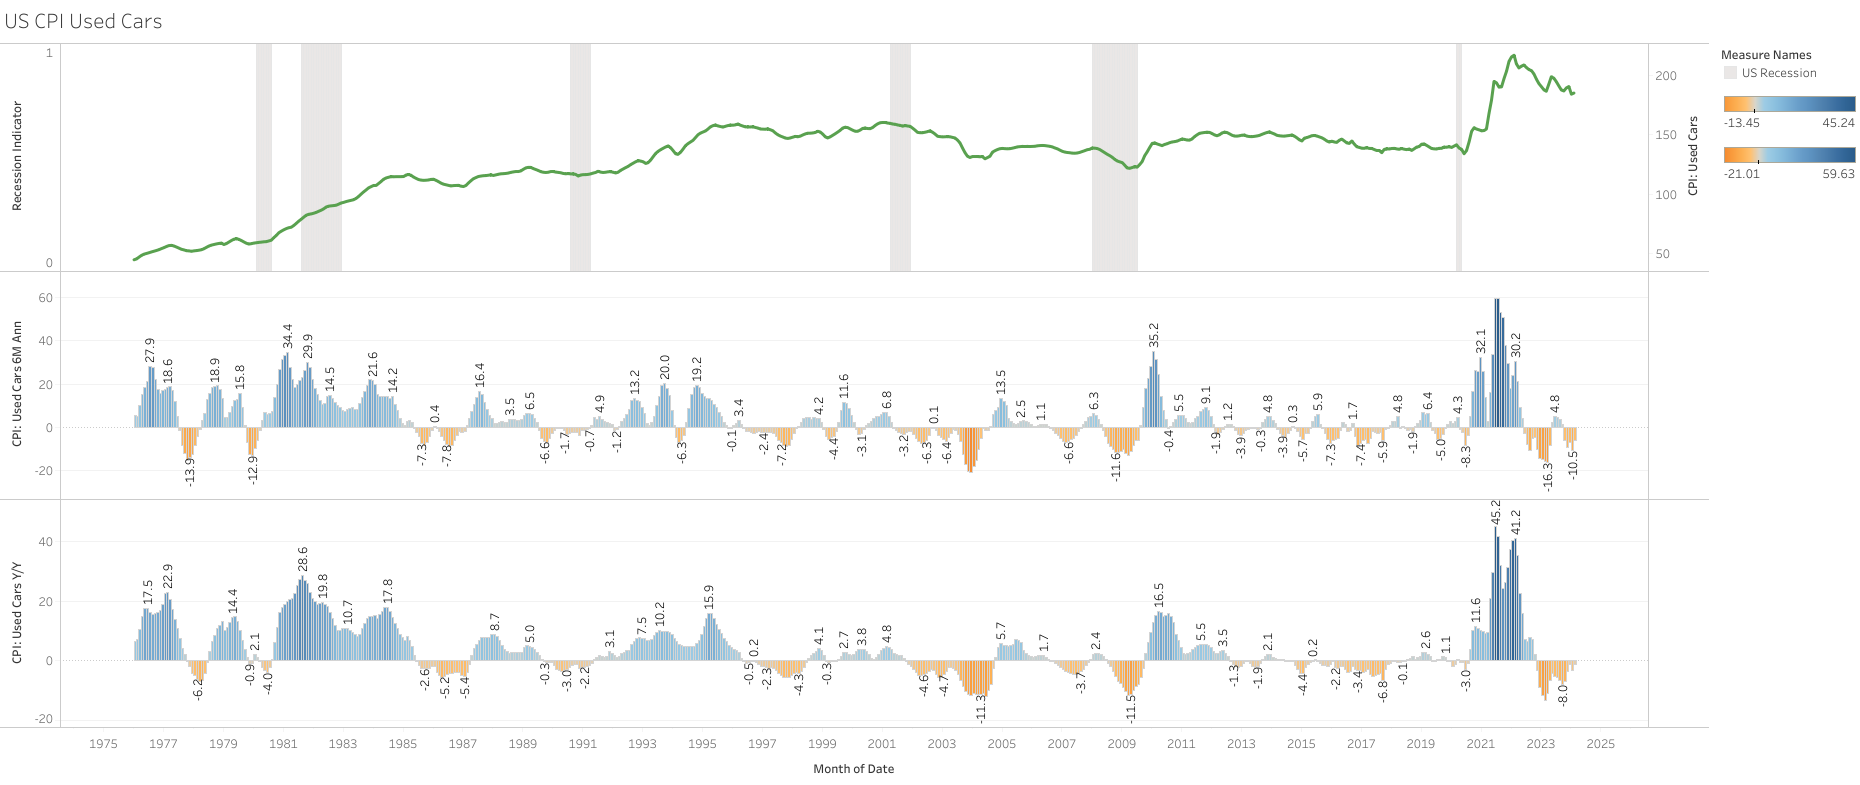
- Used car prices have bigger declines than new car prices, but is highly volatile even on periods outside recessions. Similar trend we are experiencing today.
Employment
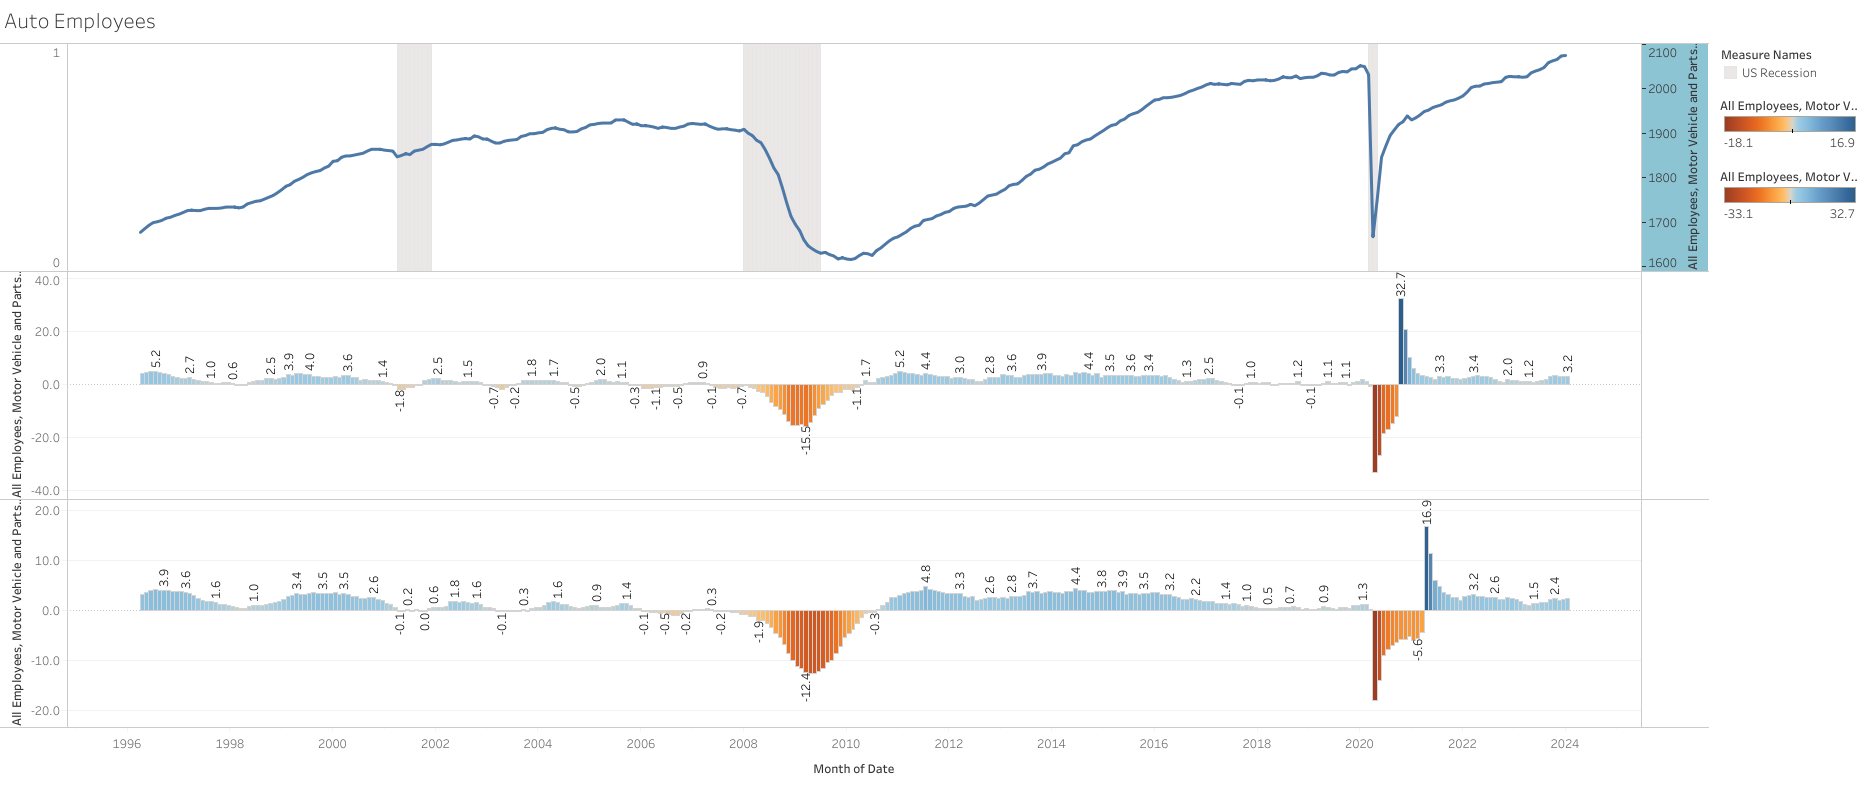
- Employment in the motor vehicle sector does come down during recessions, but not in the same magnitude that sales or production does.
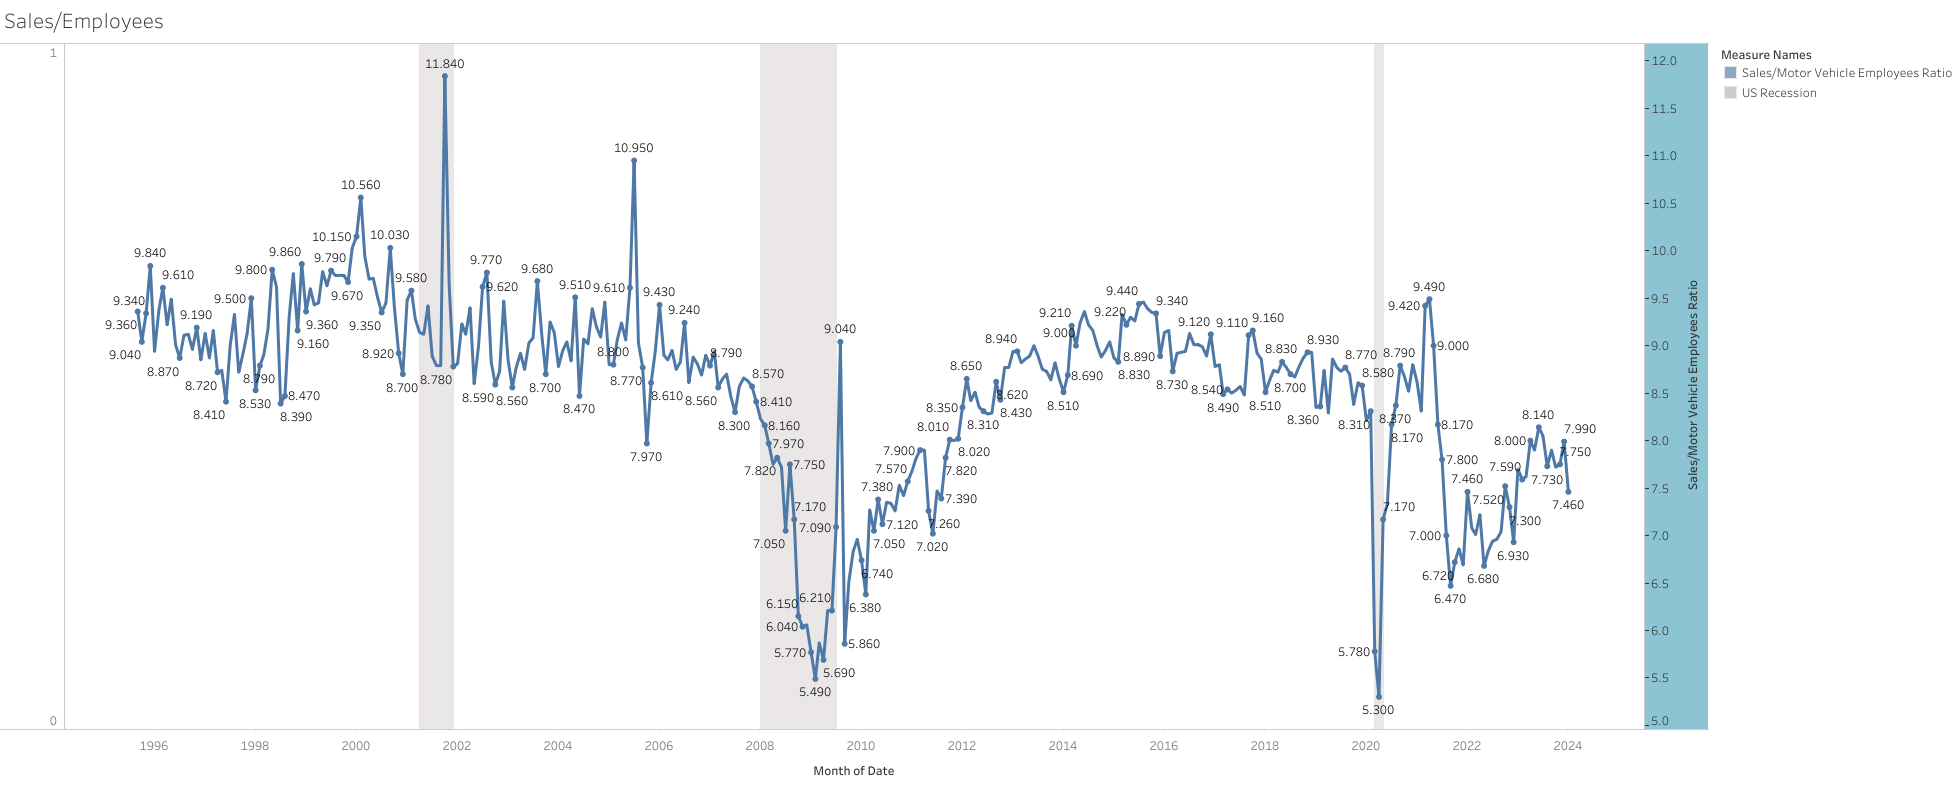
- The sales-to-employee ratio comes down during these periods. Which could suggest a reduction in margins for manufacturers.
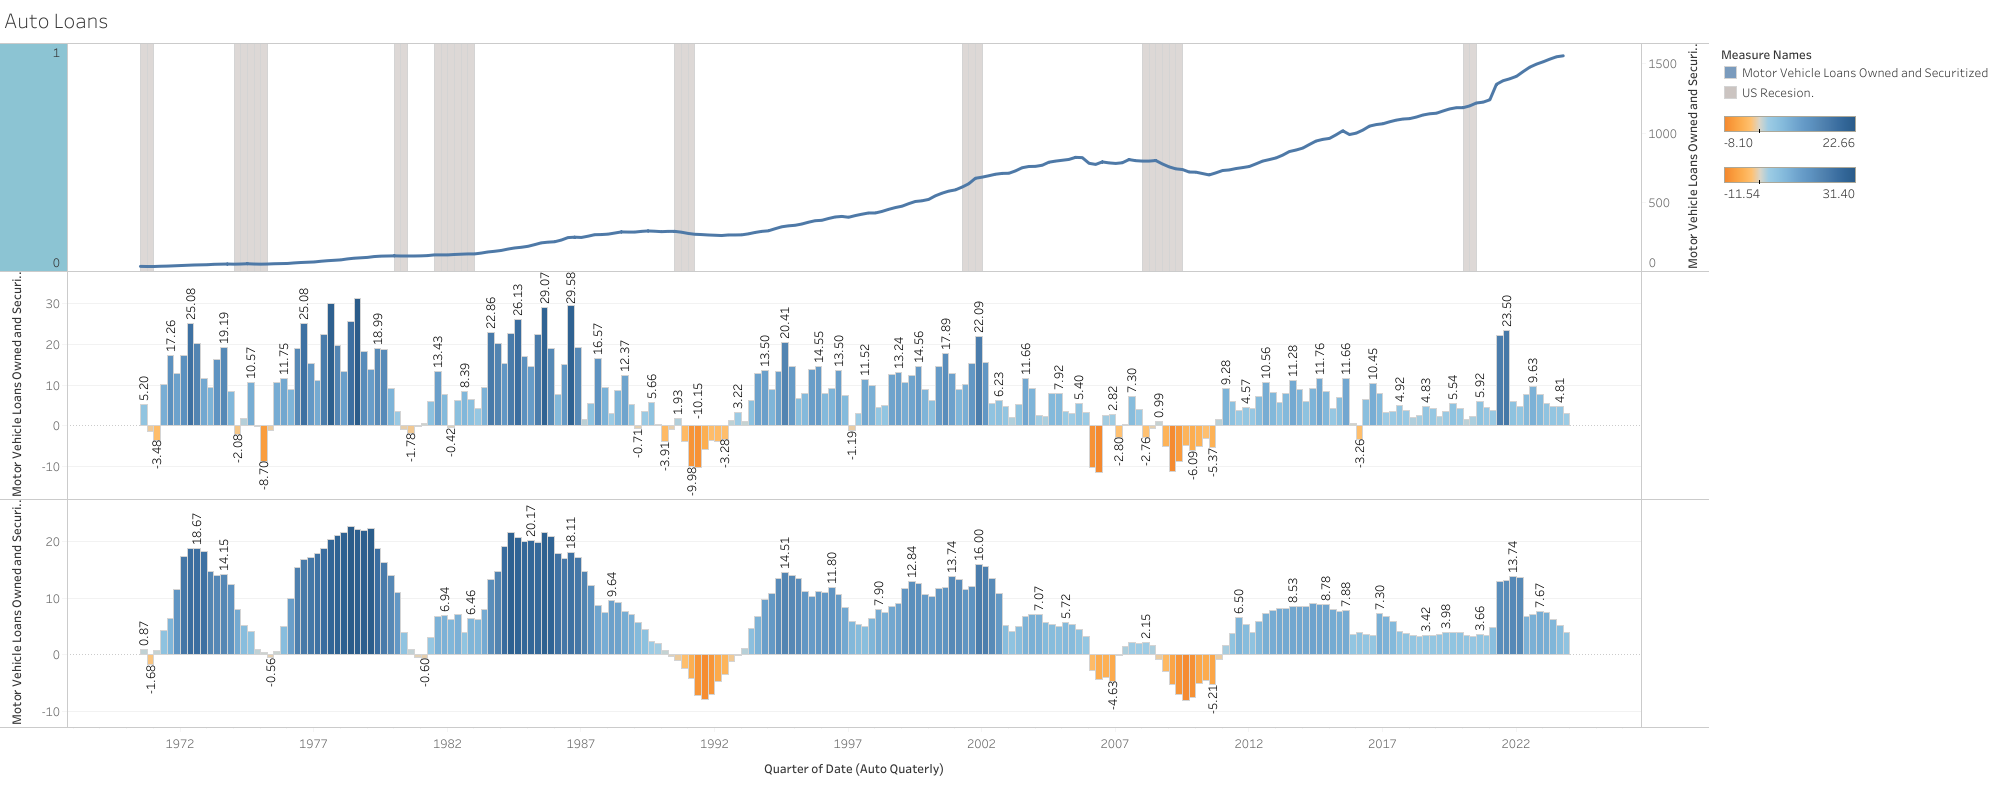
Credit
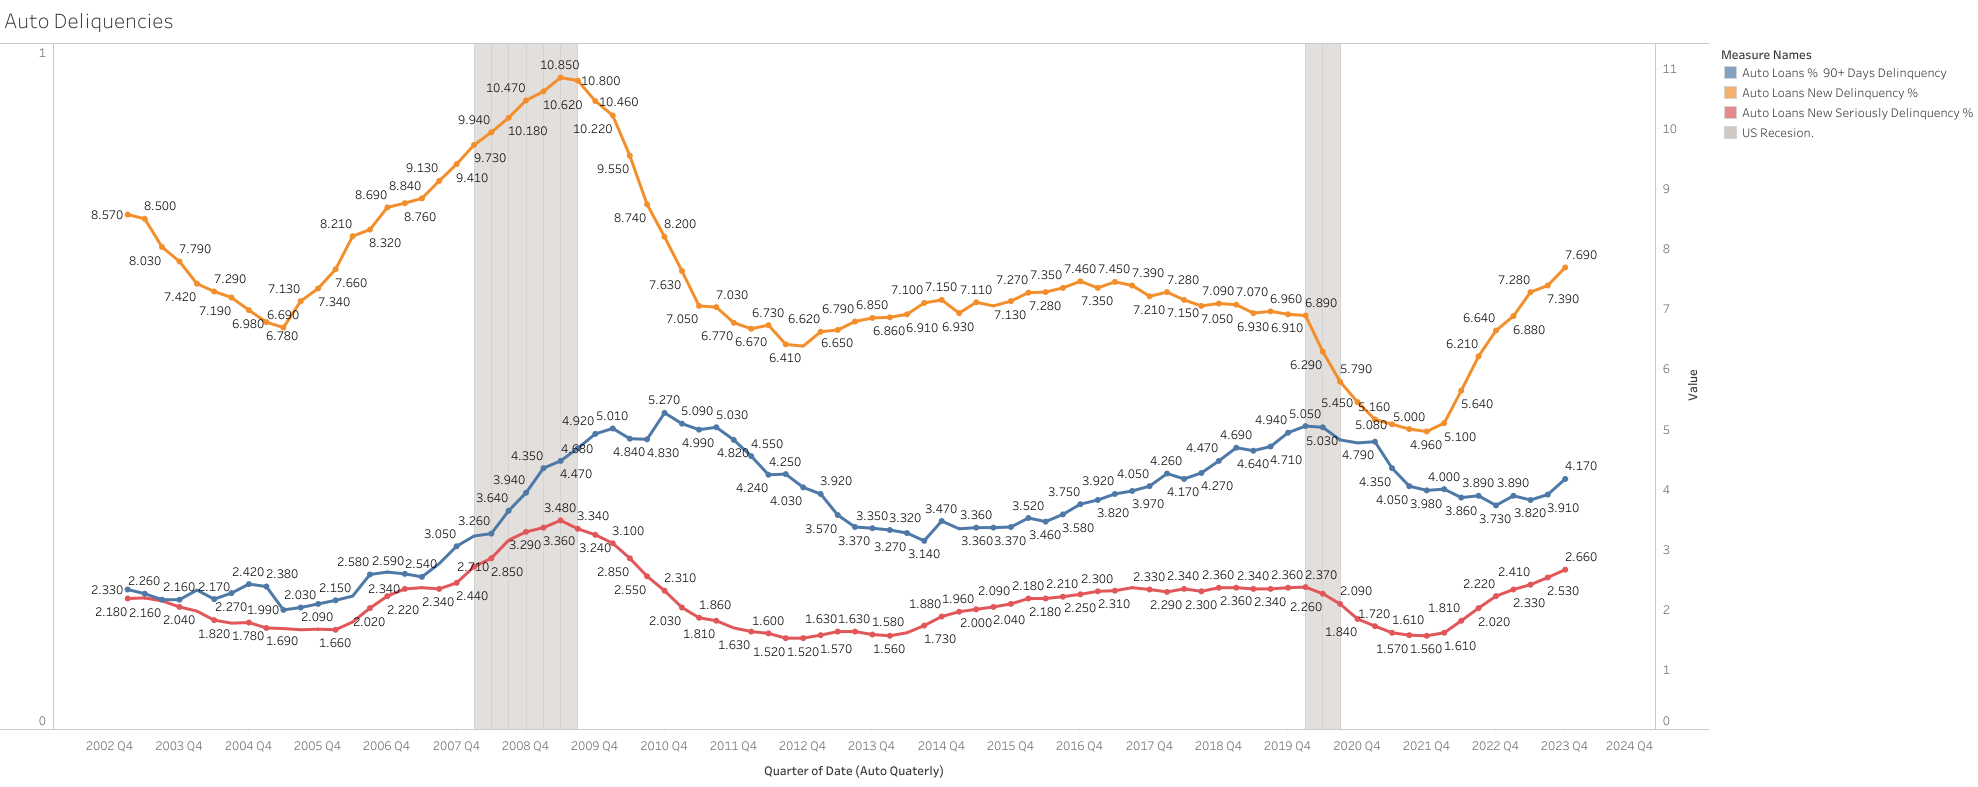
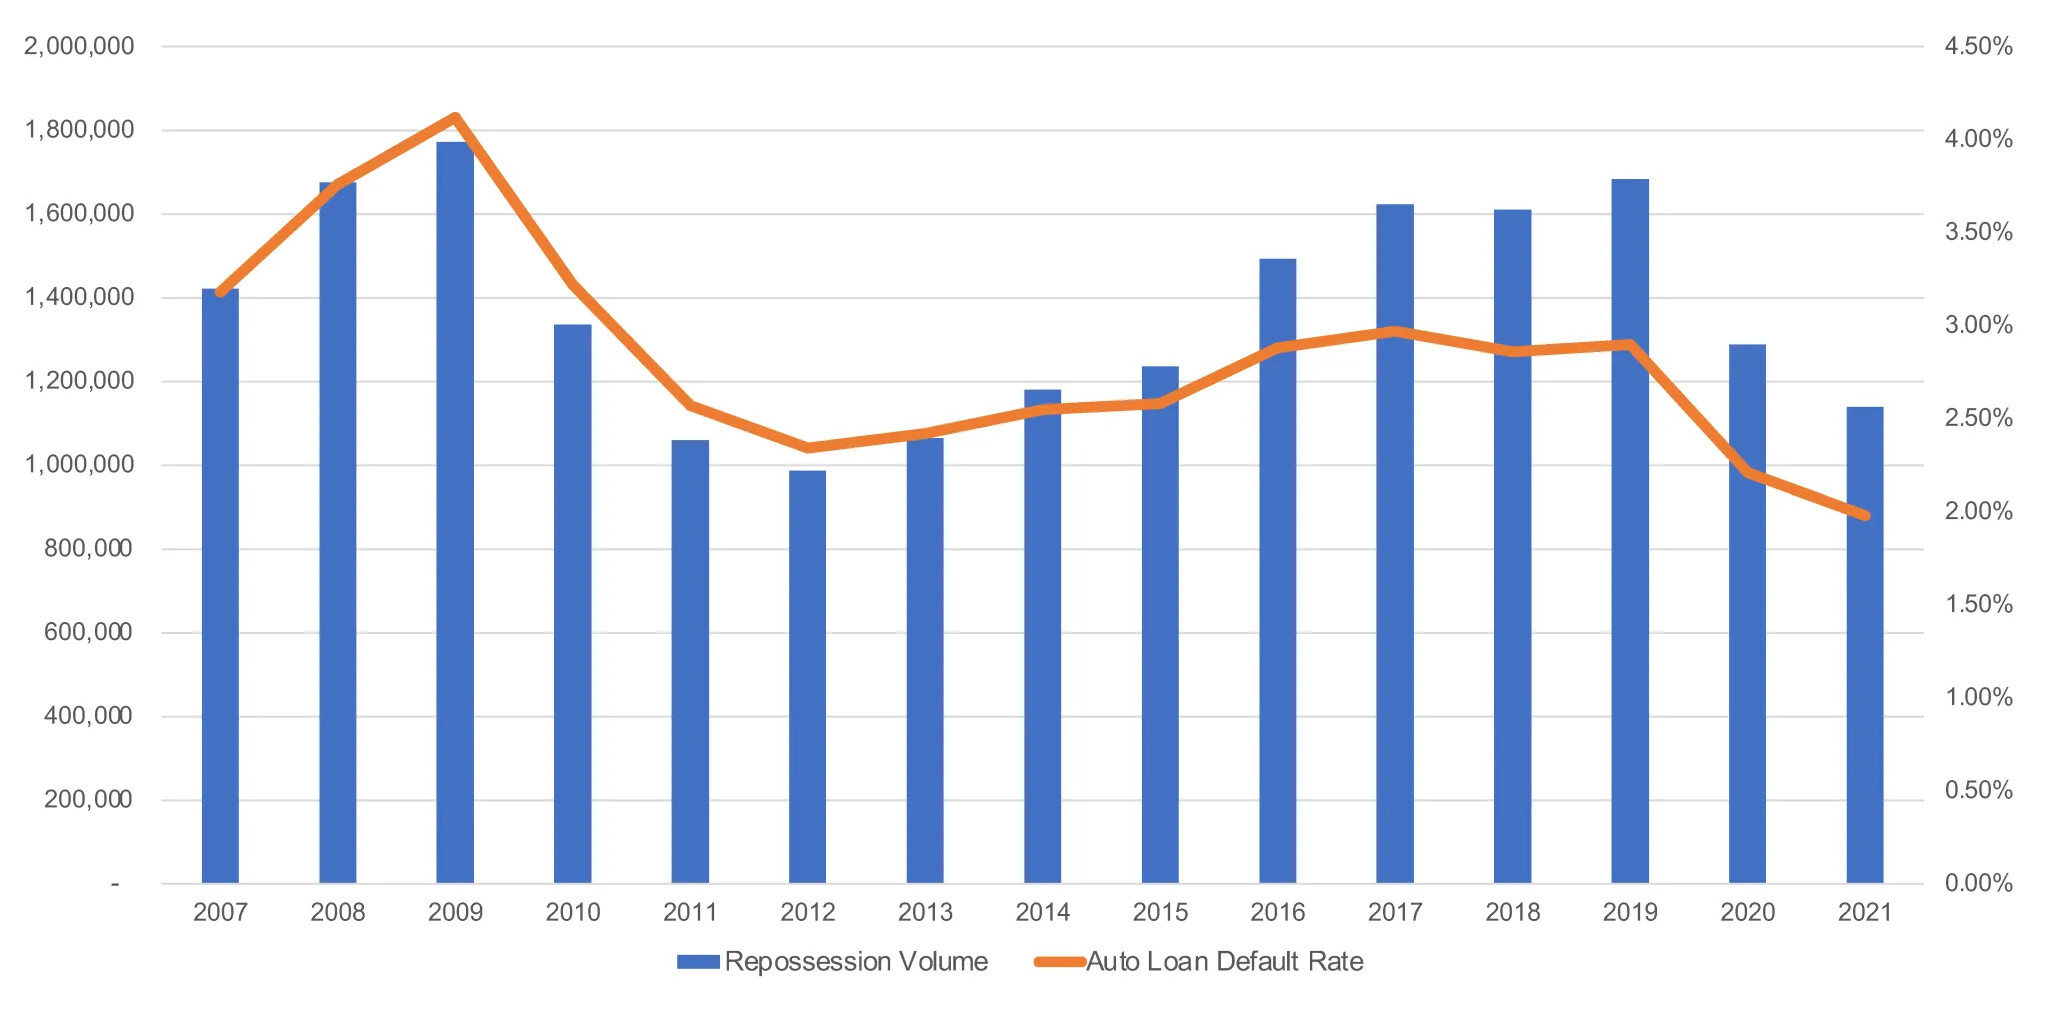
- As expected auto loan delinquencies spiked during recessions, starting to increase quarters before, but peaking at or after the recession.
- Auto defaults and repossessions also experienced an increase.
- Auto Loans also have declines, milder than overall sales.
Geography:
The impact of the car business in the 2008 recession was significantly different between regions.
Here is how production behaved in most regions.
- The US was the most affected by the recession as expected. Their production declined by more than 40% and sales fell close to 40% from the high.
- Europe had a ~23% decline in production from 2007 to 2009, and sales declined 9.3% during the same period. However European sales did not recover until 2014 for a total decline of ~23%, since the EU also experienced the Eurozone crisis after the 2008 crisis.
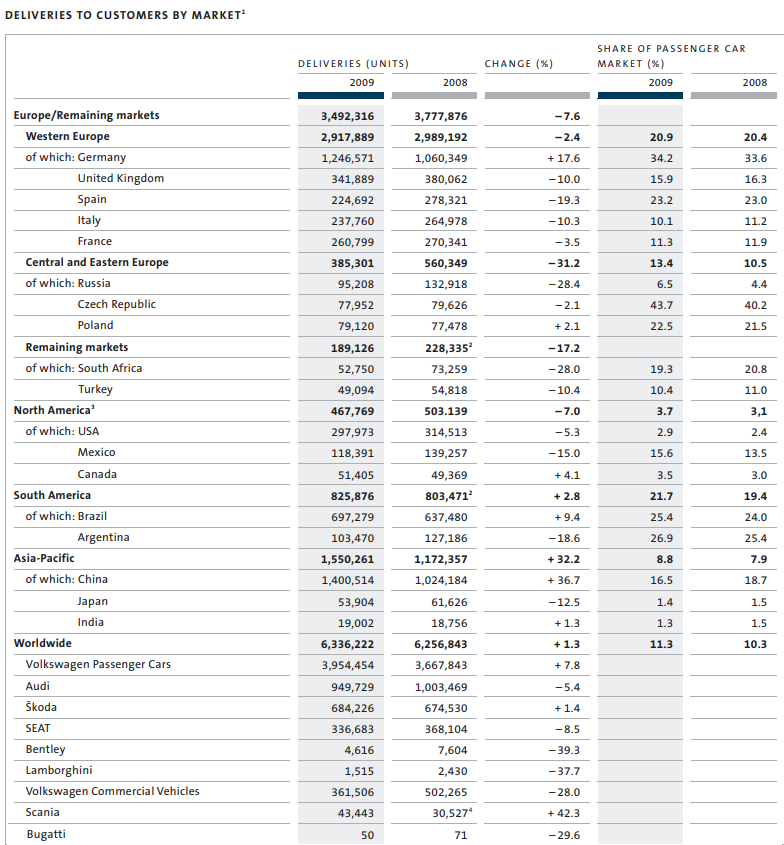
- China was the big winner, car sales increased by 53% in 2009, and 33% in 2020, and similar results for production. China used a series of big stimuli to gain market share during this difficult period for other regions.
What segments of the market did better
More than companies’ strategies, a significant factor influencing the recovery, and the winners and losers was the government stimulus. Programs in US, Europe and China were mainly focus on supporting sales of smaller, and more fuel-efficient cars.
The fact that there was a huge oil spike in the middle of the crisis, and the lower affordability by consumers due to an impact on their income and their uncertainty during a recession, could have also influenced the preference for smaller/cheaper cars during this period.
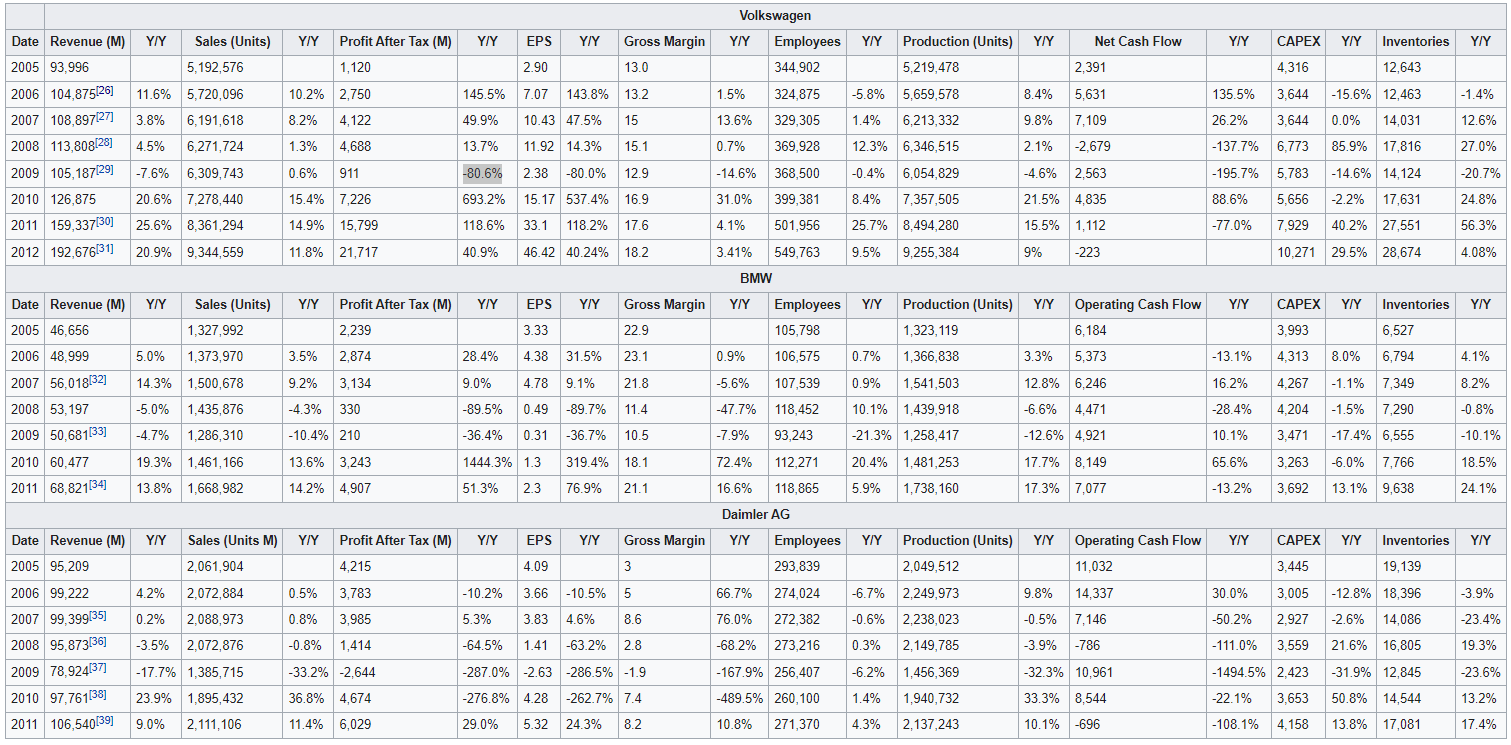
payments to car buyers encouraged sales of smaller, lighter and more fuel-efficient cars**, helping Italy’s Fiat Group SpA grow sales by 6.3 percent, France’s Renault SA by 3.9 percent and Volkswagen AG — Europe’s biggest car maker — by 0.7 percent. Heavier and more expensive models suffered. BMW’s sales were down 13.6 percent and Daimler by 13 percent.
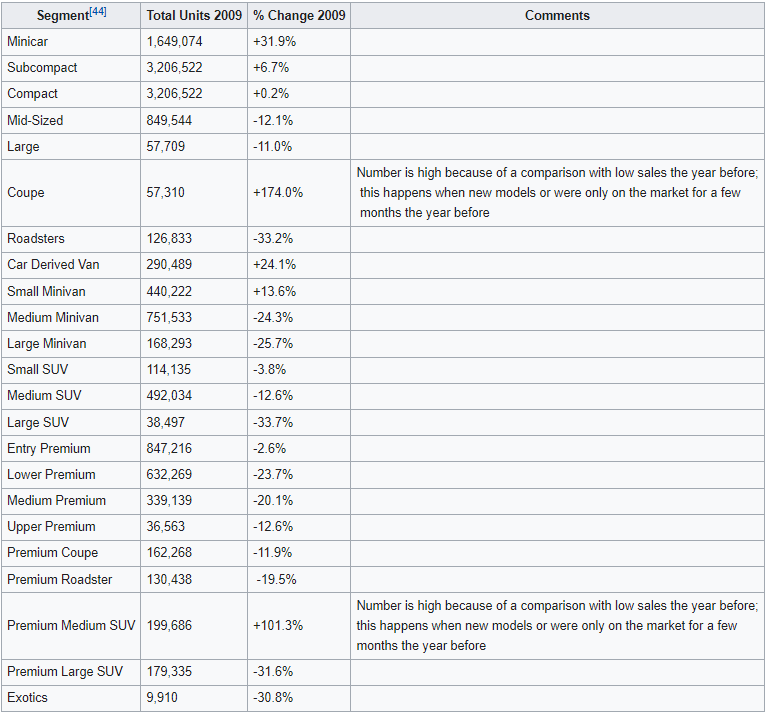
Was shown that larger cars, premium and luxury brands, and light commercial vehicles have been only marginal beneficiaries of these schemes. Two-thirds of the 2.16 million units of estimated additional demand in Europe generated by scrapping schemes was in the lowest price segments.
-
This can be seen in sales data from Europe, overall smaller/cheaper segments did better on 2009.
Will try to find similar data for other regions
-
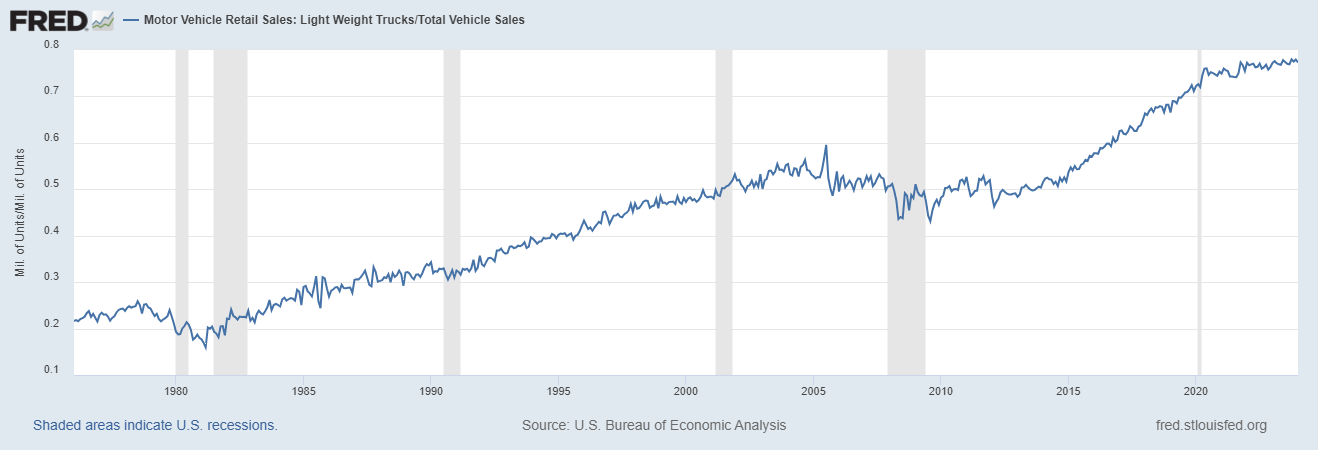
The US also shows a slight decline of lightweight trucks as a % of total sales during this period.
-
Also, auto manufacturers that had more reliance on Europe and China during 2008 were much less affected. First, as mentioned the US was the most impacted during the crisis, but stimulus programs seem to also have been more effective in Europe and especially China.
How did Wolkwagen manage the crisis:
VW did better than its competitors in most metrics, however, they also experienced an 80% decline in profits due to a temporary decline in margin.
VW recovery was already evident in 2010 with significant increases in revenue and profits, despite EU overall weakness, due to their focus on other regions too.
Details
From my research, their outperformance is mainly because of 2 points:
- VW had more exposure to smaller/compact cars than its competitors. And due to this, they also benefited more from the stimulus programs.
- VW had more exposure to China, which was booming during this period. And Germany, particularly, also did pretty well, due to the government subsidy programs.
According to their 2009 annual report, this is how they managed the crisis
- The 9.3% y/y decline in automotive revenue was mainly due to volume and mix deterioration. The shift in volumes towards smaller vehicles, especially in Germany, had a particularly adverse effect.
- Volkswagen Group’s financial position was strengthened above all by optimized inventories. However, they did this in 2009 after inventories had already built out in 2008, and 1 year after the recession started.
- The reduction of inventories (-20%) and receivables freed cash tied in working capital, which led to a significant increase in cash flows from operations.
- They also reduced CAPEX by 14%, and development costs by 12%
- Employees barely declined (-0.4%), and it could be one of the main reasons their profits fell so much, as expenses remained more or less the same.
Why other car markers failed:
I haven’t done much research on this, but I will take GM as an example of what I have gathered:
- In this case, GM was already weak, and badly managed way before the 2008 crisis. They stopped being profitable in 2005. The recession only added fuel to an already weak company.
- Their management was more profit-oriented and left behind focus on quality and innovation.
- Customers preferences were changing to more fuel-efficient cars (Oil spike could have had an impact on this), but GM failed to change its product mix since its biggest profit was on its larger, less fuel-efficient models.
- The company had lots of fixed costs for its manufacturing process. When sales went down, the costs didn’t.